Figure 1.
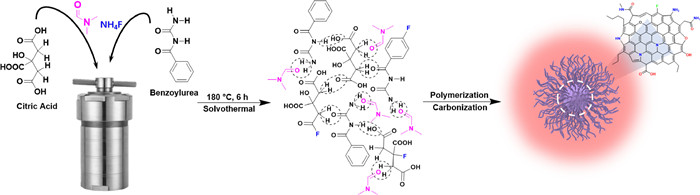
Schematic illustration of the preparation process for RCPDs.
Red/NIR emission carbonized polymer dots based on citric acid-benzoylurea and their application in lymph nodes imaging
Feishi Shan , Tingrui Zhang , Chengshuang Liao , Xue Yue , Jing Zhang , Li Yan , Yanman Liu , Zhixing Cao , Min Wang , Yahui Zhang , Leyong Wang , Zhouyu Wang , Xiaoqi Yu

Carbonized polymer dots (CPDs), a significant branch of carbon dots (CDs), are composed of carbon cores and connected polymer chains [1–7]. Due to its readily available, attractive optical properties, low toxicity and excellent biocompatibility, CPDs have been widely applied in bioimaging [8–11], such as cell imaging [12–14], organelle targeting [15–18] and in vivo imaging [19–24]. In particular, in vivo imaging holds greatly promise for understanding physiological information [20], disease diagnosis [25] and drug delivery [26]. In 2018, in vivo fluorescence imaging of a living mouse using CDs modified with poly(vinylpyrrolidone) in aqueous solution are demonstrated by Qu’s group [19]. The N–CDs-F has prepared through solvothermal method which show bright deep-red to near infrared (NIR) fluorescence in vivo by Bi and co-workers in 2020 [20]. In the same year, Yang et al. developed a taxus leaves-derived CPDs. The CPDs can serve as deep red in vivo fluorescent probe with outstanding biocompatibility and fast clearance [21]. A novel design strategy to prepare red-emissive CDs with a large Stokes shift was reported by Li’s group in 2022. The CDs made them suitable for in vivo imaging with reduced background autofluorescence and gave the possibility for multicolor imaging [22]. Also in 2022, two-photon red fluorescence imaging of mouse ear vessels based on CDs were first realized by Qu’s group [23]. However, there have been few reports of tissues or organs being targeted by CDs for imaging.
Lymphatic system plays an important role in fluid balance [27], lipid absorption [28] and diseases such as infection [29], inflammation [30] and cancer [31]. Lymph nodes (LNs) are the main sites of metastasis for many cancers, such as melanoma [32], gastric cancer [33] and breast cancer [34]. Non-destructive and visual imaging of LNs is important for understanding the role of LNs in disease occurrence and evaluating the effectiveness of disease treatment [35,36]. Due to the specificity of LNs structure, the fluorescent macromolecules or nanoparticles are often used in LNs imaging, such as dye molecules [37,38], quantum dots [39,40] and nanoprobes [41,42]. However, LNs imaging of CPDs had been a largely under explored domain. In addition, it is generally recognized that red/NIR emission dyes are known to have deeper tissue penetration, avoiding the wavelength range of tissue autofluorescence and showing great potential for in vivo tissue imaging [43–46]. We are curious whether CPDs could be a potential target imaging reagent for LNs due to the special “core-shell” structure and excellent photoluminescence (PL) properties.
As known to all, the preparation of CPDs with excellent properties by changing the synthesis conditions [20,47-50]. On the other hand, materials with better fluorescent properties and wide range of applications were obtained by modifying the precursor [51,52]. Therefore, we think that the introducing a conjugated group (benzoyl) on the urea skeleton maybe an effective way to obtain the CPDs with long wavelength properties and in-depth biological applications. Herein, we report a red/NIR emission CPDs (RCPDs) have polymer characteristics, consisting of carbon cores and the shells of polymer chains. Excellent PL properties, low toxicity and good biocompatibility make RCPDs efficient dyes for one-photon and two-photon bioimaging. After caudal vein injection, the neck LNs, axillary LNs, and inguinal LNs are enriched by RCPDs more rapidly and imaging is achieved. Lymphocyte homing has been validated as the mechanism of RCPDs target LNs, which provides an idea for the design of LNs targeting CPDs.
The preparation process of RCPDs is shown in Fig. 1. In a typical experiment, citric acid (CA) (0.500 g, 2.60 mmol), benzoylurea (BU) (1.000 g, 6.09 mmol) and NH4F (0.100 g, 2.70 mmol) were dissolved in N,N-dimethylformamide (DMF) (10 mL) and reacted at 180 ℃ for 6 h. After cooling to room temperature, the obtained dark brown suspension was poured into a NaOH aqueous solution (pH 13, 20 mL) and centrifuged to obtain a black precipitate. The precipitate was washed with an aqueous HCl solution (pH 2, 20 mL) and then ultrapure water (20 mL). Finally, the target CPDs (RCPDs) was obtained after 48 h of drying in a freeze dryer.
As shown in Fig. 2a, transmission electron microscopy (TEM) showed that RCPDs were dot-like with an average diameter of 1.82 ± 0.4 nm (based on 400 RCPDs), and RCPDs had a uniform size distribution and ultra-small size. High resolution TEM (HRTEM) images revealed the lattice in the carbon core of RCPDs with an average lattice spacing of 0.14 ± 0.05 nm (400 lattices in total), which is a crucial sign that CPDs are different from graphene quantum dots (GQDs) [53]. In addition, the carbon core structure of RCPDs was characterized by Raman spectrum (Fig. S1 in Supporting information) and X-ray diffraction (XRD) spectrum (Fig. S2 in Supporting information). Raman spectrum shows that RCPDs have relatively clear D peaks and G peaks, and the peak signal confirms that the carbon core has a graphene structure [54]. The XRD results show that RCPDs have a relatively obvious diffraction peak near 21°, which also confirms the existence of the carbon core structure. As TEM can only record the carbon nucleus morphology of RCPDs, atomic force microscopy (AFM) was further used to obtain the accurate polymer structure [21,55]. The average height of RCPDs observed by AFM was 6.6 ± 1.2 nm (Fig. 2b), which was significantly different from the results measured by TEM. The AFM results indicate that RCPDs are most likely composed of polymeric cages and highly carbonized carbon cores. Dynamic light scatter (DLS) demonstrates that the average size of the aqueous solution of RCPDs is about 124.6 ± 45.2 nm, also indicating the existence of polymer cages/chains. The DLS have been reported to investigate the CPDs globally [12,21,49,56-58]. As we all know, the principle of DLS is based on the scattering of light by particles and its calculation equation is based on the model of spherical particles. If the scattering object is an arbitrarily coiled polymer, the calculated hydration diameter is just an apparent value. In addition, the hydration diameter contains the solvent layer bound to the surface of the measured particles or other molecules moving with the particles. So, the complexity of the "shell" of CPDs will greatly increase the test results. In short, the DLS test results are far greater than TEM or AFM test results because that most CPDs are not solid nanoparticles but loose polymer structures. So, TEM, AFM and DLS test results for CPDs are quite different, which just shows the structural differences between CPDs and other nanoparticles.
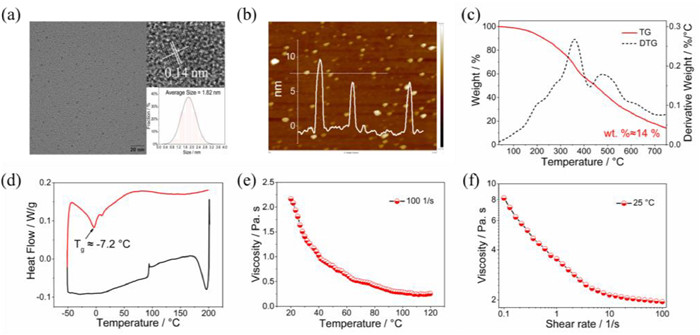
Thermogravimetric (TG) analysis was further conducted to confirm the polymer structure of RCPDs, as shown in Fig. 2c. Similar to some traditional polymers, RCPDs also have a one-step pyrolysis process, which indicates the presence of a large number of polymer chains in RCPDs. The derivative thermogravimetric (DTG) curves show the four-stage pyrolysis process of RCPDs, and the first pyrolysis at 200–300 ℃ is attributed to the functional groups in the outermost layer of the polymer cages/chains in RCPDs, such as carboxyl groups, amide bonds, amino groups, and hydroxyl groups. The second step (main part) of pyrolysis (350–400 ℃) primarily corresponds to the partial cleavage of the outer polymer chains of RCPDs. While the third step of pyrolysis around 500 ℃ reveals the depolymerization of the polymer cages of RCPDs and the breaking of the internal polymer chains. The final step of pyrolysis at ~620 ℃ refers to the pyrolysis of the closely-connected polymer structure on the surface of the carbon core, which is partly in trace amounts. The final carbon core residue is about 14%. TG/DTG analysis fully indicates the polymer structure of RCPDs [59,60]. In addition, the glass transition temperature (Tg) of RCPDs was measured by differential scanning calorimetry (DSC) to characterize its polymer properties. After cyclic curve calculation, the Tg of RCPDs is about -5 ℃, which is why RCPDs can only be freeze-dried into powder (Fig. 2d). It suggests that RCPDs in solid states can only be obtained by vacuum drying, while vacuum distillation or vacuum thermal drying generates RCPDs in viscous liquid states. To further determine the polymer properties of RCPDs in the viscous state, the viscosity of RCPDs was measured by a hybrid rheometer. As shown in Fig. 2e, the viscosity of RCPDs gradually decreased with increasing temperature. In addition, RCPDs exhibit obvious shear-thinning behavior at 25 ℃ (Fig. 2f). These results all indicate that RCPDs have obvious polymer properties.
Apart from its "core-shell" structure of RCPDs, their chemical composition is also crucial. The surface functional groups of RCPDs were characterized by Fourier transform infrared (FTIR) spectroscopy. As shown in Fig. S3 (Supporting information), the peak near 3400 cm−1 corresponds to the O—H vibration, and the peaks near 3200 cm−1, 1450 cm−1, and 750 cm−1 correspond to the N—H bond. The characteristic peak at 1600 cm−1 is attributed to the stretching vibration of the C=O bond. The peak at 1500 cm−1 is caused by the C=C vibration, and the characteristic peak near 1450 cm−1 is due to the vibration of the C—N bond. The characteristic peaks around 1390 cm−1 and 1270 cm−1 originate from the stretching vibration of the C-F bond. The peak at 1180 cm−1 can be assigned to the vibration of the C—O bond. In addition, X-ray photoelectron spectroscopy (XPS) was utilized to characterize the chemical composition of RCPDs, as shown in Fig. S4 (Supporting information). RCPDs contains C 1s (284.80 eV), N 1s (399.96 eV), O 1s (532.02 eV) and F (689.90 eV), and four elements whose contents are 68.83%, 11.22%, 19.46% and 0.49%, respectively. As shown in Fig. S5 (Supporting information), the high-resolution XPS spectrum of C 1s (Fig. S5a) shows six peaks, C—C/C=C (284.80 eV), C—N (285.45 eV), C—O (286.15 eV), C=N (287.56 eV), C=O (288.52 eV) and C-F (289.44 eV). As shown in Fig. S5b, the high-resolution spectrum of N 1s can be deconvoluted into three peaks at 399.46 eV, 400.54 eV, and 401.68 eV, which are attributed to pyrrolic N, pyridinic N and graphical N. The high-resolution spectrum of O 1s shows three peaks at 530.32 and 531.31 eV, assigned to O=C and O—C bonds, respectively (Fig. S5c). As shown in Fig. S5d, there is a peak in the high-resolution spectrum of F 1s at 689.95 eV, assigned as C-F bond.
The aqueous solutions of RCPDs (concentration: 0.1 mg/mL) is purple observed by the naked eyes (inset of Fig. 3a). As shown in Fig. 3a, the absorption spectrum of the aqueous solution of RCPDs almost covers the visible light region, with the main peak around 550 nm which may be due to the n→π* transition in the π system structure containing C—N/C=N or C—O/C=O. The PL emission peak at 620 nm (Fig. 3b) and the absolute quantum yield is as high as 44%. In addition, the representative two-photon spectra of RCPDs were shown in Fig. 3c. Under 850 nm laser excitation, both RCPDs in water exhibited red emission, which is similar to the steady-state spectral performance, indicating that one-photon and two-photon fluorescence have similar radiative recombination processes. The linear relationship between the two-photon emission intensity of RCPDs and the laser power confirms the nature of the two-photon excitation process (Fig. S6 in Supporting information).
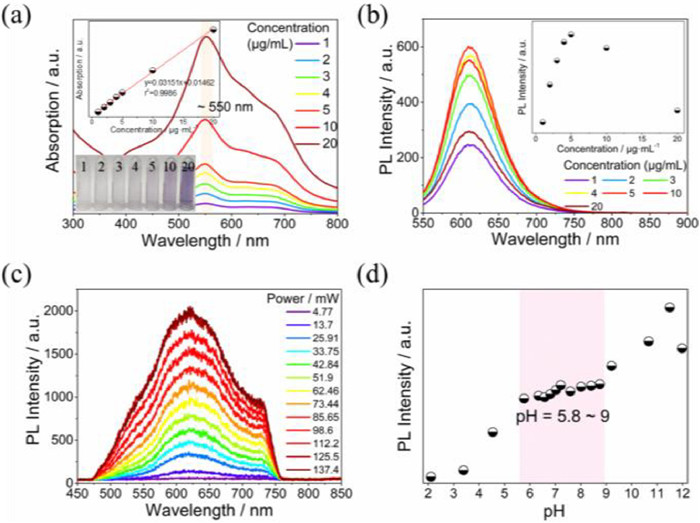
RCPDs with red/NIR emission and two-photon properties have great potential in applications of in vitro imaging and in vivo imaging. In the physiological environment, the PL properties, cytotoxicity and histotoxicity of RCPDs are the prerequisites for their application in vitro and in vivo. First, we investigated the PL efficacy of RCPDs as a function of ambient pH value. As shown in Fig. S7a (Supporting information), the absorption behavior of RCPDs in the BR buffer system tends to be consistent, and the absorption intensity changes slightly, but no new absorption peak appears, indicating that the structure of RCPDs maintains stable in this environment. Under acidic conditions, the PL of RCPDs is quenched to a certain extent, and this trend is positively correlated with acidity, while on the contrary the trend changes negatively under alkaline conditions (Fig. S7b in Supporting information). This may be caused by the protonation and deprotonation of RCPDs surface functional groups or molecules by H+ and OH−. When the functional group is combined with H+ or OH−, the surface molecules or functional groups undergo charge transfer, which affects the PL intensity of RCPDs [61,62]. In the range of pH 5.8~9, the PL intensity of RCPDs is relatively stable (Fig. 3d) and has no obvious red and blue shift (Fig. S7c in Supporting information), which lays the foundation for subsequent applications.
In order to explore the potential of RCPDs to target LNs through in vivo imaging, cytotoxicity, histotoxicity, and the possibility of in vitro imaging should be investigated.
Further, the toxicity of RCPDs has been evaluated in vitro. When RCPDs were co-incubated with HepG2, RAW264.7, HeLa, HEK293A and A549 for 24 h by 3-(4,5)-dimethylthiahiazo(-z-y1)-2,5-di-phenytetrazoliumromide (MTT) method [63,64], all five cells maintained high viability even at high concentrations up to 100 µg/mL (Fig. 4c), confirming that RCPDs have good biocompatibility and low cytotoxicity. Histological analysis data (Fig. S8 in Supporting information) indicate that there is no significant differences or histological abnormalities in the excised brains, hearts, lungs, livers, spleens and kidneys between the experimental and control groups at 24 h post-injection. Therefore, RCPDs are safe for bioimaging applications.
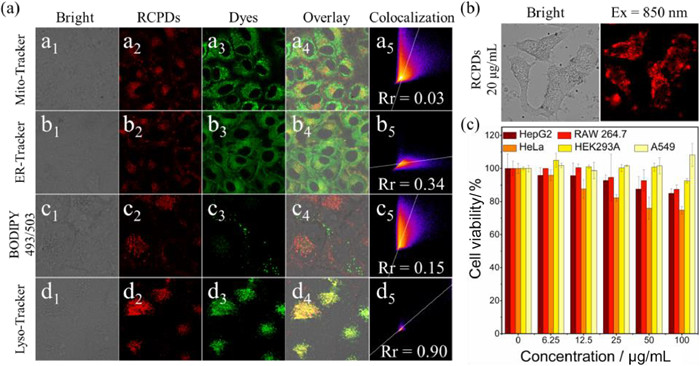
As shown in Fig. S9 (Supporting information), Fig. 4a (one-photon mode) and Fig. 4b (two-photon mode), red PL from HepG2 cells is clearly observed, indicating that RCPDs act as imaging reagents in one-photon and two-photon mode. Notably, cell imaging was successfully achieved by RCPDs at lower concentrations, which is inextricably linked to their excellent PL properties.
In addition, as shown in Fig. 4a, RCPDs were also found to be massively aggregated in the lysosomes of HepG2 cells, and their Pearson’s coefficient was as high as 0.90 by colocalization experiments, which was consistent with several other organelles significant differences (mitochondria: 0.03, endoplasmic reticulum: 0.34, and lipid droplets: 0.15), indicating that RCPDs have lysosome-targeting properties.
Next, the imaging performance of RCPDs in nude mice was evaluated with 660 nm emission under 580 nm excitation. After intravenous injection of RCPDs (dose: 30 mg/kg) in the tail vein, nude mice did not experience any acute toxic reactions. In vivo fluorescence images were collected at time points of 0.5, 1, 2, 6, 10, and 24 h (Fig. 5a and Fig. S10a in Supporting information). After injection, bright fluorescence can be clearly observed all over the body of nude mice at the time point of 0.5 h. After 24 h of RCPDs circulation, the fluorescence signal became very weak, indicating that RCPDs could be rapidly excreted from the nude mice after imaging. Urine was collected 1 h after injecting RCPDs with a syringe (Fig. S10b in Supporting information), which indicated that RCPDs could be excreted rapidly from the renal system. Fig. S10d (Supporting information) shows that the fluorescence signal in the small intestine region is also very obvious. Feces of nude mice treated with RCPDs showed a strong fluorescent signal at 6 h after injection (Fig. S6c). Therefore, RCPDs can be excreted in the form of feces through metabolism.
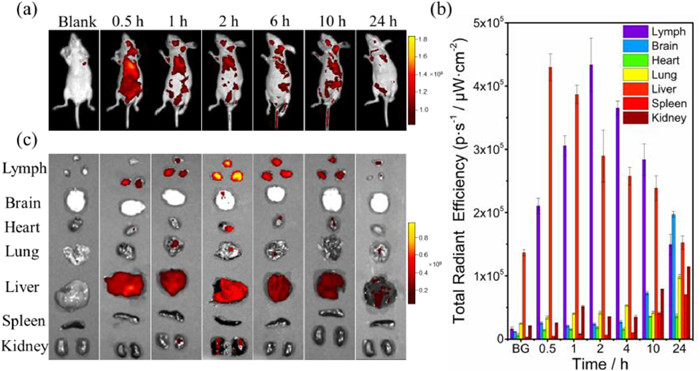
Different from most literatures [8,19-21,23], RCPDs have scattered fluorescence signals in the neck LNs, axillary LNs, and inguinal LNs when imaged in nude mice, which strongly aroused our curiosity (Fig. 5a). Therefore, at various time points after injection, we dissected nude mice, collected organs and performed fluorescence imaging, including LNs ((ⅰ) Neck LNs, (ⅱ) Armpit LNs, and (ⅲ) Groin LNs), brain, heart, lung, liver, spleen, and kidney (Fig. 5c). Fig. 5b showed that RCPDs were mainly accumulated in the liver and LNs, with negligible distribution in the brain, heart, lung, and spleen, and only a small amount of RCPDs was found in the liver and LNs after 24 h of circulation. It was also found that the fluorescence signal of RCPDs in LNs reached a peak at the 2 h time point (stronger than that of the liver at the same time point). This suggests that RCPDs have potential for LNs-targeting imaging. We speculate that the mechanism by which RCPDs enter the liver and LNs through the phagocytosis via macrophages and lymphocytes, followed by homing to the liver and LNs.
To further prove our hypothesis and to elucidate the mechanisms of RCPDs target LNs, we established a mouse model of systemic inflammation. Multi-organ inflammation was induced in mice by intravenous injection of lipopolysaccharide (LPS), which released more macrophages and lymphocytes than the control group. At this time, RCPDs were injected into the tail vein, as shown in Fig. 6b and Fig. S11 (Supporting information), and the experimental group showed a stronger fluorescence signal, indicating that the homing of lymphocytes is the possible mechanism of RCPDs target LNs.
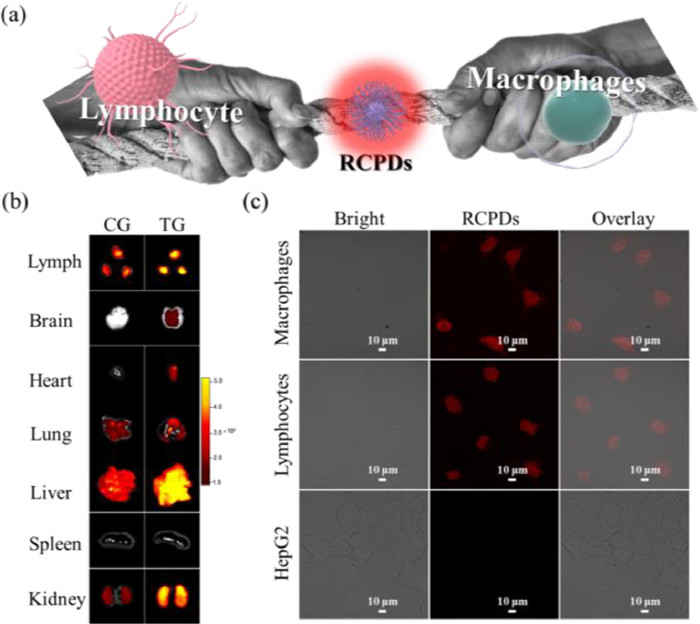
As previously described, cell imaging experiments were performed after RCPDs were incubated with HepG2 cells for 24 h. Preliminary experiments also showed that CPDs could not enter cells in a short period of time, such as 2 h, 6 h or 12 h. Moreover, we extracted macrophages and lymphocytes from mice in situ and incubated with RCPDs for 2 h in vitro. HepG2 cells were also incubated with RCPDs for 2 h as a comparison, as shown in Fig. 6c. The results show that fluorescence imaging can only be detected in macrophages and lymphocytes, while HepG2 cells have no fluorescence signal. This also supports the intrinsic mechanism of RCPDs targeting. To illustrate more visually the causes of fluorescent signal production in the liver and LNs, a cartoon diagram was used to show macrophages and lymphocytes competing for RCPDs (Fig. 6a). Until now, homing of lymphocyte is the preliminary conclusion of the intrinsic mechanism by which RCPDs target LNs.
In conclusion, RCPDs prepared by solvothermal method based on CA and BU have excellent red/NIR emission properties. Based on a series of characterizations, it is confirmed that RCPDs belongs to CPDs with a special core-shell structure. RCPDs enable one/two-photon imaging of cells and in vivo imaging. Our work not only provides a non-destructive and visual imaging reagent for LNs, but also broadens the biological applications of CPDs. More importantly, lymphocyte homing has been identified as a mechanism for RCPDs to target LNs at the cellular level. Meanwhile, the molecular mechanism of targeting LNs and the structure of RCPDs are in progress in our laboratory.
The authors declare that they have no known competing financial interests or personal relationships that could have appeared to influence the work reported in this paper.
This work was financially supported by National Natural Science Foundation of China (No. U21A20308), Sichuan Science and Technology Program (Nos. 21ZDYF3218, 2022ZYD0048), Talent Project of Sichuan Province, Sichuan Provincial College Student Innovation Training Program (Nos. S202010650073, S202210623049). We acknowledge Mrs. Yanhong Liu from the Comprehensive Training Platform of Specialized Laboratory, College of Chemistry, Sichuan University for the sample analysis. We acknowledge Dr. Yan Guan from Analytical Instrumentation Center, College of Chemistry and Molecular Engineering, Peking University for her kind assistance with confocal PL measurements.
Supplementary material associated with this article can be found, in the online version, at doi:
C. Xia, S. Zhu, T. Feng, M. Yang, B. Yang, Adv. Sci. 6 (2019) 1901316. doi: 10.1002/advs.201901316
Z. Mou, Q. Yang, J. Peng, et al., J. Colloid Interface Sci. 623 (2022) 762–774. doi: 10.1016/j.jcis.2022.05.095
S. Tao, C. Zhou, C. Kang, et al., Light Sci. Appl. 11 (2022) 56. doi: 10.1038/s41377-022-00745-4
Y. Zhao, C. Ou, J. Yu, et al., ACS Appl. Mater. Interfaces 13 (2021) 30098–30105. doi: 10.1021/acsami.1c07444
T. Han, Y. Wang, S. Ma, et al., Adv. Sci. 9 (2022) e2203474. doi: 10.1002/advs.202203474
F. Shan, J. Zhang, C. Liao, Z. Wang, L. Wang, Chin. Chem. Lett. 34 (2023) 108107. doi: 10.1016/j.cclet.2022.108107
X. Yang, X. Li, B.Y. Wang, Chin. Chem. Lett. 33 (2022) 613–625. doi: 10.1016/j.cclet.2021.08.077
Y.S. Liu, Y. Li, S. Koo, et al., Chem. Rev. 122 (2022) 209–268. doi: 10.1021/acs.chemrev.1c00553
B.Y. Wang, S.Y. Lu, Matter 5 (2022) 110–149. doi: 10.1016/j.matt.2021.10.016
L.M. Wang, B.Z. Wang, E.S. Liu, et al., Chin. Chem. Lett. 33 (2022) 4111–4115. doi: 10.1016/j.cclet.2022.01.042
Y. Wang, G. Guo, J. Gao, et al., Chem. Mater. 32 (2020) 8146–8157. doi: 10.1021/acs.chemmater.0c01391
F. Shan, L. Fu, X. Chen, et al., Chin. Chem. Lett. 33 (2022) 2942–2948. doi: 10.1016/j.cclet.2021.12.094
H. He, X.L. Chen, Z.Z. Feng, et al., Nano Lett. 21 (2021) 5689–5696 doi: 10.1021/acs.nanolett.1c01420
F. Shan, H. Xia, X. Xie, et al., Microchem. J. 167 (2021) 106273. doi: 10.1016/j.microc.2021.106273
S. E, C. He, J.H. Wang, Q. Mao, X. Chen, ACS Nano 15 (2021) 14465–14474. doi: 10.1021/acsnano.1c04001
S. Zhao, S. Wu, Q. Jia, et al., Chem. Eng. J. 388 (2020) 124212. doi: 10.1016/j.cej.2020.124212
Y. Sun, H. Qin, X. Geng, et al., ACS Appl. Mater. Interfaces 12 (2020) 31738–31744. doi: 10.1021/acsami.0c05005
C. She, Z.H. Wang, J. Zeng, F.G. Wu, Carbon 191 (2022) 636–645. doi: 10.1016/j.carbon.2022.02.005
D. Li, P. Jing, L. Sun, et al., Adv. Mater. 30 (2018) e1705913. doi: 10.1002/adma.201705913
L. Jiang, H. Ding, M. Xu, et al., Small 16 (2020) e2000680. doi: 10.1002/smll.202000680
J. Liu, Y. Geng, D. Li, et al., Adv. Mater. 32 (2020) e1906641. doi: 10.1002/adma.201906641
J. Hu, Y. Guo, X. Geng, et al., Chem. Eng. J. 446 (2022) 136928. doi: 10.1016/j.cej.2022.136928
H.Q. Zhang, G. Wang, Z.M. Zhang, et al., Light Sci. Appl. 11 (2022) 113. doi: 10.1038/s41377-022-00798-5
B.F. Fu, Q.L. Liu, M.H. Liu, et al., Chin. Chem. Lett. 33 (2022) 4577–4582. doi: 10.1016/j.cclet.2022.03.048
M. Jiao, Y. Wang, W. Wang, et al., Chem. Eng. J. 440 (2022) 135965. doi: 10.1016/j.cej.2022.135965
C. He, X. Lin, Y. Mei, et al., Front Chem. 10 (2022) 905475. doi: 10.3389/fchem.2022.905475
S. Karaman, M. Detmar, J. Clin. Investig. 124 (2014) 922–928. doi: 10.1172/JCI71606
S.A. Stacker, S.P. Williams, T. Karnezis, et al., Nat. Rev. Cancer 14 (2014) 159–172. doi: 10.1038/nrc3677
W. Van den Broeck, A. Derore, P. Simoens, J. Immunol. Methods 312 (2006) 12–19. doi: 10.1016/j.jim.2006.01.022
W. Wang, X. Zhou, Y. Bian, et al., Nat. Nanotechnol. 15 (2020) 406–416. doi: 10.1038/s41565-020-0648-y
X. Yu, Y. Dai, Y. Zhao, et al., Nat. Commun. 11 (2020) 1110. doi: 10.1038/s41467-020-14906-9
B.A. Mailey, G. Alrahawan, A. Brown, M. Yamamoto, A.H. Hassanein, Clin. Plast. Surg. 48 (2021) 607–616. doi: 10.1016/j.cps.2021.05.005
S. Ma, H. Liu, F.H. Ma, et al., World. J. Gastroenterol. 13 (2021) 161–173.
W.J. Tang, Z. Jin, Y.L. Zhang, et al., Front. Oncol. 10 (2021) 611571. doi: 10.3389/fonc.2020.611571
E.M. Sevick-Muraca, S. Kwon, J.C. Rasmussen, J. Clin. Investig. 124 (2014) 905–914. doi: 10.1172/JCI71612
C. Kim, H.M. Song, X. Cai, et al., J. Mater. Chem. 21 (2011) 2841–2844. doi: 10.1039/c0jm04194g
H.J. Lee, C.V. Barback, C.K. Hoh, et al., J. Nucl. Med. 58 (2017) 547–553. doi: 10.2967/jnumed.116.178582
J. Vonk, J.G. de Wit, F.J. Voskuil, et al., J. Nucl. Med. 63 (2022) 672–678.
A. Kamkaew, H. Sun, C.G. England, et al., Chem. Comm. 52 (2016) 6997–7000. doi: 10.1039/C6CC02764D
X. Sun, M. Shi, C. Zhang, et al., ACS. Appl. Nano. Mater. 4 (2021) 1029–1037. doi: 10.1021/acsanm.0c02542
S. Liu, X. Wang, X. Yu, et al., J. Am. Chem. Soc. 143 (2021) 21321–21330. doi: 10.1021/jacs.1c09822
G. Wang, W. Li, G. Shi, et al., Eur. J. Nucl. Med. Mol. Imaging 49 (2022) 2723–2734. doi: 10.1007/s00259-022-05834-5
L. Feng, C. Li, L. Liu, et al., Angew. Chem. Int. Ed. 61 (2022) e202212673. doi: 10.1002/anie.202212673
H. Shen, F. Sun, X. Zhu, et al., J. Am. Chem. Soc. 144 (2022) 15391–15402. doi: 10.1021/jacs.2c07443
M. Yin, J. Tong, F. Meng, et al., ACS Appl. Mater. Interfaces 14 (2022) 49471–49482. doi: 10.1021/acsami.2c11340
Y. Wang, Z. Li, G. Guo, Y. Xia, Anal. Chem. 95 (2022) 2765–2773.
J. Wu, J.H.P. Lei, B.C. He, et al., Aggregate 2 (2021) e139. doi: 10.1002/agt2.139
D. Li, P.T. Jing, L.H. Sun, et al., Adv. Mater. 30 (2018) 1705913. doi: 10.1002/adma.201705913
L. Cao, M. Zan, F. Chen, et al., Carbon 194 (2022) 42–51. doi: 10.1016/j.carbon.2022.03.058
P.L. Gao, Z.G. Xie, M. Zheng, Chin. Chem. Lett. 33 (2022) 1659–1672. doi: 10.1016/j.cclet.2021.09.085
H. Zhang, K. Li, L.L. Li, et al., Chin. Chem. Lett. 30 (2019) 1063–1066. doi: 10.1016/j.cclet.2019.03.017
H. Zhang, L. Shi, K. Li, et al., Angew. Chem. Int. Ed. 61 (2022) e202116439. doi: 10.1002/anie.202116439
B.W. Yao, H. Huang, Y. Liu, Z.H. Kang, Trends Chem. 1 (2019) 235–246. doi: 10.1016/j.trechm.2019.02.003
Z. Kang, S.T. Lee, Nanoscale 11 (2019) 19214–19224. doi: 10.1039/c9nr05647e
Y.L. Xu, B.Y. Wang, M.M. Zhang, et al., Adv. Mater. 34 (2022) 2200905. doi: 10.1002/adma.202200905
X. Zhao, S. Zhu, Y. Song, J. Zhang, B. Yang, RSC Adv. 5 (2015) 15187–15193. doi: 10.1039/C4RA13417F
S. Ramírez-Barroso, A. Jacobo-Martín, I. Navarro-Baena, et al., J. Mater. Chem. C 9 (2021) 16935–16944. doi: 10.1039/d1tc04255f
N. Javed, Z. Cheng, K. Zhu, et al., ACS Appl. Nano Mater. 5 (2022) 11741–11751. doi: 10.1021/acsanm.2c02759
H. Wu, W. Su, H.M. Xu, et al., View 2 (2021) 20200061. doi: 10.1002/VIW.20200061
J. Liu, T.Y. Kong, H.M. Xiong, Adv. Mater. 34 (2022) e2200152. doi: 10.1002/adma.202200152
H. Ding, X.H. Li, X.B. Chen, et al., J. Appl. Phys. 127 (2020) 231101. doi: 10.1063/1.5143819
D. Yue, T.L. Feng, B. Yang, Acta Polym. Sin. 52 (2021) 938–959. doi: 10.1007/s42243-021-00625-y
H. Qin, R. Zhao, Y. Qin, et al., Adv. Mater. 33 (2021) e2006007. doi: 10.1002/adma.202006007
C.Y. Kang, S.Y. Tao, F. Yang, B. Yang, Aggregate 3 (2022) e169. doi: 10.1002/agt2.169

Figure 2 The morphology and polymer structure of RCPDs. (a) TEM & HRTEM images, the corresponding dots diameter distribution histogram. (b) AFM image, inset: the height profile along the line in (b). (c) TGA (red curve) and DTG (black curve) thermograms of RCPDs with the heating rate of 10 ℃/min under N2 atmosphere. (d) DSC thermograms of RCPDs with the heating rate of 10 ℃/min under N2 atmosphere. (e) Effect of temperature on the viscosity for RCPDs in liquid state when shear rate is 100 s−1. (f) The interrelationship between viscosity and shear rate for RCPDs in viscous state at 25 ℃.

Figure 3 (a) Absorption spectra of aqueous solutions of RCPDs, inset: (top) linear fit of absorbance at 550 nm; (bottom) photograph in sunlight (increasing concentration from left to right). (b) PL emission spectra of RCPDs in aqueous solutions, Ex=550 nm. (c) Two-photon spectra of RCPDs in aqueous solutions with different laser powers of 850 nm femtosecond pulse laser. (d) The maximum PL intensity of RCPDs in BR buffer solution with different pH.

Figure 4 The bioimaging of RCPDs. (a) (a1–a5) Mitochondrial colocalization images of HepG2 cells stained with RCPDs and Mito-Tracker Green. (b1–b5) Endoplasmic reticulum colocalization images of HepG2 cells stained with RCPDs and ER-Tracker Green. (c1–c5) Lipid droplets colocalization images of HepG2 cells stained with RCPDs and BODIPY 493/503. (d1–d5) Lysosome colocalization images of HepG2 cells stained with RCPDs and Lyso-Tracker. (b) Two-photon cell imaging of RCPDs under the excitation wavelength of 850 nm. (c) Cell viability of HepG2, RAW 264.7, HeLa, HEK293A and A549 cells after incubation with various concentrations (0~100 µg/mL) of RCPDs for 24 h, respectively.

Figure 5 (a) In vivo imaging of supine nude mice with intravenous injection of RCPDs at different time points. (b) Real-time in vivo imaging of nude mice with intravenous injection of CPDs at different time points. (c) The biodistribution of CPDs after injection in nude mice at different time points, semiquantitative fluorescent intensity of lymph nodes, brain, heart, lung, liver, spleen and kidney in (b).

 扫一扫看文章

扫一扫关注我们
 DownLoad:

 下载:
下载:
