Figure 1.
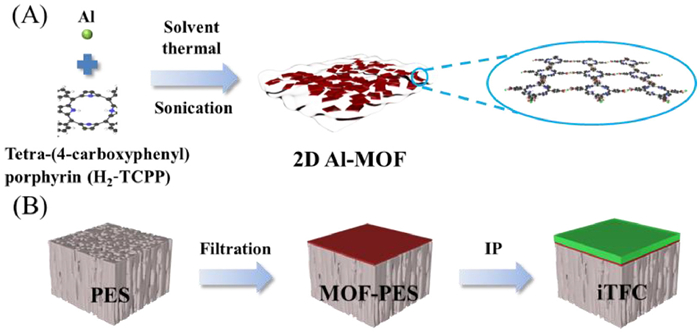
Schematic diagram of nanosheets synthesis and membrane fabrication. (A) Schematic illustration of Al-MOF nanosheets synthesis. (B) iTFC membrane fabrication with Al-MOF interlayer deposited by vacuum filtration.
Fabrication of novel thin-film composite membrane based on ultrathin metal-organic framework interlayer for enhancing forward osmosis performance
Hao Liu , Bo Li , Pin Zhao , Rongming Xu , Chuyang Y. Tang , Weilong Song , Zunaira Habib , Xinhua Wang

Membrane-based technology is promising to address the worldwide challenge of water scarcity [1-3]. Driven by an osmotic pressure difference, forward osmosis (FO) technology has the advantages of high water recovery and salt rejection, low energy consumption and great tolerance to membrane fouling [4]. These features make FO particular popularity in the challenging wastewater treatment with high fouling/scaling propensity [5-7]. However, its wide application is severely obstructed by the low permeability, in which the phenomenon of internal concentration polarization (ICP) is the pronounced limiting factor [8,9]. As the most commercial membrane, thin-film composite (TFC) membrane contains of a dense polyamide (PA) layer in situ generated on a porous substrate via an interfacial polymerization (IP) reaction [10,11]. Substrate controls the properties of PA layer, regulates the transport pathways of water and solutes, and has a decisive influence on ICP [12-14]. Many macro-porous different supports have been applied to prepare the FO membrane, including polyvinylidene fluoride [15,16], polyacrylonitrile [17], polyethersulfone (PES) [18,19] and polyethylene [20]. The interconnected macro-porous structure benefits to the diffusion of solutes, which would mitigate the adverse effect of ICP effect and then promote the water permeation. Unfortunately, the large surface pore of microporous substrate will also lead to the high potential intrusion of PA layer, and then increases the transmembrane resistance [21-23].
Recently, there have been many relevant works in the design of interlayered TFC (iTFC) membranes [24-26]. Various functional materials, including polydopamine [27], tannic acid-Fe3+ [20], graphene oxide [28,29], carbon nanotubes [17,30], MXene [18,31] and covalent organic frameworks [32,33] have been applied for iTFC-FO fabrication. The resultant novel iTFC membrane presented a dramatically improved water flux without sacrificing rejection or selectivity, breaking through the trade-off between productivity and efficiency [34,35]. Located between the substrate and selective layer, interlayer would regulate the surface properties of substrate optionally. The introduction of interlayer is considered to be a feasible method to modulate the reaction interface and maintain the well macro-porous structure of support. Among them, nanomaterials with two-dimensional (2D) structure reveal high potential for developing a uniform and continuous interlayer with a well-controlled thickness [36]. For instance, a novel MoS2 interlayered TFC membrane was fabricated with a precisely controlled interlayer thickness of 35.4 ± 4.41 nm [37]. The GO interlayer of about 10 nm provided a smooth and continuous interface for IP reaction [21]. Nevertheless, the tortuous transport path in the nanosheets interlayer with lamellar structures amplified the hydraulic resistance of iTFC [31,37]. Furthermore, the increased thickness of support layer, caused by the introduction of interlayer, would aggravate ICP in FO process [19]. Therefore, it is prominent to design the ultrathin and high-permeable intermediate layer.
The porous 2D nanosheets have been proven to achieve great permeability via more water transport paths [38,39]. As a porous nanosheet, the two-dimensional metal-organic frameworks (2D MOFs) present major improvements due to the good compatibility, uniform nanopores, and fast transport channel of water, which may facilitate the fast and selective transport of pure water while effectively reject the solutes [40-42]. As a porphyrinic MOF, aluminum tetra-(4-carboxyphenyl)porphyrin (Al-MOF) shows great potential in membrane separation fields, attributed to the high aqueous stability, high yield, gentle preparation method, and well-defined and two-dimensional nanosheet morphologies [40,43]. Although the 2D MOF has been used for iTFC membrane fabrication in the field of CO2 separation [44] and reverse osmosis (RO)/nanofiltration (NF) wastewater treatment [43,45], there are still few studies about ultrathin 2D MOF interlayered TFC-FO membrane. Moreover, the permeation performances in high-salinity environment and anti-fouling capacity are rarely studied.
In our study, a novel iTFC-FO membrane was well fabricated by incorporating a series of Al-MOF interlayers on PES macro-porous substrate, followed by the conventional IP. The influence of Al-MOF interlayer on the interface properties of IP reaction was systematically investigated based on the hydrophobicity, roughness, functional group, porosity and diffusion rate of monomer. Moreover, the membrane performance was thoroughly evaluated by pure water permeability, reverse sodium flux, anti-fouling capacity and permeation performance in high-salinity environment.
As depicted in Fig. 1, monolayer nanosheets of Al-MOF was prepared using a combined method of modified solvent-thermal and convenient exfoliation route based on Dr. Jian's work (Fig. 1A) [40]. The Al-MOF nanosheets were introduced onto PES support by vacuum filtration, and then Al-MOF nanosheets interlayered TFC FO membrane was fabricated via the conventional IP reaction (Fig. 1B). More details of IP process can refer to our previous works [39]. The transmission electron microscopy characterization (TEM, JEOL JEM-2100F, Japan) confirmed the nanosheet morphology of Al-MOF in Fig. S1A in Supporting information. According to the X-ray powder diffraction measurement (XRD, X'Pert PRO MPD, Nalytical, Netherlands), the sharp and strong characteristic peaks (Fig. S1B in Supporting information) matched well with the typical patterns [40]. As presented in Figs. S1C and D (Supporting information), the X-ray photoelectron spectroscopy (XPS, Thermo ESCALAB250Xi, USA) results confirm the presence of Al, C, N and O, with an atomic ratio of O/Al of approximately 15. Additional high-resolution XPS spectra of Al 2p, C 1s, N 1s and O 1s are shown in Figs. S1E-H (Supporting information). During the exfoliation process, the Al-O between neighbouring layers was broken and at the same time, O=C was attached on porphyrin ligand side and re-coordinated into HOOC. Thus, the carboxyl group signal at 532.8 eV in O 1s spectrum had a large area. All the above results confirm that Al-MOF nanosheets were synthesized successfully. Furthermore, to evaluate the dispersibility and stability of Al-MOF in water, the prepared Al-MOF was dispersed in water for more than one month. Results showed that the Al-MOF nanosheets maintained a good dispersibility and kept good crystallinity (Fig. S1B).
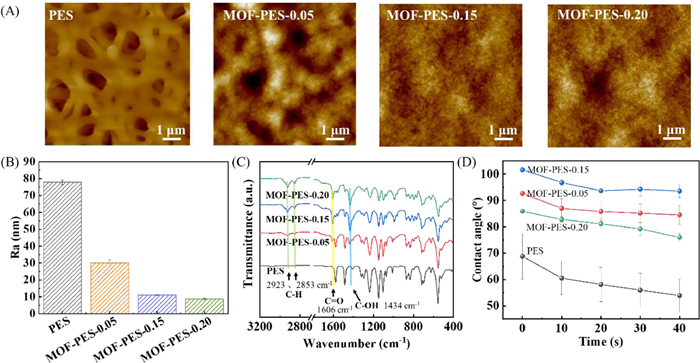
Based on the pre-determined standard curve (Fig. S2 in Supporting information), original Al-MOF nanosheets dispersion in ethanol was calibrated by a UV–vis spectrophotometer (Shimadzu UV-2401 PC) (the concentration of the dispersion is calculated by absorbance and standard curve), and diluted to 0.5 mg/L with deionized (DI) water for membrane preparation. Al-MOF nanosheets were loaded onto the PES support by a vacuum filtration of the diluted Al-MOF nanosheets aqueous suspension (0.5 mg/L). The loading of Al-MOF nanosheets interlayer (0, 0.05, 0.10, 0.15, 0.175 and 0.20 g/mm2) was controlled by varying the volume of the Al-MOF suspension to be filtered (0, 125, 250, 375, 440 and 500 mL). The resultant substrates were named as MOF-PES-x with x representing mass of loading Al-MOF (0, 0.05, 0.10, 0.15, 0.175 and 0.20 µg/mm2). MOF-PES with different Al-MOF loading amount showed different color variation, shifting from light brown to purple at increased loading (Fig. S3 in Supporting information). Moreover, in an apparent contrast to bare PES support, a top-view AFM image of MOF-PES with 0.15 g/mm2 and 0.20 g/mm2 loading exhibits a uniform coverage of Al-MOF nanosheets on the surface of PES support without apparent defects (Fig. 2A). The presence of Al-MOF decreased the surface roughness from Ra = 77.90 nm of bare PES to Ra = 30.05 nm of MOF-PES-0.05, Ra = 11.00 nm of MOF-PES-0.15, and Ra = 8.79 nm of MOF-PES-0.20 (Fig. 2B and Fig. S4A in Supporting information). As demonstrated by Fourier transform infrared spectra (FITR, Thermo Fisher Scientific, USA) results (Fig. 2C), the modified substrate had the characteristic C—H (2923 and 2853 cm−1), C=O (1606 cm−1) and C—OH (1434 cm−1) stretching vibration because of the coating of Al-MOF nanosheets. The introduction of Al-MOF interlayer had no major effects in the zeta potential of membrane surface (Fig. S5 in Supporting information), measured by Zetasizer (Anton Paar, Surpass 3, Austria). Furthermore, the loading of Al-MOF increased the contact angle from 68° of bare PES to 87°−100° of MOF-PES (Fig. 2D, Kruss DSA100, Germany). The reduced hydrophilicity of substrate would impede water absorption, resulting into the lower storage of aqueous amine solution (Fig. S6 in Supporting information) [18,25,43]. The modified surface characteristics of the substrate due to the Al-MOF interlayer could strongly affect the IP reaction and the separation performance of the resultant TFC-FO membranes.
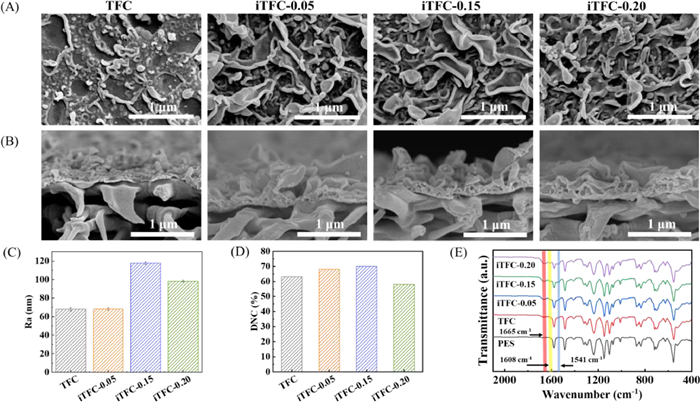
The prepared FO membranes with different Al-MOF nanosheets loading (0, 0.05, 0.10, 0.15, 0.175 and 0.20 µg/mm2) were named to be TFC, iTFC-0.05, iTFC-0.10, iTFC-0.15, iTFC-0.175 and iTFC-0.20. Both the surface (Fig. 3A and Fig. S7 in Supporting information) and cross-section SEM images (Fig. 3B and Fig. S8 in Supporting information) show that the PA layer of iTFC membranes had a characteristic ridge-and-valley structure with a thin base. During the IP process, m-phenylenediamine (MPD) of aqueous phase reacted with acyl chloride (trimesoyl chloride, TMC) of organic phase to form the PA active layer, in which the diffusivity rate of MPD to hexane phase in the reaction zone is vital to the properties of PA layer. The diffusivity of MPD from water to hexane phase was measured by monitoring the MPD concentration in hexane by UV–vis spectrophotometry with/without the Al-MOF interlayer in this work. As revealed in Fig. S6 (Supporting information), Al-MOF nanosheets interlayer decreased the uptake of MPD, and at the same time, slowed down the release rate of MPD from water-phase to organic-phase. The combined effects led to the formation of a thin PA base, which was supported by the TEM cross-sectional images (Fig. S9 in Supporting information). Moreover, the Al-MOF interlayer has a much smaller pore size (6 Å) than PES substrate, which would prevent polyamide from intruding into the substrate (Fig. S9) and thus minimizing the hydraulic resistance of the whole membrane [18,31]. Compared with TFC membrane, iTFC membranes had a more crumpled PA layer with much plumper leaves. Introducing the Al-MOF interlayer transformed nodular (with small nanovoids) into leaflike features (with large nanovoids) of the PA layer. The leaves became larger with the increase of Al-MOF loading from 0.05 µg/mm2 to 0.175 µg/mm2, but lessened with loading further increase from 0.175 µg/mm2 to 0.20 µg/mm2. AFM results (Fig. S4B in Supporting information and Fig. 3C) also depicted that iTFC-0.20 (Ra = 98.35 nm) was smoother than iTFC-0.15 (Ra = 117.67 nm), but rougher than TFC membrane (Ra = 71.17 nm). The surface roughness of PA layer increased at first and then decreased with the introduction of Al-MOF interlayer. The impeded heat dissipation/transfer by the dense interlayer would promote IP reaction. Moreover, the better gas confinement effect would enhance the role of interfacial degassed nanobubbles, promoting the growth of leaf-like structures [46,47]. However, the low uptake and release rate of MPD would reduce the strength of IP reaction. When the Al-MOF loading increased to 0.20 µg/mm2, the release rate of MPD became pretty low at the leading the leaves to shrink. The variation of PA surface roughness was controlled by the combined role of MPD availability and release rate, the impeded heat dissipation/transfer and gas confinement effect. Furthermore, the cross-linking degree (DNC) of PA layer (Fig. 3D) was obtained based on the O/N ratio detected from XPS spectra (Table S1 in Supporting information). TFC, iTFC-0.05, iTFC-0.15 and iTFC-0.20 had a DNC of 63%, 68%, 70% and 58%, respectively. The inclusion of Al-MOF layer increased at first and then decreased the cross-linking degree, which has the similar change trend with the surface roughness. It was also governed by the competing effects of reduced MPD availability (reducing crosslinking) and impeded heat/gas dissipations (promoting crosslinking) [48]. The measurement of zeta potential manifested that iTFC membrane was more negatively charged than TFC membrane (Fig. S5B in Supporting information). Characteristic peaks of amide bond at 1665, 1608 and 1541 cm−1 in FTIR spectra (Fig. 3E) indicated the same variation trends. Furthermore, the functional group of -NH in TCPP can reacted with the -COCl of TMC. The firm bonding between PA layer and Al-MOF interlayer would enhance the stability of interlayered membrane. All TFC membranes had a similar instantaneous contact angle at the range of 85°–95° (Fig. S10 in Supporting information).
The permeation and anti-fouling performance of membrane were evaluated using our bench-scale FO unit. More details are described in Fig. S11 (Supporting information), which are also available in some of our earlier publication [49]. The permeation performance of TFC membrane was investigated with 2 mol/L NaCl as draw solution (DS) and DI water as feed solution (FS) using a cross-flow setup. As demonstrated in Figs. 4A and B, the introduction of Al-MOF interlayer promoted the water permeation in both the AL-DS mode (active layer facing DS side) and AL-FS mode (active layer facing FS side). Moreover, compared with that of original TFC (9.52 L m−2 h−1 (LMH)), the water permeability firstly increased to 23.41 LMH (iTFC-0.15), and then decreased to 21.26 LMH (iTFC-0.20) in the AL-FS mode. While to the AL-DS mode, the water flux kept increasing with the loading of Al-MOF interlayer, from 10.89 LMH of TFC to 22.54 LMH of iTFC-0.15 and 25.92 LMH of iTFC-0.20, respectively. With 2 mol/L NaCl as DS and DI water as FS, the water flux of AL-FS mode was significantly influenced by the diluted ICP, while the effect of ICP was relatively milder in the AL-DS mode [50,51]. Therefore, the water permeation of AL-FS mode was controlled dominantly by both PA layer and the dilutive ICP in DS side, while that of AL-DS mode was determined mainly by the PA layer. Introduction of Al-MOF interlayer decreased the thickness of PA layer and increased the effective contact area, which would promote water permeation. While at the same time, interlayer increased the thickness of support layer and aggravated the ICP, which explained the lower FO water flux of iTFC-0.20 compared with iTFC-0.15 in the AL-FS mode.
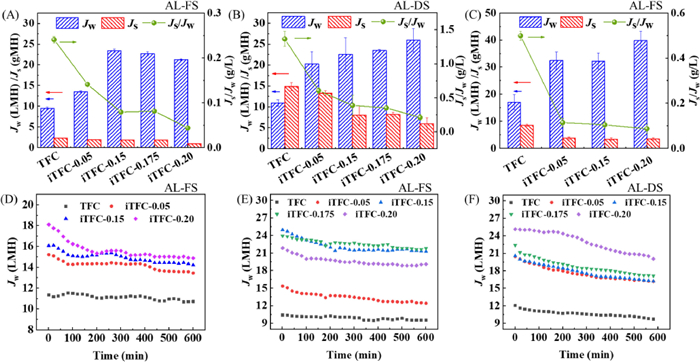
To investigate the separation performance of iTFC-FO membrane in high-salinity environment, the pure water flux and reverse salt flux of iTFC-FO membrane were measured using 4 mol/L NaCl as DS and 70 g/L NaCl solution (simulated salinity of RO concentrated seawater) as FS, which was described in Figs. 4C and D. The iTFC membrane has a more than twice water flux with pure water being FS than the control TFC membrane. While the advantage descended with the increase of FS salinity. When FS had the simulated salinity of RO concentrated seawater, the water flux of control TFC membrane was about 11 LMH, while that of iTFC membrane was just about 14–16 LMH. Furthermore, the water permeation of iTFC membrane was further evaluated via the fouling experiments using sodium alginate (SA) as the typical foulant. Results of water flux variation with time (Figs. 4E and F) determined that all the iTFC membranes performed stably and reliably even facing the high salinity and organic foulants. Compared with the original TFC membrane, iTFC membranes maintained the advantages in water permeation during the entire test duration (10 h). The rejection efficiency of TFC membrane was also evaluated in terms of reverse salt flux in both AL-FS and AL-DS mode. The introduction of Al-MOF interlayer decreased the reverse salt permeation from 2.58 g m−2 h−1 (gMH) of TFC to 1.86 gMH of iTFC-0.15 and 0.93 gMH of iTFC-0.20 in the AL-FS mode, while decreased from 14.83 gMH of TFC to 7.98 gMH of iTFC-0.15 and 5.94 gMH of iTFC-0.20 in the AL-DS mode. Generally, a more cross-linked PA layer has a smaller pore size and thereby is expected to achieve a higher rejection. However, in the current work, iTFC-0.20 had a reduced cross-linking yet higher selectivity. It is mainly attributed to the selective Al-MOF interlayer [40]. The Al-MOF layer not only acted as the interlayer to regulate the IP reaction, but also acted as a barrier which would improve the rejection of salt ions. To our best knowledge, it is the first report that the introduction of interlayer dramatically decreased RSF of TFC-FO membrane in the open literature. The separation performance of the FO membrane can be evaluated by the reciprocal of specific salt flux, i.e., reverse salt flux/water flux (Js/Jw), with a low value indicating better selectivity. As presented in Figs. 4A and B, the specific reverse salt flux decreased from 0.27 g/L of the original TFC membrane to 0.04 g/L of iTFC-0.20 in the AL-FS mode, while from 1.36 g/L to 0.23 g/L in the AL-DS mode with 2 mol/L NaCl as DS. Moreover, the iTFC membrane maintained high selectivity in the high-salinity environment (Fig. 4C). It determined that the introduction of Al-MOF interlayer would enhance the selectivity of TFC-FO membrane effectively. In the current study, the Al-MOF interlayer simultaneously increased water permeation and NaCl rejection. Table S2 (Supporting information) compares the performance of membrane fabricated in our work with the state-of-the-art FO membranes with an interlayer reported in previous literatures. The iTFC-0.15 membrane had an apparent advantage in terms of specific salt flux, especially to the PES substrate. Compared with conventional interlayer materials, the ultrathin porous Al-MOF nanosheet layer in this work enabled the iTFC membrane to achieve a dramatic increase in water permeance with a simultaneous enhancement of sodium rejection. The excellent performance of the Al-MOF interlayer-based iTFC resulted from combining the high separation efficiency of the thin selective PA layer with the high water-permeability and ion-rejection of the Al-MOF nanosheet layer. The thin PA layer with great surface roughness and high cross-linking degree made iTFC membrane with both high water permeation and high sodium rejection. Notably, after more than 2 weeks of storage in DI water, the prepared iTFC membrane still maintained stable performance in the experiment of more than 20 h, indicating the good stability.
In the work, a high-performance TFC membrane was prepared with the introduction of a porous Al-MOF nanosheets. Al-MOF interlayer provided IP reaction with a uniform and smooth substrate of small size pore, high porosity, and moderate surface hydrophilicity. Under the regulation of ultrathin Al-MOF interlayer, iTFC-0.15 membrane exhibited an ultrathin PA surface with plump leaf-like structures. The prepared iTFC-0.15 had both high water flux and sodium rejection, and presented an apparent advantage in the fouling and high-salinity environment. Our work provides a novelty avenue using ultrathin porous interlayer for the fabrication of TFC-FO membrane with high performance.
The authors declare that they have no known competing financial interests or personal relationships that could have appeared to influence the work reported in this paper.
This work was supported by the National Natural Science Foundation of China (Nos. 52100089 and 51978312), the Program to Cultivate Middle-aged and Young Science Leaders of Colleges and Universities of Jiangsu Province and Youth Fund of Basic Research Program of Jiangnan University (No. JUSRP121058).
Supplementary material associated with this article can be found, in the online version, at doi:
D.S. Sholl, R.P. Lively, Nature 532 (2016) 435–437. doi: 10.1038/532435a
M.M. Pendergast, E.M.V. Hoek, Energy Environ. Sci. 4 (2011) 1946–1971. doi: 10.1039/c0ee00541j
J.R. Werber, C.O. Osuji, M. Elimelech, Nat. Rev. Mater. 1 (2016) 16018. doi: 10.1038/natrevmats.2016.18
D.L. Shaffer, J.R. Werber, H. Jaramillo, et al., Desalination 356 (2015) 271–284. doi: 10.1016/j.desal.2014.10.031
T.S. Chung, S. Zhang, K.Y. Wang, et al., Desalination 287 (2012) 78–81. doi: 10.1016/j.desal.2010.12.019
A.J. Ansari, F.I. Hai, W.E. Price, et al., J. Membr. Sci. 529 (2017) 195–206. doi: 10.1016/j.memsci.2017.01.054
D. Roy, M. Rahni, P. Pierre, V. Yargeau, Chem. Eng. J. 287 (2016) 277–284. doi: 10.1016/j.cej.2015.11.012
J. Heikkinen, H. Kyllönen, E. Järvelä, et al., J. Membr. Sci. 528 (2017) 147–154. doi: 10.1016/j.memsci.2017.01.035
K. Lutchmiah, A.R. Verliefde, K. Roest, et al., Water Res. 58 (2014) 179–197. doi: 10.1016/j.watres.2014.03.045
R.M. DuChanois, C.J. Porter, C. Violet, et al., Adv. Mater. 33 (2021) 2101312. doi: 10.1002/adma.202101312
Z. Zhang, J. Hu, S. Liu, et al., Chin. Chem. Lett. 32 (2021) 2882–2886. doi: 10.1016/j.cclet.2021.03.028
L.E. Peng, Z. Yang, L. Long, et al., J. Membr. Sci. 641 (2022) 119871. doi: 10.1016/j.memsci.2021.119871
M. Kahrizi, R.R. Gonzales, L. Kong, et al., Desalination 528 (2022) 115615. doi: 10.1016/j.desal.2022.115615
S. Yang, J. Wang, Y. Wang, et al., Sep. Purif. Technol. 275 (2021) 119227. doi: 10.1016/j.seppur.2021.119227
X. Zhao, J. Li, C. Liu, Desalination 413 (2017) 176–183. doi: 10.1016/j.desal.2017.03.021
F. Yu, H. Shi, J. Shi, et al., J. Membr. Sci. 616 (2020) 118611. doi: 10.1016/j.memsci.2020.118611
Y. Yang, Y. Xu, Z. Liu, et al., J. Membr. Sci. 616 (2020) 118563. doi: 10.1016/j.memsci.2020.118563
P.F. Sun, Z. Yang, X. Song, et al., Environ. Sci. Technol. 55 (2021) 13219–13230.
Z. Zhou, Y. Hu, C. Boo, et al., Environ. Sci. Technol. Lett. 5 (2018) 243–248. doi: 10.1021/acs.estlett.8b00169
F. Xiao, H. Ge, Y. Wang, et al., J. Membr. Sci. 642 (2022) 119976. doi: 10.1016/j.memsci.2021.119976
G.S. Lai, W.J. Lau, P.S. Goh, et al., Chem. Eng. J. 344 (2018) 524–534. doi: 10.1016/j.cej.2018.03.116
X. Song, Z. Liu, D.D. Sun, Adv. Mater. 23 (2011) 3256–3260. doi: 10.1002/adma.201100510
Y. Wang, R. Ou, Q. Ge, et al., Desalination 330 (2013) 70–78. doi: 10.1016/j.desal.2013.09.028
S. Karan, Z. Jiang, A.G. Livingston, Science 348 (2015) 1347–1351. doi: 10.1126/science.aaa5058
Z. Yang, P.F. Sun, X. Li, et al., Environ. Sci. Technol. 54 (2020) 15563–15583. doi: 10.1021/acs.est.0c05377
Z. Yang, F. Wang, H. Guo, et al., Environ. Sci. Technol. 54 (2020) 11611–11621. doi: 10.1021/acs.est.0c03589
B. Li, X.X. Ke, Z.H. Yuan, et al., Desalination 534 (2022) 115781. doi: 10.1016/j.desal.2022.115781
X. Song, Y. Zhang, H.M. Abdel-Ghafar, et al., Chem. Eng. J. 412 (2021) 128607. doi: 10.1016/j.cej.2021.128607
L. Tian, Y. Jiang, S. Li, et al., Sep. Purif. Technol. 248 (2020) 117153. doi: 10.1016/j.seppur.2020.117153
M. Zhang, W. Jin, F. Yang, et al., Environ. Sci. Technol. 54 (2020) 7715–7724. doi: 10.1021/acs.est.0c02809
D. Xu, X. Zhu, X. Luo, et al., Environ. Sci. Technol. 55 (2021) 1270–1278. doi: 10.1021/acs.est.0c06835
Y. He, X. Lin, J. Chen, et al., J. Membr. Sci. 635 (2021) 119476. doi: 10.1016/j.memsci.2021.119476
T. Zhang, P. Li, S. Ding, et al., Sep. Purif. Technol. 270 (2021) 118802. doi: 10.1016/j.seppur.2021.118802
L. Long, C. Wu, Z. Yang, et al., Environ. Sci. Technol. 56 (2022) 2656–2664. doi: 10.1021/acs.est.1c07332
M. Xu, P. Zhao, C.Y. Tang, et al., Chin. Chem. Lett. 33 (2022) 3818–3822. doi: 10.1016/j.cclet.2021.11.071
X. Ai, Y.H. Li, Y.W. Li, et al., Chin. Chem. Lett. 33 (2022) 2832–2844. doi: 10.1016/j.cclet.2021.10.013
S. Cao, A. Deshmukh, L. Wang, et al., Environ. Sci. Technol. 56 (2022) 8807–8818. doi: 10.1021/acs.est.2c00551
Y. Li, W. Zhao, M. Weyland, et al., Environ. Sci. Technol. 53 (2019) 8314–8323. doi: 10.1021/acs.est.9b01914
Q. Zhou, P. Zhao, R. Xu, et al., J. Membr. Sci. 661 (2022) 120942. doi: 10.1016/j.memsci.2022.120942
M. Jian, R. Qiu, Y. Xia, et al., Sci. Adv. 6 (2020) eaay3998. doi: 10.1126/sciadv.aay3998
R. Xu, Q. Ji, P. Zhao, et al., J. Mater. Chem. A 8 (2020) 7870–7879. doi: 10.1039/C9TA13747E
J.R. Li, J. Sculley, H.C. Zhou, Chem. Rev. 112 (2012) 869–932. doi: 10.1021/cr200190s
Y. Wen, X. Zhang, X. Li, et al., ACS Appl. Nano Mater. 3 (2020) 9238–9248. doi: 10.1021/acsanm.0c01860
M. Liu, K. Xie, M.D. Nothling, et al., ACS Nano 12 (2018) 11591–11599. doi: 10.1021/acsnano.8b06811
P. Cheng, Y. Liu, X. Wang, et al., Desalination 544 (2022) 116134. doi: 10.1016/j.desal.2022.116134
R. Dai, J. Li, Z. Wang, Adv. Colloid Interface Sci. 282 (2020) 102204. doi: 10.1016/j.cis.2020.102204
X.H. Ma, Z.K. Yao, Z. Yang, et al., Environ. Sci. Technol. Lett. 5 (2018) 123– 130. doi: 10.1021/acs.estlett.8b00016
Y. Wen, R. Dai, X. Li, et al., Sci. Adv. 8 (2022) eabm4149. doi: 10.1126/sciadv.abm4149
Y. Hu, P. Zhao, H. Liu, et al., Chin. Chem. Lett. 34 (2023) 107931. doi: 10.1016/j.cclet.2022.107931
X. Wu, M. Ding, H. Xu, et al., ACS Nano 18 (2020) 9125–9135.
S. Zhao, L. Zou, C.Y. Tang, et al., J. Membr. Sci. 396 (2012) 1–21. doi: 10.1016/j.memsci.2011.12.023

Figure 1 Schematic diagram of nanosheets synthesis and membrane fabrication. (A) Schematic illustration of Al-MOF nanosheets synthesis. (B) iTFC membrane fabrication with Al-MOF interlayer deposited by vacuum filtration.

Figure 2 Chemical characterizations of PES and MOF-coated PES substrates with different Al-MOF loadings. (A) AFM images. (B) Roughness. (C) FITR spectra. (D) Contact angle.

Figure 3 Chemical characterizations of TFC and iTFC membranes with different Al-MOF loadings. (A) SEM surface images. (B) SEM cross-sectional images. (C) Roughness. (D) FTIR spectra. (E) The crosslinking degree of PA layer.

Figure 4 Membrane separation properties of TFC and iTFC membranes with different Al-MOF loadings. Pure water permeability and NaCl rejection in the (A) AL-FS and (B) AL-DS mode. Permeability experiment was conducted using 2 mol/L NaCl as DS and pure water as FS with an effective area of 7.07 cm2 at the cross-flow velocity of 0.06 L/min. Permeation performance in the AL-FS mode in high-salinity environment (C) with 4 mol/L NaCl as DS and DI water as FS, and (D) with 4 mol/L NaCl as DS and 70 g/L NaCl solution (simulated salinity of RO concentrated seawater) as FS. Variation of water flux of SA fouling experiment in the (E) AL-FS and (F) AL-DS mode. Fouling experiment was examined under the same condition with permeability experiment except that 200 ppm SA was selected to be FS.

 扫一扫看文章

扫一扫关注我们
 DownLoad:
 下载:
下载: