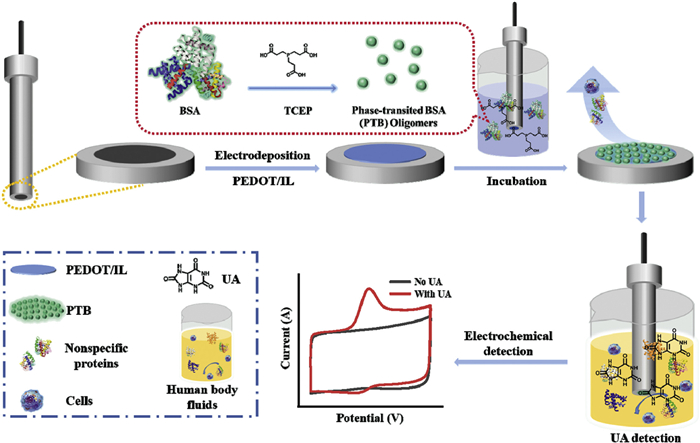
Scheme 1.
Stepwise construction of the UA sensor based on PTB.
Ultralow fouling electrochemical detection of uric acid directly in serum based on phase-transited bovine serum albumin and conducting polymer
Zhen Song , Rong Li , Xiqin Yang , Adriano Ambrosi , Xiliang Luo

Efficient sensing and antifouling capabilities are key requirements for the clinical application of electrochemical sensors in supporting the quantification of biomarkers. As we all know, biomarkers tend to be found in complex human body fluids, such as serum, blood and urine, which usually consist of many complex biomolecules [1]. In such circumstances, the electrochemical sensors were especially vulnerable to the contamination induced by coexisting complex biomolecules, thus leading to inaccurate electrical response and challenged sensitivity, which may strongly limit their practical application [2–4]. That is to say, for a surface of electrochemical sensor without antifouling properties, the sensor will eventually become unusable due to contamination, let alone long-term clinical applications. Therefore, the search for antifouling strategies has become a hot topic in current research and is of great practical significance for the development of electrochemical sensing.
Currently, several antifouling strategies have been utilized to maintain the sensing performance in complex media and were proved to be effective [5–7]. Because potential response is not associated with the specific surface area of the sensor, using potential signal instead of current signal as an output signal can effectively avoid the interference of protein adsorption [8], such as galvanic redox potentiometry [9]. Research on the engineering of surface topographies proves to be another way to construct antifouling interfaces [5,6,10]. For instance, by constructing the rational nanopore structure, the sensing interface can not only prevent the attachment of the nonspecific interferents, but also achieve the detection of target small molecules [11–13]. Additionally, integrating the antifouling materials into the sensing interfaces provided a promising method for alleviating the biofouling [5,14]. And many innovative antifouling electrochemical sensors have been exploited by incorporating antifouling materials, such as polyethylene glycol (PEG) [15–17], zwitterionic polymers [18,19], oligonucleotides [20,21], biological membranes [22], peptides and peptoids [3,23–26]. However, the immobilization of above materials usually requires complex structural design to introduce anchoring moieties and the construction procedures are not simple or cost-effective enough to implement on a mass basis.
The phase-transited bovine serum albumin (PTB), which is the product of amyloid-like aggregation of bovine serum albumin (BSA) with the reduction of disulfide bonds induced by tris(2-carboxyethyl) phosphine (TCEP), is considered as a new and effective antifouling material [27]. Combined with anchoring and antifouling capabilities, PTB as a kind of albuminous nanofilm could directly and firmly attach to any type of substrate without pretreatment and exhibited satisfying antifouling performance to broad-spectrum interferents [28]. The phase transition process of BSA is accompanied by rapid amyloid-like aggregation, forming PTB oligomers from native BSA. Experiments suggest that the PTB oligomers nanoparticles tend to assemble at the interface of two phases (e.g., gas/liquid and solid/liquid) forming two-dimensional nanofilm [27,28]. And the interface modification can be done by simply spraying or soaking.
Inspired by this, we report a simple antifouling electrochemical sensor capable of quantifying target in human fluids via utilizing PTB as antifouling coating, as displayed in Scheme 1. The PTB coating is responsible for protecting the sensing interface from interference by nonspecific proteins and is employed to improve the detection accuracy in complex fluids. Uric acid (UA) was chosen as a model target, since the concentration of UA in human body is closely associated with high blood pressure, gout, heart diseases and nephrolithiasis, and accurate quantification of UA has a significance meaning for early diagnosis of above diseases [29]. To gain the improved conductivity and catalytic properties of the sensing interface, the conducting polymer poly(3,4-ethylenedioxythiophene) (PEDOT) doped with 1-ethyl-3-methylimidazolium bis(trifluoromethylsulfonyl)imide (ionic liquid, IL) were firstly electrodeposited on bare electrodes. And PTB coating was then decorated on PEDOT-IL modified electrodes by soaking. In our work, the resulting PTB/PEDOT-IL interfaces take full advantage of PTB and PEDOT-IL coatings, including the excellent antifouling capabilities of PTB as well as good conductivity and catalytic properties provided by PEDOT-IL composites and eventually the accurate detection of uric acid in complex human fluids was realized. The experimental details are provided in Supporting information.
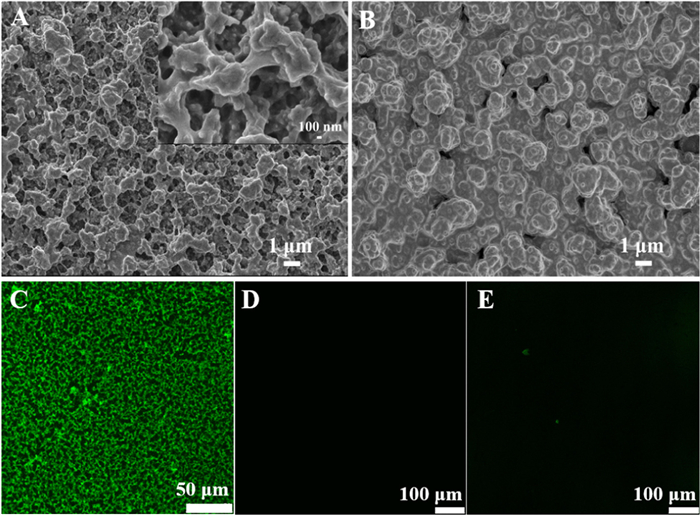
Firstly, scanning electron microscopy (SEM) was carried out to characterize the surface morphology of PEDOT-IL modified GCE. As depicted in Fig. 1A, the PEDOT-IL film presented a porous and dense network structure. Its large specific surface area provided abundant reactive sites for UA analysis. After incubation in PTB solution, the PEDOT-IL was covered with a relatively uniform film (Fig. 1B). And the confocal fluorescence spectra were chosen to characterize the formation of the PTB coating on PEDOT-IL modified electrode. ThT as a special fluorescent dye that binds to amyloid, was used to prove the successful formation of amyloid-like BSA (equal to PTB) [27,28]. As displayed in Fig. 1C, the fluorescence image of the PTB film after treated with ThT demonstrated obvious and uniformly distributed fluorescence, suggesting that the PTB was stably and uniformly coated on electrode. In contrast, no obvious fluorescence was detected on the PEDOT-IL and native BSA/PEDOT-IL modified electrodes (Figs. 1D and E), which were also stained with ThT. These results indicated that the appearance of the fluorescence is associated with the β-sheet structure of the PTB and also demonstrate the successful modification of PTB coating.
The chemical compositions of the PEDOT-IL and PTB/PEDOT-IL modified interfaces were evaluated by X-ray photoelectron spectroscopy (XPS). As depicted in Fig. 2A, the typical peaks of C 1s, O 1s, N 1s, S 2p and F 1s were monitored in both spectra of PEDOT-IL and PTB/PEDOT-IL modified interfaces, which were consistent with the elemental composition of the modified electrode as designed. What's more, the carbon: nitrogen (C/N) ratio decreased from 3.73 for PEDOT-IL modified interface to 2.88 for PTB/PEDOT-IL modified interface (Fig. S1 in Supporting information), ascribed to the immobilization of the nitrogen-rich PTB.
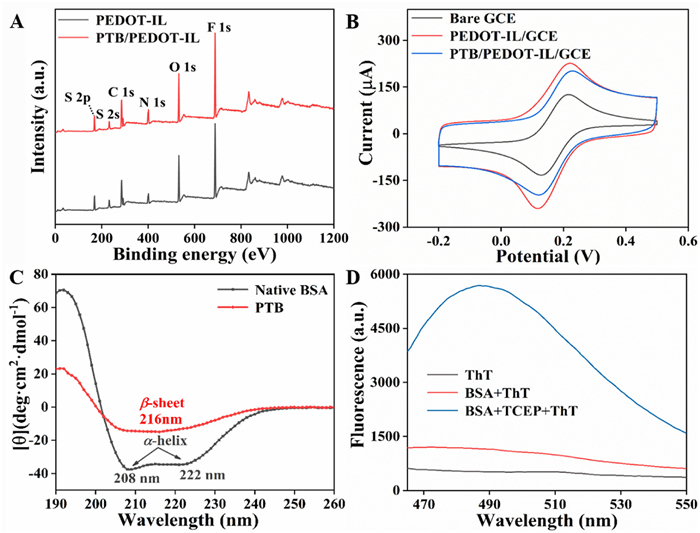
Electrochemical measurements were also used to confirm each modification step. As shown in Fig. 2B, the CV curves of different electrodes were compared. The bare GCE exhibited a lower current signal than PEDOT-IL interfaces, this was due to the large surface area and good conductivity of the conducting polymer modified surfaces, promoting the electron transfer between interface and electrolyte. After the further immobilization of the PTB, the current signal slightly decreased, owing to the insulating properties of the PTB coating. What's more, the accurate measurement of electrochemical active surface area is especially important for the study of catalytic performance. As shown in Fig. S2 (Supporting information), it was recorded with the Q-t measurement in 5.0 mmol/L solution of [Fe(CN)6]3−/4− containing 0.1 mol/L KCl and then was calculated according to Cottrell formula [30]. The electroactive surface area of the PEDOT-IL/GCE and PTB/PEDOT-IL/GCE were 0.880 cm2 and 0.700 cm2, respectively, while that of the bare GCE was 0.078 cm2.
The successful formation of the PTB was verified by CD and fluorescence spectroscopy. As shown in Fig. 2C (black curve), the CD spectrum of the native BSA displayed two obvious peaks at 208 and 222 nm, indicating the α-helix structure of the native BSA. After TCEP treatment, the two α-helix peaks were disappeared and a new peak at 216 nm associated to the β-sheet structure of proteins was appeared (Fig. 2C, red curve), indicating the successful phase transition of the native BSA to PTB. As ThT could show enhanced fluorescence at 484 nm after combined with β-sheet proteins [31], the fluorescence spectra of pure ThT, mixtures of ThT-BSA and ThT-PTB solutions were recorded in Fig. 2D. It was clearly observed that the mixture of ThT-PTB solution displayed distinct fluorescence signal. And as the reaction time was prolonged, the fluorescence intensity of the ThT-PTB was also increased (Fig. S3 in Supporting information). On the contrary, almost no fluorescence signals were observed in pure ThT and ThT-BSA solutions. The fluorescence experiment results further confirmed the successful phase transition of BSA. What's more, the zeta potentials of the BSA and PTB at pH 7.4 were shown in Fig. S4 (Supporting information). The BSA exhibited a strong negative charge, while PTB displayed a weak negative charge, which results were consistent with those of reported in references [27,28]. The weak negatively charged PTB with the uniform distribution of negatively and positively charged amino acid residues on the surface [4], was considered as a potential antifouling material [32].
The catalytic behavior of the developed electrochemical sensor towards UA was characterized by CV. As depicted in Fig. 3A, the CV curves of bare GCE, PEDOT-IL/GCE and PTB/PEDOT-IL/GCE were recorded in the absence and presence of 0.5 mmol/L UA. In the absence of UA, no obvious redox peaks were appeared at the three interfaces. While in the presence of UA, the bare GCE showed a weak oxidation peak at 0.284 V (orange curve), and the PEDOT-IL modified interface exhibited a strong oxidation peak at 0.240 V (blue curve), revealing an encouraging catalytic ability of PEDOT-IL towards UA. This is mainly due to the high specific surface area and excellent electron transfer capacity of the conducting polymer composite. After the immobilization of the PTB, the oxidation peak current is slightly decreased and the potential of the oxidation peak displayed a small positive shift (0.003 V), which ascribe to the poor conductivity of the PTB coating blocking the electron transfer kinetics of UA. The results recorded with i-t tests were consistent with above, as shown in Fig. 3B. Nonetheless, the PTB modified interfaces still demonstrated satisfying electrochemical catalytic reactivity to UA and can fulfill the measurement requirements for UA. And the peak current of the PTB/PEDOT-IL modified electrode towards UA revealed a linearly related to the square root of the scan rate, demonstrating that the redox process was controlled by diffusion [33], as displayed in Fig. S5 (Supporting information).
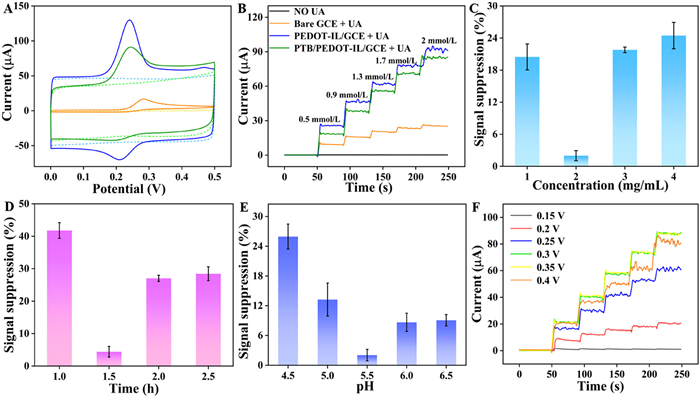
To obtain optimum antifouling capabilities and UA sensing performance, several important experimental parameters (the concentration of BSA, the reaction time of phase transition, the pH of TCEP solution and the applied potential) were optimized. After incubation in 20% human serum for 30 min, the UA sensor exhibited the lowest signal suppression (signal suppression = (I0 − I)/I0 × 100%, I0 and I represent the amperometric signal of the sensor towards UA obtained in PBS and human serum) and the best antifouling performance with the concentration of BSA at 2 mg/mL (Fig. 3C and Fig. S6 in Supporting information), reaction time of phase transition at 1.5 h (Fig. 3D and Fig. S7 in Supporting information) and reaction pH at 5.5 (Fig. 3E and Fig. S8 in Supporting information). In addition, the sensing performance of the antifouling electrochemical sensor towards UA was characterized through i-t test. The applied potential ranging from 0.15 V to 0.4 V was investigated, as displayed in Fig. 3F. The signal response reached its peak at 0.3 V, which was chosen as the optimal potential.
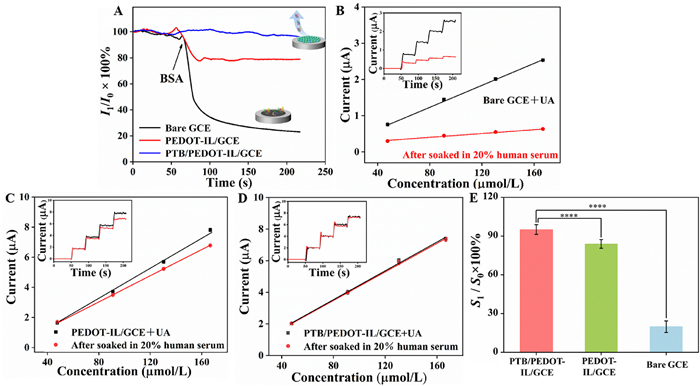
Reliable sensing performance in complex media is an important index to evaluate the quality of a sensor. Firstly, we chose the representative protein BSA as an interferent and assessed the sensing reliability of different electrodes toward UA by recording the response currents before and after the addition of BSA. As shown in Fig. 4A, after the addition of 5 mg/mL BSA, the current responses of the bare GCE and the PEDOT-IL/GCE toward UA decreased by about 73.47% and 20.74%, respectively. Whereas the current reduction of the PTB coated PEDOT-IL/GCE was only 2.69%, owing to the effective resistance of PTB coating to protein nonspecific adsorption. Meanwhile, the antifouling performance of the different modified electrodes were also investigated in human serum (Fig. S9 in Supporting information). The PTB coating modified electrode exhibited the superior antifouling performance than others. Encouragingly, the PTB/PEDOT-IL/GCE can almost retain the original current signal without interference (the signal suppression < 5%) after treatment with 20% human serum. In addition, the antifouling performance of different modified electrodes in BSA solution and complex human serum with longer immersion time were also investigated (Fig. S10 in Supporting information). As depicted in Figs. 4B–D, the UA sensing curves were recorded with UA successively added into the testing solution before and after immersion in 20% human serum. The bare GCE (Fig. 4B) and PEDOT-IL modified electrode (Fig. 4C) exhibited obvious current response change after the incubation in human serum, this may be due to the nonspecific protein or biomolecules adsorption on interfaces. In contrast, the PTB/PEDOT-IL modified electrode (Fig. 4D) showed almost unchanged current response to UA after the treatment with human serum, which ascribed to the good antifouling capability of the PTB coating. As displayed in Fig. 4E, the ratios of sensitivity (referred to the slope of the calibration curve) of the bare GCE, PEDOT-IL/GCE and PTB/PEDOT-IL/GCE before and after the incubation in human serum were 19.8%, 83.9% and 95.1%, respectively, further proving the antifouling and practical application ability of PTB coating in complex media.
The fluorescence microscopy was employed to monitor the protein adsorption of different modified electrodes (Fig. 5A). After incubation in FITC-BSA solution for 0–90 min, the strongest fluorescence signal was observed on the bare GCE (Fig. 5B), followed by PEDOT-IL modified electrode (Fig. 5C). Almost no obvious fluorescence signal was observed on the PTB/PEDOT-IL modified electrode (Fig. 5D). What's more, the cell adhesion test showed similar results (Fig. S11 in Supporting information), further determined the excellent antifouling performance of the PTB coating.

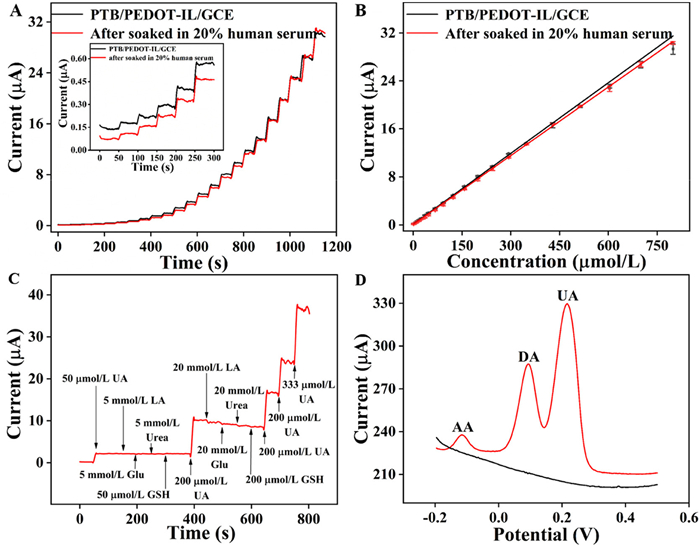
Under the optimal experimental conditions, the sensing performance of the constructed electrochemical sensor to UA was analyzed by i-t measurement with successive addition of UA. Fig. 6A showed the amperometric response to different concentrations of UA under magnetic stirring at room temperature. The UA sensor displayed a good linear range from 1.11 µmol/L to 798.90 µmol/L (R2 = 0.9994) with a high sensitivity of 0.556 µA µmol L−1 cm−2 (Fig. 6B). The limit of detection for UA was calculated to 0.40 µmol/L (S/N = 3), which is much better than that of previously reported UA sensors used in human serum (Table S1 in Supporting information). Afterwards, the sensing performance of the UA sensor was also recorded in 20% human serum under the same experimental conditions (Figs. 6A and B, red curve). The i-t response curve in 20% human serum was almost coincided with that in PBS, indicating an encouraging applicability in complex biological media.
In addition, practical application capability of the developed UA sensor was also investigated in 20% human serum samples. And the same samples were also determined with a commercial ELISA kit. As can be seen from Table 1, the analysis results by these two methods demonstrated good consistency with satisfactory average related error (3.26%), and the recoveries for UA were recorded in the range of 97.05%–101.17%. These results indicated that the developed UA sensor has excellent practical application ability in human serum and provides valuable reference for clinical diagnosis.
Other substances coexisted in human serum may interfere with the detection of target, resulting in poor detection accuracy. Hence, several substances were selected as interferents to test the selectivity of the UA sensor. As displayed in Fig. 6C and Fig. S12 (Supporting information), no obvious amperometric responses were detected, even the concentration of the interferents were 100 times higher than that of UA. And as shown in Fig. 6D, the ascorbic acid (AA), dopamine (DA) and UA can be well distinguished by difference of oxidation peak potential. Meanwhile, the selectivity of the developed UA sensor was also evaluated in complex media fetal bovine serum (FBS), as displayed in Fig. S13 (Supporting information).
In addition, the UA sensor exhibited excellent reproducibility in intra (inter)-electrode comparison tests, as displayed in Fig. S14 (Supporting information). And it displayed satisfactory stability after continuous CV measurement for 50 cycles (Fig. S15A in Supporting information) and i-t measurement for 60 min in 20% human serum (Fig. S15B in Supporting information). After 30 days of continuous monitoring, the rate of the signal response remained at a relatively steady level, as shown in Fig. S16 (Supporting information).
In summary, a low fouling electrochemical sensor based on PTB and conducting polymer composites for the detection of UA in human fluids was prepared. It is remarkable that PTB coating, amyloid-like aggregation of BSA, exhibited not only excellent antifouling capabilities to broad-spectrum nonspecific biomolecules but also strong adhesion and extensive applicability to electrode interfaces. Moreover, PTB coating could be easily synthesized by a simple one-step assembly in BSA solution containing TCEP without pretreatments. Though the modification of PTB on PEDOT-IL coating compromises the UA response of the sensor in an acceptable degree, the present of PTB endows the resistance of the UA sensor to biofouling. The experimental results demonstrated that the sensing performance of the prepared sensor for real samples analysis is comparable to that of ELISA method. This strategy of antifouling sensor construction with a balance between antifouling capability and sensitivity provides a good reference to the development of practical electrochemical sensors.
The serum samples from adult donors were provided from the Eighth People's Hospital of Qingdao (Qingdao, China), as well as the informed consent for use of the human serum was obtained. All sample preparations were approved by the Institutional Review Committee of relevant hospital and carried out in accordance with institutional guidelines and conformed to the relevant regulatory standards Ethical.
The authors declare that they have no known competing financial interests or personal relationships that could have appeared to influence the work reported in this paper.
This work was supported by the China Postdoctoral Science Foundation (No. 2022M711745), the Science and Technology Benefiting the People Project of Qingdao (No. 20-3-4-53-nsh), and the Taishan Scholar Program of Shandong Province of China (No. ts20110829).
Supplementary material associated with this article can be found, in the online version, at doi:
M. Chen, Z. Song, X. Yang, Z. Song, X.L. Luo, Biosens. Bioelectron. 206 (2022) 114162. doi: 10.1016/j.bios.2022.114162
T. Ederth, M. Lerm, B. Orihuela, D. Rittschof, Langmuir 35 (2019) 1818–1827. doi: 10.1021/acs.langmuir.8b01625
Z. Song, M. Chen, C.F. Ding, X.L. Luo, Anal. Chem. 92 (2020) 5795–5802. doi: 10.1021/acs.analchem.9b05299
S.F. Chen, Z.Q. Cao, S.Y. Jiang, Biomaterials 30 (2009) 5892–5896. doi: 10.1016/j.biomaterials.2009.07.001
C. Jiang, G.X. Wang, R. Hein, et al., Chem. Rev. 120 (2020) 3852–3889. doi: 10.1021/acs.chemrev.9b00739
P.H. Lin, B.R. Li, Analyst 145 (2020) 1110–1120. doi: 10.1039/C9AN02017A
J.Y. Lichtenberg, Y. Ling, S. Kim, Sensors 19 (2019) 2488. doi: 10.3390/s19112488
J. Kuhlmann, L.C. Dzugan, W.R. Heineman, Electroanalysis 24 (2012) 1732–1738. doi: 10.1002/elan.201200194
F. Wu, H.J. Cheng, H. Wei, et al., Anal. Chem. 90 (2018) 13021–13029. doi: 10.1021/acs.analchem.8b03854
I. Firkowska-Boden, X. Zhang, K.D. Jandt, Adv. Healthc. Mater. 7 (2018) 1700995. doi: 10.1002/adhm.201700995
L. Zhou, H.F. Hou, H. Wei, et al., Anal. Chem. 91 (2019) 3645–3651. doi: 10.1021/acs.analchem.8b05658
C.A.R. Chapman, H. Chen, M. Stamou, et al., ACS Appl. Mater. Interfaces 7 (2015) 7093–7100. doi: 10.1021/acsami.5b00410
Q. Sun, F. Yan, L. Yao, B. Su, Anal. Chem. 88 (2016) 8364–8368. doi: 10.1021/acs.analchem.6b02091
M.J. Russo, M. Han, P.E. Desroches, et al., ACS Sens. 6 (2021) 1482–1507. doi: 10.1021/acssensors.1c00390
Q. Chen, S. Yu, D.H. Zhang, et al., J. Am. Chem. Soc. 141 (2019) 16772–16780. doi: 10.1021/jacs.9b07105
N. Hui, X.T. Sun, S.Y. Niu, X.L. Luo, ACS Appl. Mater. Interfaces 9 (2017) 2914–2923. doi: 10.1021/acsami.6b11682
G. Emilsson, R.L. Schoch, L. Feuz, et al., ACS Appl. Mater. Interfaces 7 (2015) 7505–7515. doi: 10.1021/acsami.5b01590
T. Goda, Y. Miyahara, Langmuir 35 (2019) 1126–1133. doi: 10.1021/acs.langmuir.8b01492
T. Feng, W. Ji, Y. Zhang, et al., Angew. Chem. Int. Ed. 59 (2020) 23445–23449. doi: 10.1002/anie.202010675
C.S. Huertas, M. Soler, M.C. Estevez, L.M. Lechuga, Anal. Chem. 92 (2020) 12596–12604. doi: 10.1021/acs.analchem.0c02619
G.Y. Chen, W.Q. Chen, L.L. Xu, et al., Anal. Chem. 94 (2022) 5382–5391. doi: 10.1021/acs.analchem.2c00069
H. Wei, F. Wu, L. Li, et al., Anal. Chem. 92 (2020) 11374–11379. doi: 10.1021/acs.analchem.0c02240
Z. Song, Y.H. Ma, M. Chen, et al., Anal. Chem. 93 (2021) 5963–5971. doi: 10.1021/acs.analchem.1c00724
Z. Song, Y. Li, H. Teng, et al., Sens. Actuators B 305 (2020) 127329. doi: 10.1016/j.snb.2019.127329
H.O. Ham, S.H. Park, J.W. Kurutz, I.G. Szleifer, P.B. J. Am. Chem. Soc. 135 (2013) 13015–13022. doi: 10.1021/ja404681x
R. Han, Y. Li, M. Chen, et al., Anal. Chem. 94 (2022) 2204–2211. doi: 10.1021/acs.analchem.1c04787
J. Tian, Y. Liu, S. Miao, et al., Biomater. Sci. 8 (2020) 6903–6911. doi: 10.1039/D0BM00760A
X. Hu, J. Tian, C. Li, et al., Adv. Mater. 32 (2020) 2000128. doi: 10.1002/adma.202000128
R. El Ridi, H. Tallima, J. Adv. Res. 8 (2017) 487–493. doi: 10.1016/j.jare.2017.03.003
M. Csiszár, Á. Szűcs, M. Tölgyesi, et al., J. Electroanal. Chem. 497 (2001) 69–74. doi: 10.1016/S0022-0728(00)00453-8
S.S.S. Wang, K.N. Liu, B.W. Wang, Eur. Biophys. J. 39 (2010) 1229–1242. doi: 10.1007/s00249-010-0576-0
R.E. Holmlin, X. Chen, R.G. Chapman, S. Takayama, G.M. Whitesides, Langmuir 17 (2001) 2841–2850. doi: 10.1021/la0015258
A. Kutluay, M. Aslanoglu, Sens. Actuators B 185 (2013) 398–404. doi: 10.1016/j.snb.2013.05.025

Figure 1 SEM images of PEDOT-IL (A) and PTB/PEDOT-IL (B) modified GCE. The inset is partial enlargement of Fig. 1A. Fluorescence images of PTB /PEDOT-IL (C), PEDOT-IL (D) and BSA/PEDOT-IL (E) modified electrodes after ThT staining.

Figure 2 (A) XPS spectra of PEDOT-IL/GCE and PTB/PEDOT-IL/GCE. (B) CV curves of bare GCE, PEDOT-IL/GCE and PTB/PEDOT-IL/GCE. (C) CD spectra of native BSA and PTB solutions. (D) ThT fluorescence spectra of the ThT, native BSA, and PTB (BSA + TCEP).

Figure 3 (A) CV curves obtained at the different modified electrodes (orange: bare GCE, blue: PEDOT-IL/GCE and green: PTB/PEDOT-IL/GCE) in the presence (solid line) and absence (dashed line) of 0.5 mmol/L UA. (B) Amperometric responses of the different modified electrodes to UA. Amperometric signal suppression of the PTB/PEDOT-IL sensor for UA in 20% human serum at different concentration of BSA (C), reaction time of phase transition (D) and pH of TCEP solution (E). (F) Amperometric responses of the PTB/PEDOT-IL/GCE towards 0.5 mmol/L UA under different applied potentials.

Figure 4 (A) The amperometric responses of bare GCE, PEDOT-IL/GCE and PTB/PEDOT-IL/GCE in PBS containing 0.5 mmol/L UA upon the addition of 5 mg/mL BSA. Calibration curves of bare GCE (B), PEDOT-IL/GCE (C) and PTB/PEDOT-IL/GCE (D) recorded in PBS and 20% human serum, inset shows the amperometric responses of corresponding electrodes towards 0.5 mmol/L UA. (E) Ratios of the sensitivity in 20% human serum to those in PBS; n = 3. The asterisks (****) indicate significant differences, P < 0.0001, one-way ANOVA.

Figure 5 (A) The bare or modified surfaces were incubated in FITC-BSA for 0–90 min and then examined by fluorescence microscopy. Fluorescence images showed the adsorption of FITC-BSA on the bare GCE (B), PEDOT-IL/GCE (C) and PTB/PEDOT-IL/GCE (D) (scale bar: 250 µm).

Figure 6 (A) Amperometric responses of the PTB/PEDOT-IL/GCE to a range of concentrations of UA in stirring PBS (black curve) and 20% human serum (red curve) at the optimal potential. Inset are the enlarged curves. (B) The linear calibration curve of the UA sensor in PBS (black curve) and 20% human serum (red curve). (C) Amperometric responses of the PTB/PEDOT-IL/GCE towards UA, lactic acid (LA), urea, glucose (Glu) and glutathione (GSH). (D) DPV responses of the PTB/PEDOT-IL/GCE in PBS with (red curve) and without (black curve) 0.56 mmol/L AA, DA and UA.

 扫一扫看文章

扫一扫关注我们
 DownLoad:


 下载:
下载: