Received Date:
20 October 2022 Accepted Date:
26 January 2023 Revised Date:
19 January 2023 Available Online:
15 September 2023
Abstract:
Glycolysis inhibition can effectively block the energy supply and interrupt tumorigenesis in many types of cancers. However, when glycolysis is inhibited, tumor cells will break down glutamine as the raw material for the replenishment pathway to maintain the tricarboxylic acid cycle ensuring energy supply, therefore inducing ineffective interruption of metabolic. Herein, we designed glutamine transporter antagonist l-γ-glutamyl-p-nitroanilide (GPNA) loaded and 4T1 cancer cell membrane coated iridium oxide nanoparticles (IrO2-GPNA@CCM) to realize a comprehensive inhibition of tumor energy supply which synergistically mediated by glycolysis and glutamine cycle. IrO2 NPs were used to catalyze the O2 generation by facilitating the decomposition of endogenous H2O2 in tumor cells, which further downregulated the expression of HIF-1α and PI3K/pAKT to interrupt the generation of lactate. Meanwhile, the loaded GPNA was released under NIR irradiation to bind to alanine-serine-cysteine transporter (ASCT2) for glutamine uptake suppression, therefore realizing the comprehensive dysfunction of cell metabolism. Moreover, both in vitro and in vivo results convinced the thorough energy inhibition effect based on IrO2-GPNA@CCM NPs, which provided an inspiring strategy for future construction of tumor therapeutic regimen.
In the past several years, advanced progress has been made in cancer cell metabolism regulation to largely promote the developments of cancer therapy, which is recognized as a promising therapeutic strategy. As an emerging approach, this therapy method focuses on characteristic metabolic pathways of cancer cells, such as aerobic respiration, glycolysis [1]. In general, cancer cells survival is enhanced through several metabolic switches, in which one of the remarkable features is that they preferentially switch to aerobic glycolysis rather than oxidative phosphorylation as their ways of glucose metabolism [2]. According to Warburg's theory, cancer cells take up large amounts of glucose through upregulated glucose transporter-1 (GLUT1) and metabolize them into lactic acid, even in the aerobic conditions. In the process of aerobic glycolysis, lactate as the end-product of glycolysis is exported and accumulated into the extracellular space [3], therefore fueling oxidative phosphorylation in normoxic cancer cells. Thus, reducing glucose intake and blocking the intermediate process of glycolysis, also known as starvation therapies, are considered as effective treatment strategies.
Among multitudinous starvation therapies, catalase connected together with glucose oxidase (GOx) was often constructed to realize a cascade enzymatic reaction [4], which has achieved remarkable effect since the catalase expression was closely associated with the endogenous H2O2 as well as metastasis and proliferation of cancer. Nanoenzymes as emerging and promising nanotheranostic agents, have gained increasing interest due to their good biocompatibility and similar functions of natural enzymes [5,6]. The past few years had witnessed the rapid development of nano-enzyme including Fe3O4 [7], Co3O4 [8] and uPh [9] etc. Among them, iridium (Ir) attracted our interest not only due to the high oxygen evolution reaction (OER) activity stability [10-12] and detecting sensitivity over a wide pH range, but also the intrinsic high atom number which offered a possibility to serve as a contrast agent for CT [13]. As for IrO2, it is less susceptible to temperature and pH environment which is therapeutically applicable to act as the CAT and capable of potentiating tumor‐starvation therapy. Generally, endogenous H2O2 undergoes decomposition catalyzed by catalase activity which will down-regulate the expression of HIF-1α [14], thus promoting glycolysis via upregulation of GLUT1 and further suppressing the progress of tumorigenesis [15]. In addition, it has been reported that iridium(Ⅲ) complex induces the changes of PI3K/AKT pathway proteins which are closely related to glycolysis exhibiting high anticancer activity [16].
However, tumor cells will seek to replenishment pathway which is realized by decomposing of glutamine after glycolysis inhibition [17]. Recently, research interests, beyond glucose and Warburg effect, have broadened to other nutrients including glutamine due to the resurgence of study in cancer metabolism. In tumor cells, a high glutamine consumption has been observed to elevate lipid biosynthesis rates [18]. Glutamine as an essential nutrient as well as carbon source in amino acid/fatty acid synthesis and nitrogen source for de novo purine/pyrimidine biosynthesis plays a key role and contributes directly in cell growth and division [19]. In fact, compared with glucose, tumor cells may prefer to internalize more glutamine due to the oncogenic alterations in the metabolism. The highest glutamine uptake occurs in some types of glutamine (Gln)-dependent cancer cells [20], such as liver cancer [21], lung cancer [22], breast cancer [23], colon cancer [24] and the human glioma [25], which indicates that it is insufficient for the regulation of single pathway to interrupt the metabolic flux or tumor cells. Specifically, ASCT2 (the alanine‑serine-cysteine transporter, type-2), a sodium-dependent solute carrier protein [26] responsible for net uptake of glutamine, is the primary gatekeeper of glutamine in cancer cells which also plays an important role in carcinogenesis. There is a broad substrate selectivity for ASCT2 which includes a high-affinity (Km∽20 µmol/L) for small neutral amino acids including glutamine [27]. The expression pattern of ASCT2 is almost identical upregulated three-fold in a variety of cancerous tissues. Besides, the expression of glutamine transporter ASCT2 is also triggered by lactate-induced c-Myc activation, resulting in improved glutamine uptake. Among compounds synthesized N-aryl glutamine analogues (a type of ASCT2 inhibitor), the first-generation glutamine transport antagonist l-γ-glutamyl-p-nitroanilide (GPNA) exhibits the most potent blocking effect on glutamine uptake [28] and inhibits growth in SLC1A5-high expressing cells in a time- and dose-dependent manner [20] which is widely used to suppress the uptake of glutamine [21,29,30].
The aggregation of drugs at tumor sites ensures effective therapeutic results. However, during the use of nanoparticle-based drugs, it is mainly attributed to the enhanced permeability and retention (EPR) effect, which is often limited, and active targeting endows new functions to nanomedicine [31]. Zheng and Ding developed calcium ion nanomodulators, which can be used for mitochondria-targeted multimodal cancer therapy. This approach of targeting subcellular organelles can effectively enhance drug aggregation at the tumor site, thereby enhancing tumor therapy [32]. Besides, researchers have developed membrane-engineered nanoplatforms which can be employed as nanocarriers with various functions. As a promising method, cancer cell membrane encapsulation technology easily enhanced targeting based on the expression of intrinsic membrane proteins and saccharides [33]. It was worth noting that simple methods such as ultrasound, stirring and extrusion can be used to prepare the membrane-encapsulated vectors [34], thus inspiring us to develop nanoparticles with a cancer membrane modifying strategy.
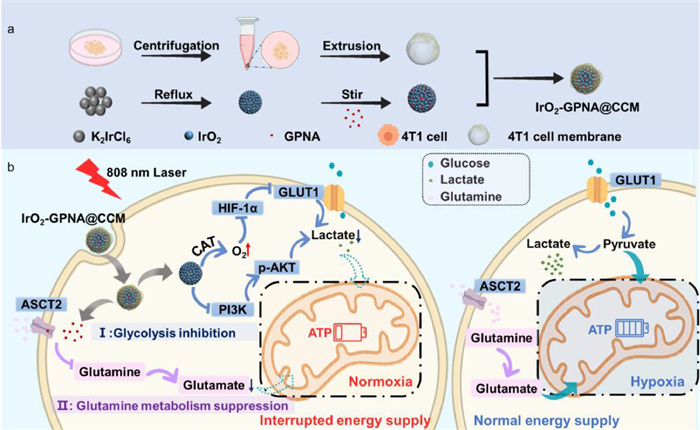
Herein, we designed a mimic nanosystem (Scheme 1) by employing iridium dioxide nanoparticles as the core with coated 4T1 cancer cell membrane and loaded GPNA (IrO2-GPNA@CCM). After been endocytosed due to the homologous targeting ability by cancer cell membrane, iridium dioxide nanospheres with catalase-like activity catalyzed the decomposition of high content of H2O2 in cancer to O2, which destabilized HIF-1α induced by hypoxia and lactic acid. On one hand, the generation of O2 and destabilization of HIF-1α induced by IrO2 would influence the expression of GLUT1, which would further affect the generation of lactate due to the reduced glucose internalization. At the same time, the inhibition of PI3K/pAKT pathway directly hindered glycolysis to induce the reduced lactate level. On the other hand, IrO2 NPs with excellent photothermal efficiency could facilitate GPNA release under near-infrared light (NIR) irradiation to react with ASCT2, thus hampering the glutamine uptake to suppress the generation of glutamate. Consequently, this nanoplatform disrupted both glucose and glutamine catabolism, which would synergistically interrupt glycolysis and glutaminolysis, thereby comprehensively impairing energy supply to prevent tumorigenesis.
Scheme 1
Scheme 1.
Schematic illustration for the mechanism of comprehensive energy inhibition. (a) Schematic illustration of the preparation of IrO2-GPNA@CCM. CCM (cancer cell membrane), GPNA (l-γ-glutamyl-p-nitroanilide). (b) The mechanism of IrO2-GPNA@CCM mediated photo-thermal therapy to trigger potentiate energy blockade therapies for anti-tumors.
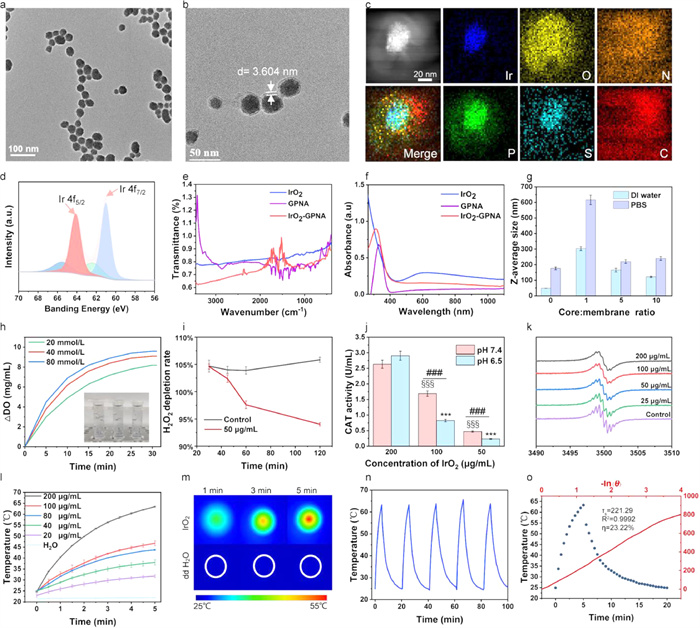
The IrO2 NPs were synthesized according to the previous method through one-step thermal hydrolysis of K2IrCl6 under alkalescent conditions, in which a series of color changes were observed (Fig. S1 in Supporting information). As shown in Fig. 1a and Fig. S2a (Supporting information), IrO2 NPs exhibited a uniform sphere-like structure with an average diameter of ~30 nm. Such spheric morphology was seldom influenced by the encapsulation of cancer cell membrane (Fig. 1b). Additionally, we observed crystallographic properties of IrO2 with clear lattice and diffraction patterns in high-resolution TEM images (Fig. S2c in Supporting information) and selected-area electron diffraction (SAED) patterns (Fig. S2d in Supporting information), respectively, suggesting the successful preparation of IrO2. The size changed slightly after 5 days of incubation in fetal bovine serum (FBS), which was still lower than 52 nm (Fig. S2e in Supporting information), while zeta potential (Fig. S2f in Supporting information) had a neglectable fluctuation preserved in dulbecco's modified eagle medium (DMEM) and FBS, verifying the good stability of IrO2in vitro. In addition, the valence states of IrO2 were further confirmed by the X-ray photoelectron spectroscopy (XPS) spectrum (Fig. 1d). In the case of Ir 4f spectrum, the binding energy peaks at 64.1 eV and 61 eV were ascribed to the characteristic Ir 4f5/2 and 4f7/2 signals, respectively. The successful fabrication of GPNA loaded IrO2 NPs was illustrated in the FT-IR spectrum from 400 cm−1 to 4000 cm−1 (Fig. 1e). The characteristic absorption peaks of the benzene rings could be observed after the modification of GPNA in the FT-IR spectrum, in which 1018.4 cm, 894.96 cm and 879 cm could be assigned to O—O stretching vibration and O-Ir-O asymmetrical stretching vibration, respectively. Next, UV–vis spectrum was used to further validate the loading of GPNA, we could observed the apparent absorption peak of IrO2-GPNA@CCM (350 nm) compared with the pure IrO2 (588 nm), indicating the successful loading of GPNA (Fig. 1f).
Figure 1
Figure 1.
Characterizations of IrO2-GPNA@CCM. (a) TEM image of IrO2 NPs and (b) IrO2 NPs coated with 4T1 cancer cell membrane. (c) HAADF-STEM image and EDX elemental mapping. (d) XPS spectra of IrO2 nanoparticle. (e) FT-IR spectra of IrO2, GPNA and IrO2-GPNA. (f) UV–vis absorption spectrum measured at 250–800 nm of IrO2 NPs, GPNA and IrO2-GPNA. (g) Average hydrate particle size of IrO2 @CCM with different mass ratio. (h) pH-dependent H2O2-triggered O2 generation by IrO2 NPs in PBS (DO: dissolved oxygen), IrO2 (200 µg/mL). (i) H2O2 consumption within 2 h. (j) CAT activity of IrO2 at different concentration. ***P < 0.001, test group vs. 200 µg/mL group (pH 6.5); §§§P < 0.001, test group vs. 200 µg/mL group (pH 7.4); ###P < 0.001, pH 6.5 vs. pH 7.4 group. (k) ESR spectra of CAT with different conditions. (l) Thermal images of IrO2 aqueous dispersion and water treated with 808 nm NIR laser irradiation for 5 min. (m) The photothermal profiles of aqueous dispersions of IrO2 with different concentrations under 808 nm laser irradiation with a power density of 1.5 W/cm2. (n) Temperature elevation curves of IrO2 (200 µg/mL) over five cycles of 808 nm NIR laser on/off irradiation. (o) Photothermal effect of IrO2 under 808 nm laser (1.5 W/cm2). The irradiation lasted for 300 s; Plot of cooling time versus negative natural logarithm of the driving force temperature obtained from a cooling stage to calculate time constant (Ts) for heat transfer.
Subsequently, the crushed 4T1 cells were extruded from polycarbonate filters to form uniform membranes for further encapsulation. The synthesized iridium dioxide showed a negative potential of –43.4 mV (Fig. S2j in Supporting information), which was favorable for cell membrane coating. Under ultrasound reaction, the broken cell membrane could spontaneously form vesicles and encapsulate the IrO2 NPs to form IrO2-GPNA@CCM with a boundary thickness of 3.604 nm and zeta potential of −25.3 mV. Meanwhile, the results of dynamic light scattering (DLS) analysis displayed that the hydrated size of IrO2 underwent a volume phase transition from 78 ± 4.1 nm to 137 ± 2.7 nm at 25 ℃ due to the encapsulation of cancer cell membrane (Fig. S2k in Supporting information), and the average size increased to 138 nm. To further explore the encapsulation of CCM, energy dispersive spectroscopy (EDS) was conducted for elemental detection and identification (Fig. S2g in Supporting information). According to the results (Fig. 1c), the presence of membrane characteristic elements N and P could also be observed in addition to Ir and O. The synthesis of cell-membrane-coated IrO2 nanoparticles (denoted IrO2@CCM NPs) was optimized by preparing the nanoparticles by varying the weight ratios (1:1, 5:1, and 10:1) of the core (IrO2) to cell membrane (Fig. 1g), followed by adjusting the ratio of formulations in isotonic phosphate buffered saline (PBS) to match physiological conditions. From the results, the charge screening effect caused the bare IrO2 cores to aggregate significantly without any membrane coating. At higher coating ratios, however, this effect was lessened, suggesting the progressively better surface coverage. Based on the similar zeta potential (Fig. S2h in Supporting information) and size (Fig. S2i in Supporting information) in water and PBS, 168.4 ± 11.7 nm and 219.9 ± 10.9 nm, respectively, it was determined that the optimal core-to-membrane weight ratio was 5:1, which was used as the final formulation as well as all in the subsequent studies.
The GPNA release behavior of IrO2-GPNA@CCM was investigated under the NIR laser irradiation, which showed a temperature-responsive drug release profile. As illustrated in Fig. S2l (Supporting information), the released curve exhibited a higher slope of the curve during irradiation periods, illustrating that the photothermal properties of IrO2 would contribute to the temperature increase of the system and thus accelerating the thermal motion of the molecules to break the electrostatic interaction of GPNA and IrO2. As demonstrated in Fig. S2m (Supporting information), the amount of GPNA released from cancer cell membrane-derived NPs reached to 79.6% in the first 10 h (~1.6 times higher than the non-irradiation group) under NIR irradiation. Such an obvious "off–on" GPNA release controlled by NIR laser could be finely used as a promising strategy for drug delivery. The active agent was released nearly 80% after 24 h in the absence of NIR light, which might be accounted for the degradation of IrO2 nanoparticles in the acidic microenvironment (pH 6.5) to result in the decomposition of the whole nanosystem and facilitate the release of GPNA.
We further to determine if IrO2 could be used as CAT-like activity [15] nanozymes to make the decomposition of H2O2 to produce O2 (Fig. S2n in Supporting information). Such intrinsic property was verified by O2 generation, H2O2 reduction, ESR spectrum and enzyme activity, respectively. As shown in Fig. 1h, the oxygen concentration increased rapidly from 8.0 mg/mL, which was regarded as 0 mg/mL, to 17.6 mg/mL within 30 min, during which the oxygen bubbles could be seen on the tube wall (insertion image). Similarly, we exploited the effect of hydrogen peroxide concentration as well. It could be observed that with the raised concentration of hydrogen peroxide, the final amount of oxygen production was also slightly increased although there was no significant difference in the oxygen production rate in the early stage. Besides, the consumption of H2O2 conduced to characteristic absorption degression at 415 nm, which exhibited yellow peroxidation titanium complex and titanium sulfate even at low levels of H2O2 (1 mmol). The result displayed that about 7% of the H2O2 was degraded after 2 h reaction (Fig. 1i). Furthermore, when the concentration of IrO2 was less than 200 µg/mL, the catalytic activity at pH 7.4 was slightly higher than that at pH 6.5 (Fig. 1j), which was consistent with the optimal pH value of catalase [35]. Meanwhile, the ESR spectrum of CTPO exhibited an obvious proton hyperfine structure in nitrogen saturated solution in the control group. On the contrary, with the augment of IrO2 concentration accompanied by oxygen concentration increased, the ESR triplet spectrum broadened due to the collision frequency between oxygen and nitroxide radical enlarged, which led to the diminishing of the resolution of proton hyperfine structure (Fig. 1k).
An 808 nm NIR laser was employed to evaluate the photothermal ability of IrO2, and the temperature was recorded during this process. Specifically, IrO2 was dispersed in deionized water forming different concentration solutions which were irradiated for 5 min by the NIR laser. As shown in Fig. 1l, with the concentration of IrO2 increased, the manifest augment of temperature was observed (reached 62.5 ℃) in the highest concentration group (200 µg/mL) while there was no obvious temperature fluctuation in deionized water demonstrating the admirable photothermal conversion ability of IrO2 NPs. In the meantime, the temperature of IrO2 NPs pronouncedly changed from 24.1 ℃ to 50.4 ℃, 39.0 ℃ and 30.2 ℃ upon 808 nm NIR laser irradiation of 1.3, 1.0, and 0.8 W/cm2 within 5 min, respectively (Fig. S2p in Supporting information), which was consistent with the visualized photothermal images (Fig. 1m). The photothermal stability of IrO2 was demonstrated by 5 laser on/off cycles (Fig. 1n). There was a similar temperature elevation of IrO2 before and after NIR irradiation, which implied the good photostability. Additionally, the photothermal conversion efficiency (η) was calculated to be 19.6% according to the fitting cooling curve (Fig. 1o). The above results revealed that the IrO2 NPs possessed impressive photothermal conversion efficiency which could act as efficient photothermal nanocarriers.
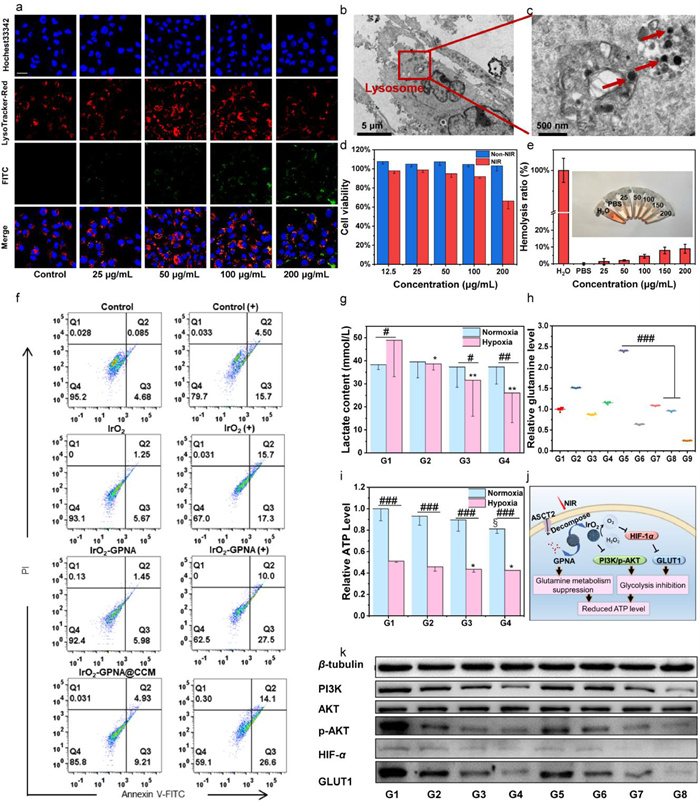
It was of worthy noting that nanoparticles internalized by proliferative cells would be essential for potential application. The cellular uptake experiments of FITC-labeled IrO2@CCM were conducted on the 4T1 cancer cells. From the results, the uptake rate which was verified by the intensified green fluorescence was augmented with the prolonged incubation time (Fig. S3a in Supporting information). Besides, the fluorescence intensity was dose-dependent in varied concentrations of FITC-labeled IrO2@CCM NPs ranging from 0 to 200 µg/mL. It was shown that only dim green fluorescence was observed in the cells when treated with low concentration of IrO2@CCM (Fig. 2a). In contrast, strong green fluorescence of FITC was detected in groups of 100 and 200 µg/mL of FITC-labeled IrO2@CCM NPs, which manifested the concentration-dependent profile of cellular uptake. Simultaneously, such cellular internalization phenomenon was clearly presented by bio-TEM images (Figs. 2b and c). The ingested IrO2@CCM NPs were not only concentrated in lysosomes, but also distributed in the vicinity of mitochondria (Figs. S3b and c in Supporting information), which demonstrated their potential mitochondria targeting ability.
Figure 2
Figure 2.In vitro cellular uptake, cytotoxicity and energy inhibition effect of IrO2-GPNA@CCM NPs. (a) CLSM images of cellular uptake of FITC labeled IrO2@CCM NPs with different concentration. Scale bar: 25 µm. (b, c) Bio-TEM images of 4T1 cells incubated with IrO2-GPNA@CCM NPs after 4 h, red arrows represent IrO2-GPNA@CCM NPs. (d) Cytotoxicity of IrO2-GPNA@CCM NPs. Survival rate of different cells incubated with different concentrations of IrO2-GPNA@CCM NPs for 24 h. (e) Concentration-dependent hemolysis of IrO2-GPNA@CCM NPs (inset: photographic image of corresponding hemolysis). (f) Quantitative apoptosis analysis of 4T1 cells stained with Annexin V FITC/PI, ((+) represents with NIR). (g) Lactate concentration in 4T1 cells under hypoxic environment incubated with DMEM (G1), IrO2 (G2), IrO2-GPNA (G3) and IrO2-GPNA@CCM (G4). (h) Glutamine relative level in 4T1 cells under normoxic or hypoxic environment incubated with different treatments. G1-G9 represent control, IrO2, IrO2-GPNA, IrO2-GPNA@CCM, control with NIR, IrO2-GPNA with NIR, IrO2-GPNA with NIR, IrO2-GPNA@CCM with NIR, and GPNA, respectively. (i) Relative ATP level in 4T1 cells under normoxic or hypoxic environment incubated with IrO2 (G2), IrO2-GPNA (G3) and IrO2-GPNA@CCM(G4), and G1 represents control. (j) Schematic illustration of the anti-tumor mechanism of IrO2-GPNA@CCM in 4T1 cells by inhibiting ATP. (k) Western blot of PI3K, AKT, phosphorylation AKT (p-AKT), HIF-1α, after 4T1 cells were exposed with diverse treatments for 24 h. G1-G8 represent control, IrO2, IrO2-GPNA, IrO2-GPNA@CCM, control with NIR, IrO2 with NIR, IrO2-GPNA with NIR, and IrO2-GPNA@CCM with NIR, respectively. Data are shown as the mean ± SD (n = 5). §P < 0.05, test group vs. G1 (Normoxia); *P < 0.05, **P < 0.01, ***P < 0.001, test group vs. G1 (Hypoxia); #P < 0.05, ##P < 0.01, ###P < 0.001.
Next, Cell Counting Kit-8 (CCK-8) assay was employed in the hope of assessing the 4T1 cell viability after being incubated with IrO2-GPNA@CCM NPs. As shown in Fig. 2d, NIR irradiation enhanced the antitumor effect to induce 33.59% decrease of cell viability after treated with IrO2-GPNA@CCM NPs for 24 h, while relative high cell survival rate was kept in the non-NIR group. Even in the highest concentration of IrO2-GPNA@CCM NPs treated group, the 4T1 cell viability was almost 100%, which suggested that the application of NIR significantly enhanced the cytotoxicity of IrO2-GPNA@CCM NPs ascribing to the release of GPNA. The assessment of the hemocompatibility of IrO2 NPs was then conducted by incubating erythrocytes with different concentrations of IrO2 NPs. We could find out that no significant hemolysis (approximately 8%) of IrO2 NPs was observed even at the concentration of 200 µg/mL (Fig. 2e), demonstrating the good hemocompatibility of IrO2-GPNA@CCM NPs. Additionally, calcein-AM/PI co-staining study was utilized for a deeper insight of the 4T1 cell killing ability by visualizing dead and living cells (red/green fluorescence represents dead/live cells, respectively). As observed in Fig. S4 (Supporting information), cells treated with IrO2 NPs + 808 nm laser presented the strongest red fluorescence signal. Besides, similar outcomes were also received in flow cytometry (Fig. 2f), illustrating that IrO2-GPNA@CCM NPs + NIR presented a remarkably elevated late apoptosis ratio (Q3: 26.6) compared with the control group (Q3: 4.68) after 24 h incubation. In addition, it was also the highest cell apoptosis compared with the other treatments of IrO2 NPs (Q3: 5.67), IrO2-GPNA NPs (Q3: 5.98), IrO2-GPNA@CCM NPs (Q3: 9.21) and IrO2 NPs + NIR (Q3: 17.3).
Inspired by the effective anti-cancer effect in vitro, we further exploited the underlying mechanism. As mentioned before, the fabricated nanosystem would facilitate endogenous decomposition of H2O2. Herein, in order to directly validate this phenomenon, the H2O2 probe was employed to indicate the H2O2 content in cells after receiving different treatments. In this study, LPS induced inflammation as well as H2O2 augment in cellular level [36] was used as model group, in which the green signal was obviously observed (Fig. S5a in Supporting information). In marked contrast, as for the control group without LPS addition and therapy intervention, green fluorescence could be barely detected. Interestingly, after being treated with our designed nanosystems, H2O2 content exhibited corresponding attenuation despite the formulation with or without NIR irradiation, which could be ascribed to the slight effect of irradiation on inherent catalase-like ability. Relative mean fluorescence intensity of each group was calculated and the result (Fig. S5b in Supporting information) verified that there was no significant difference between G8 (IrO2-GPNA@CCM (+)) and G9 (control) revealing the high H2O2 elimination efficiency of the final formulation.
Next, we measured the alleviation extent of hypoxia in cellular level (Fig. S5c in Supporting information). The hypoxia (red) dye was applied since nitroreductase could convert the nitro group to hydroxylamine (NHOH) and amino (NH2), thus releasing the fluorescent probe in hypoxic cells. From the results, the red signal was barely captured in normoxic environment since few nitroreductase was presented in these cells, which was in line with the principle of the dye. However, once treated in hypoxic environment, the intensity was strong in control group, while only weak red fluorescence was found in the IrO2-GPNA@CCM NPs group, which was attributed to O2 generation in cells. The fluorescence intensity of IrO2-GPNA@CCM NPs treated group was significantly lower than any other group (Fig. S5d in Supporting information). Based on the above experimental results, we could draw the conclusion that the IrO2-GPNA@CCM NPs efficiently ameliorated the hypoxia environment by converting the H2O2 to O2, which would further affect the metabolism of cells.
It was far away to clarify the interrupted metabolism of cells by verifying the improvement of the cellular hypoxic environment because anaerobic glycolysis was a predominate feature in cancer cells, which meant lactate was still the main production even with the sufficient O2 supply. As the key intermediate metabolite, lactate could readily replace glucose as a fuel [37], as a result, the content of lactate was collected and calculated (Fig. 2g) to evaluate the lactate inhibition extent by our nanosystem. We could see that lactate content was similar in normoxia environment despite different treatments. However, when incubated in hypoxia environment, the concentration of lactate was gradually downregulated from control, IrO2, IrO2-GPNA to IrO2-GPNA@CCM NPs treated groups. Besides, the lactate concentration in hypoxia environment was lower than normoxia groups (P < 0.05). Then, as the main energy source for cancer cells' replenishment pathways, glutamine the concentration of was also measured (Fig. 2h) and calculated through the standard curve (Fig. S6 in Supporting information). The loading of GPNA could competitively inhibit glutamine intake as it would bind to ASCT2 which mediated the internalization of glutamine. In hypoxia environment, the irradiation of NIR significantly increased the glutamine uptake due to the enhanced metabolic activity [38], which further verified that tumor cells would seek to another energy supply to support their survival when lactate was suppressed. However, in groups treated with IrO2-GPNA NPs and IrO2-GPNA@CCM NPs, cells exhibited lower percentages of glutamine compared to the solo IrO2 group, demonstrating that the loaded GPNA could inhibit the uptake of glutamine, thereby inducing comprehensive interruption of cancer cell metabolism. Therefore, based on the obvious reduction of lactate and glutamine levels resulted from IrO2-GPNA@CCM NPs, we further evaluated the ATP expression level. We could find out that it showed a similar tendency in line with the lactate level in the related groups (Fig. 2i). Specifically, when cells were incubated with our final formulation, ATP was significantly decreased (P < 0.05), which inclined to prove that IrO2-GPNA@CCM NPs markedly interrupted the energy supply in cancer cells due to the two main fuel of lactate and glutamine were suppressed.
For further research, immunoblot assay was employed to investigate the molecular mechanism and the pathway involved in metabolism interruption of 4T1 cells (Fig. 2j). From the results (Fig. 2k), the expression of PI3K was significantly downregulated in IrO2-GPNA@CCM NPs + NIR group compared to the control group. In addition, the downstream phosphorylation AKT (p-AKT) exhibited obvious reduction in quantified analysis (Fig. S7 in Supporting information), which was correlated with low HIF-1α levels [39], signifying that IrO2-GPNA@CCM NPs obstructed glycolysis by influencing PI3K/pAKT pathway. Besides, by the generation of O2, the expression of HIF-1α, which is a key mediator in the switch from oxidative to glycolytic metabolism, was evidently relieved. More importantly, the expression GLUT1 that in charge of glucose uptake also declined observed from Western blot, which was consistent with the previous report [40]. These above results fully demonstrated the underlying principles and molecular mechanisms for the interruption glucose metabolism by the synthesized nanocarriers.
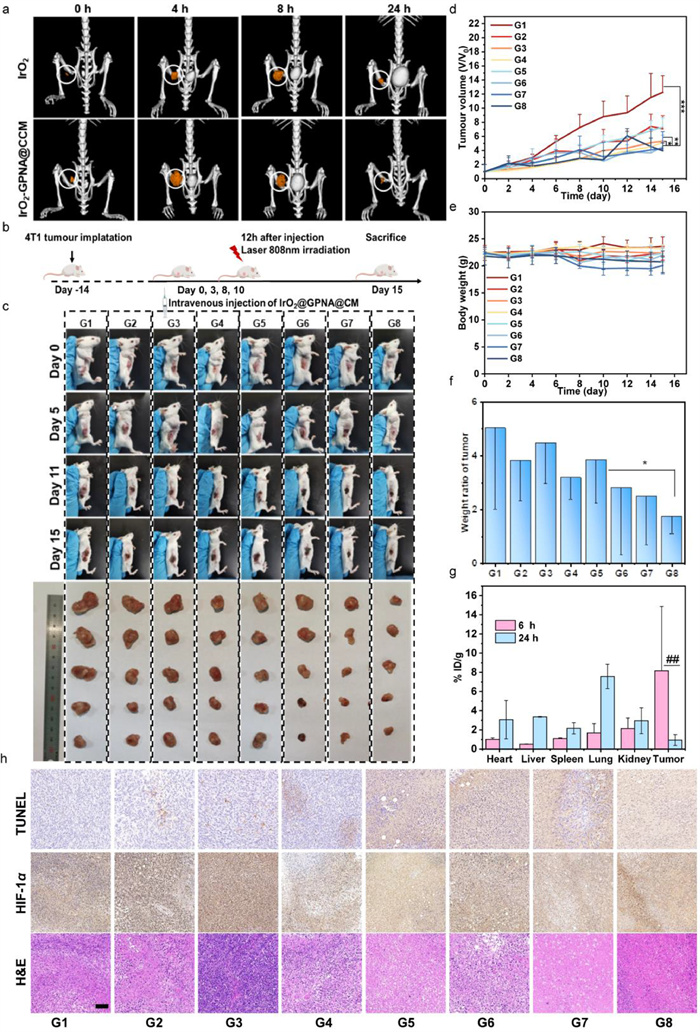
The IrO2 exhibited impressive photothermal capacity in vitro, as a result, we further detected this ability using the infrared thermal imaging in vivo (Fig. S8 in Supporting information). All animal procedures were performed according to protocols approved by the Institutional Animal Care and Use Committee at Institute of Tianjin University and animal handling followed the dictates of the National Animal Welfare Law of China. All animal experiments were performed according to the Guide Principles for the Care and Use of the Animal management regulations of 2017. Compared to the control group (PBS), the tumor sections were obviously heated up in IrO2 injected mice within 5 min under irradiation of an 808 nm NIR. At the same time, mice treated with IrO2-GPNA@CCM solution also exhibited a strong temperature increase (45 ℃) at tumor site, which was higher and faster than the IrO2 group due to the enhanced encapsulation of 4T1 cancer cell membrane. Moreover, computed tomography (CT) is an essential tool in the diagnostic work-up in veterinary medicine for its superior anatomical resolution. Herein, the outstanding CT imaging capacity of IrO2 was also verified both in vitro and in vivo (Fig. 3a). As shown in Fig. S9 (Supporting information), with the concentration elevating, the CT signal intensity of IrO2 NPs dispersions increased which was obeyed to a liner relationship with concentrations (50–600 µg/mL). Moreover, a strong cancer contrast signal enrichment was observed at tumor site 8 h post injection due to the accumulation of IrO2 NPs by EPR effect. As for IrO2-GPNA@CCM NPs (10 mg/kg) injected mice, the maximum enhancement was shown at 4 h post-injection, which might due to the homogenous targeting ability derived from the 4T1 cancer cell membrane coating.
Figure 3
Figure 3.In vivo imaging ability and therapeutic effect of IrO2-GPNA@CCM NPs in BALB/c. (a) CT imaging of tumor on mice before and after injection of IrO2 NPs and IrO2-GPNA@CCM NPs. (b) Schematic illustration of the in vivo therapeutic process. (c) Photographs of the tumor region after various treatments and images of the dissected tumors after various treatments in 15 days. (d) Tumor volume changes in 15 days after various treatments (n = 5). (e, f) The relative body weight and tumor mass in mice from the different treatment groups. Data are shown as the mean ± SD (n = 5). *P < 0.05, **P < 0.01, ***P < 0.001. (g) Time-dependent biodistribution of IrO2 NPs in main organs and tumor. ##P < 0.01. (h) TUNEL, HIF-1α and H & E staining of tumor sections on the 15th day. Scale bar: 200 µm. G1-G8 represent PBS, IrO2, IrO2-GPNA, IrO2-GPNA@CCM, PBS with NIR, IrO2 with NIR, IrO2-GPNA with NIR and IrO2-GPNA@CCM with NIR, respectively.
The 4T1 xenografts bearing mice were used as the model to verify the therapeutic effect in vivo. After being received 4 rounds therapy (Fig. 3b), the mice were scarified to extract tumor and main organs (i.e., heart, liver, spleen, lung and kidney) for further analysis. From the results, the tumor volume was apparently shrunk in mice received IrO2-GPNA@CCM NPs injection during the treatment period (Fig. 3c). Without any interference, the tumor volume increased so quick that reached 10 times up in comparison with the primary volume 15 days later (Fig. 3d). What is more, IrO2 and IrO2-GPNA alone showed negligible antineoplastic effects compared with IrO2-GPNA@CCM without NIR irradiation, demonstrating that the tumor inhibition effects were not obvious in solo IrO2 and IrO2-GPNA treated group. It was worth noting that IrO2-GPNA@CCM NPs with the additional NIR irradiation exhibited remarkable suppression of the tumor growth, specifically, the tumor volume of which was significantly smaller than the control group (P < 0.01). After 15 days of treatment, no obvious weight loss (20.7–23.6 g) was found in IrO2-GPNA@CCM NPs group (Fig. 3e), indicating the ignorable systemic toxicity. More importantly, the optimal treatment (IrO2-GPNA@CCM NPs) could reduce the tumor weight significantly (P < 0.001) with the one fifth mean tumor weight compared to the untreated tumor-bearing group (Fig. 3f), representing the maximized therapeutic effect of IrO2-GPNA@CCM NPs under NIR irradiation.
After verifying the tumor therapeutic effect in vivo, the biodistribution was also carried to assess the biosafety. As shown in Fig. 3g, IrO2-GPNA@CCM was mainly accumulated in tumor site 6 h-post injection and metabolized by kidney and livers within 24 h with the corresponding content increased in excreta (Fig. S11a in Supporting information). The serum was then collected to perform routine blood biochemistry, from the results (Fig. S11c in Supporting information), there were no dramatic distinct between PBS group and administration groups, which indicated that the function of the liver and kidneys were not impaired during 15 days.
After 15 days treatment, the separated organs were used to detect ex vivo toxicity by performing H & E staining (Fig. S11d in Supporting information) and immunohistochemical analysis. The obvious apoptosis and neutrophils accumulation in tumor section observed in the IrO2-GPNA@CCM NPs +NIR group suggested the evident therapeutic effect of our treatment, which was in line with the results of TUNEL staining (Fig. 3h). At the same time, immunohistochemical assays (Fig. S12 in Supporting information) confirmed that the optimal carrier with NIR exhibited a significant inhibitory effect on HIF-1α, illustrating that such combination therapy was able to induce the tumor apoptosis execution. As for main organs in the IrO2 GPNA@CCM NPs + NIR group, no obvious difference was detected compared with the control group, which revealed the low systemic toxicity of IrO2-GPNA@CCM. It could be concluded that IrO2-GPNA@CCM NPs +NIR could efficiently suppress the tumor with a favorable biocompatibility and biosecurity.
In summary, we developed a comprehensive strategy of cancer cell metabolism interruption based on IrO2-GPNA@CCM NPs. The targeting ability was enhanced derived from the encapsulation of homologous tumor cell membranes. On one hand, the synthesized IrO2-GPNA@CCM NPs possessed intrinsic catalase-like activity which could facilitate the decomposition of endogenous H2O2 to effectively relieve the hypoxia condition inhibiting the expression of HIF-1α as well as GLUT1. Meanwhile, IrO2 would downregulate the expression of PI3K/pAKT, by which the glycolysis would be restrained to induce the reduced lactate level. On the other hand, loaded GPNA could effectively combine with ASCT2 to result in the decreased glutamine uptake. Thus, this membrane-derived biodegradable nanosystem ultimately switched off ATP supply to realize the comprehensive metabolism interruption in cancer cells by synergistically restraining glutamine uptake and suppressing glycolysis. Both in vitro and in vivo experiments revealed that IrO2-GPNA@CCM NPs with NIR irradiation treatment could notably inhibit the tumorigenesis. In virtue of the admirable therapeutic effects, this nanotherapy strategy provided a constructive solution for the future design of metabolism related tumor-suppress strategy.
Declaration of competing interest
The authors declare that they have no conflict of interest.
Acknowledgment
This work was supported by the National Natural Science Foundation of China (Nos. 82273873, 31971106, 81372124), National Key Research and Development Program of China (Nos. 2020YFC1512304, 2020YFC1512301), the Applied Basic Research Project of Tianjin (No. 21JCYBJC00660), the Young Elite Scientists Sponsorship Program by Tianjin (No. 0701320001), and the Major Special Projects of Tianjin (No. 0402080005).
Supplementary materials
Supplementary material associated with this article can be found, in the online version, at doi:10.1016/j.cclet.2023.108161.
H. Sheng, M. G. Jonathan, J. M. Raphael, et al. Nature 551 (2017) 115–118. doi: 10.1038/nature24057
[38]
L. Andreo, R.A. Mesquita-Ferrari, L. Grenho, et al., Photochem. Photobiol. 97 (2021) 198–204. doi: 10.1111/php.13323
[39]
E.H. Gort, A.J. Groot, T.L.P. van de Derks Ven, et al., Oncogene 25 (2006) 6123–6127. doi: 10.1038/sj.onc.1209643
[40]
D. Cibrian, H. de La Fuente, F. Sánchez-Madrid, Trends Mol. Med. 26 (2020) 975–986. doi: 10.1016/j.molmed.2020.04.004
Scheme 1
Schematic illustration for the mechanism of comprehensive energy inhibition. (a) Schematic illustration of the preparation of IrO2-GPNA@CCM. CCM (cancer cell membrane), GPNA (l-γ-glutamyl-p-nitroanilide). (b) The mechanism of IrO2-GPNA@CCM mediated photo-thermal therapy to trigger potentiate energy blockade therapies for anti-tumors.
Figure 1
Characterizations of IrO2-GPNA@CCM. (a) TEM image of IrO2 NPs and (b) IrO2 NPs coated with 4T1 cancer cell membrane. (c) HAADF-STEM image and EDX elemental mapping. (d) XPS spectra of IrO2 nanoparticle. (e) FT-IR spectra of IrO2, GPNA and IrO2-GPNA. (f) UV–vis absorption spectrum measured at 250–800 nm of IrO2 NPs, GPNA and IrO2-GPNA. (g) Average hydrate particle size of IrO2 @CCM with different mass ratio. (h) pH-dependent H2O2-triggered O2 generation by IrO2 NPs in PBS (DO: dissolved oxygen), IrO2 (200 µg/mL). (i) H2O2 consumption within 2 h. (j) CAT activity of IrO2 at different concentration. ***P < 0.001, test group vs. 200 µg/mL group (pH 6.5); §§§P < 0.001, test group vs. 200 µg/mL group (pH 7.4); ###P < 0.001, pH 6.5 vs. pH 7.4 group. (k) ESR spectra of CAT with different conditions. (l) Thermal images of IrO2 aqueous dispersion and water treated with 808 nm NIR laser irradiation for 5 min. (m) The photothermal profiles of aqueous dispersions of IrO2 with different concentrations under 808 nm laser irradiation with a power density of 1.5 W/cm2. (n) Temperature elevation curves of IrO2 (200 µg/mL) over five cycles of 808 nm NIR laser on/off irradiation. (o) Photothermal effect of IrO2 under 808 nm laser (1.5 W/cm2). The irradiation lasted for 300 s; Plot of cooling time versus negative natural logarithm of the driving force temperature obtained from a cooling stage to calculate time constant (Ts) for heat transfer.
Figure 2In vitro cellular uptake, cytotoxicity and energy inhibition effect of IrO2-GPNA@CCM NPs. (a) CLSM images of cellular uptake of FITC labeled IrO2@CCM NPs with different concentration. Scale bar: 25 µm. (b, c) Bio-TEM images of 4T1 cells incubated with IrO2-GPNA@CCM NPs after 4 h, red arrows represent IrO2-GPNA@CCM NPs. (d) Cytotoxicity of IrO2-GPNA@CCM NPs. Survival rate of different cells incubated with different concentrations of IrO2-GPNA@CCM NPs for 24 h. (e) Concentration-dependent hemolysis of IrO2-GPNA@CCM NPs (inset: photographic image of corresponding hemolysis). (f) Quantitative apoptosis analysis of 4T1 cells stained with Annexin V FITC/PI, ((+) represents with NIR). (g) Lactate concentration in 4T1 cells under hypoxic environment incubated with DMEM (G1), IrO2 (G2), IrO2-GPNA (G3) and IrO2-GPNA@CCM (G4). (h) Glutamine relative level in 4T1 cells under normoxic or hypoxic environment incubated with different treatments. G1-G9 represent control, IrO2, IrO2-GPNA, IrO2-GPNA@CCM, control with NIR, IrO2-GPNA with NIR, IrO2-GPNA with NIR, IrO2-GPNA@CCM with NIR, and GPNA, respectively. (i) Relative ATP level in 4T1 cells under normoxic or hypoxic environment incubated with IrO2 (G2), IrO2-GPNA (G3) and IrO2-GPNA@CCM(G4), and G1 represents control. (j) Schematic illustration of the anti-tumor mechanism of IrO2-GPNA@CCM in 4T1 cells by inhibiting ATP. (k) Western blot of PI3K, AKT, phosphorylation AKT (p-AKT), HIF-1α, after 4T1 cells were exposed with diverse treatments for 24 h. G1-G8 represent control, IrO2, IrO2-GPNA, IrO2-GPNA@CCM, control with NIR, IrO2 with NIR, IrO2-GPNA with NIR, and IrO2-GPNA@CCM with NIR, respectively. Data are shown as the mean ± SD (n = 5). §P < 0.05, test group vs. G1 (Normoxia); *P < 0.05, **P < 0.01, ***P < 0.001, test group vs. G1 (Hypoxia); #P < 0.05, ##P < 0.01, ###P < 0.001.
Figure 3In vivo imaging ability and therapeutic effect of IrO2-GPNA@CCM NPs in BALB/c. (a) CT imaging of tumor on mice before and after injection of IrO2 NPs and IrO2-GPNA@CCM NPs. (b) Schematic illustration of the in vivo therapeutic process. (c) Photographs of the tumor region after various treatments and images of the dissected tumors after various treatments in 15 days. (d) Tumor volume changes in 15 days after various treatments (n = 5). (e, f) The relative body weight and tumor mass in mice from the different treatment groups. Data are shown as the mean ± SD (n = 5). *P < 0.05, **P < 0.01, ***P < 0.001. (g) Time-dependent biodistribution of IrO2 NPs in main organs and tumor. ##P < 0.01. (h) TUNEL, HIF-1α and H & E staining of tumor sections on the 15th day. Scale bar: 200 µm. G1-G8 represent PBS, IrO2, IrO2-GPNA, IrO2-GPNA@CCM, PBS with NIR, IrO2 with NIR, IrO2-GPNA with NIR and IrO2-GPNA@CCM with NIR, respectively.

 DownLoad:

 下载:
下载:


