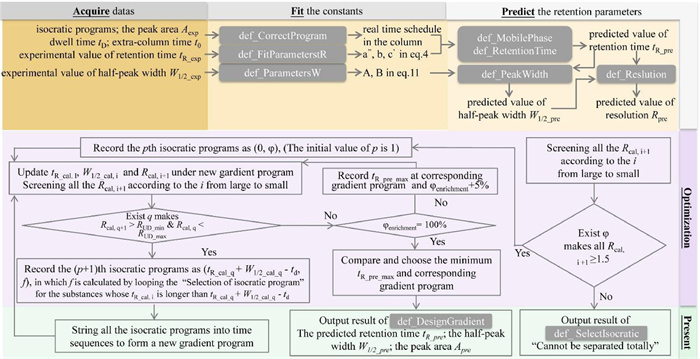
Figure 1.
The algorithmic architecture for optimizing the chromatographic separation in the online enrichment-LC tandem system.
Novel computer-assisted approach to quick prediction and optimization of gradient separation for online enrichment-reversed phase liquid chromatography tandem system
Shuying Han , Yilin Song , Xinyi Jiang , Junqin Qiao , An Kang , Haishan Deng , Dong Zhu , Rui Liu , Hongzhen Lian

Gradient elution in high performance liquid chromatography (HPLC) is a commonly used technique based on programmed separation modes, with which the separation and peak detection capabilities can be considerably enhanced. Among these modes the most powerful is solvent gradient elution, where the composition of the mobile phase programmed changes during the run by mixing two or more components. In general, the solvent gradient elution exploits completely its potentialities only if we can make prediction of the retention time (tR) on the basis of the properties of the solute and the gradient profile. The fundamental equation for tR prediction under the solvent gradient elution is (Eq. 1):
|
|
(1) |
where kφ is the retention factor of a solute with organic modifier composition in mobile phase at φ, and t0 is the column holdup time. This equation was first proposed by Snyder et al. [1], and subsequently amended to its strict derivations by Levie [2,3]. Later, Nikitas and co-workers developed theory of the multimode gradient elution in LC [4-7]. In multimode gradient elution, two or more separation variables involving mobile-phase composition, flow rate and/or temperature were used for predicting tR [8].
However, accurate prediction of tR does not mean that the prediction for separation of analytes has been successfully realized on LC, because the resolution of the pairs is not only related to the difference in tR, but also to the peak shape, e.g., peak widths [9]. Several models have been developed for predicting peak shape for LC [10-15]. A recursion method for the prediction of bandwidth in a gradient elution was reported by Liang and Liu [10]. Jin et al. developed a method for predicting the elution bandwidths of four purine compounds based on linear solvent strength (LSS) model [11]. Pai proposed a parcel matrix model [12], which improved Glueckauf's dynamic mode [13], Fritz and Scott's statistic model [14] and de Levie's linear worksheet models [2,3], leading to a more realistic simulation to the peak shape.
Above-mentioned theories and models have been widely applied to reduce the number of experiments needed to optimization process, and several commercial software packages have been available for predicting separation, among which DryLab [15], PREOPT-W [16], OSIRIS [17], MICHROM [18] and ChromSword [19] were most commonly used. However, the majority of them were carried out only for one-dimensional LC. There were only a few reports concerning the multi-dimensional LC (multi-D LC) system [20-22], and these retention models involving gradient elution usually resulted in an equation difficult to integrate due to the higher number of experimental variables that should be taken into account. Moreover, the models would be much more complicated provided that both gradient elution and peak shape are considered simultaneously. Up to now, the universal way to seek a good compromise between sufficient separation and lowest possible expense is experimental ("trial-and-error") optimization where the analyst manually varies method parameters until the resulting separation is acceptable. Therefore, one of the factors which may contribute to the further growth of the tandem LC system, especially the online-enrichment LC system for analyzing trace structural analogues in environmental, food and biological samples is the possibility of finding the operating conditions for an optimal separation in easy and reliable ways.
Here, we presented a new approach incorporating the prediction of retention time and peak shape that allows for optimizing separation of structural analogues in tandem LC system. The proposed strategy was supported by different models and algorithms capable of describing the chromatographic behavior of solutes upon various changes in the separation factors such as the mobile phase contents and flow rates, and validated by optimizing the separation of bisphenols (BPs) and ginsenosides, which were difficult to separate in environmental and food analysis as well [23,24]. An optimization software package has also been developed for simplifying the use of this strategy.
In the theoretical derivation, we first divided the separation prediction in single LC system into the following steps: for prediction of tR and for prediction of half-peak width (W1/2). On this basis, we further deduced the separation prediction for tandem LC system and obtained the prediction formulas of tR (Eq. S31 in Supporting information) and W1/2 (Eq. S32 in Supporting information) of substances in tandem LC system.
The flowchart shown in Fig. 1 and the annotation of algorithm listed in Table S1 (Supporting information) indicated the algorithmic procedure for the proposed prediction strategy. The predicted tR and W1/2 were introduced for fast confirmation of the appropriate gradient elution program, with which the desirable separation for all the analytes according to user-defined minimum resolution (RUD_min) and maximum resolution (RUD_max) could be achieved in the shortest run time. Overall, the optimal time schedule and relevant chromatogram would be displayed by imputing the experimental retention time tR_exp, the half-peak width W1/2_exp and the peak area Aexp of each analyte at 3~5 different isocratic φ, as well as RUD_min, RUD_max, holdup time (t0) and dwell time (td) of HPLC system.
The theoretical derivation and experiments in this paper are detailed in the Theoretical Section and the Experimental Section of Supporting information, respectively. The fitting parameters in Eqs. S4 and S11 (Supporting information) for eight BPs and five ginsenosides were shown in Table S2 (Supporting information) when td was 1.1 min, as well as t0 was 2.7 min for 250 mm column and 1.4 min for 150 mm column at a constant flow rate of 0.9 mL/min with MeOH—H2O as the mobile phase. If ACN—H2O was used as mobile phase, t0 was 1.1 min in 150 mm column at a constant flow rate of 1.5 mL/min.
As shown in Table S2, the a'', b, c' in Eq. S4 and A, B in Eq. S11 for BPs was acquired under 0.90, 0.80, 0.70 and 0.65 fractions of MeOH in 250 mm column, as well as 0.55, 0.60, 0.65 and 0.70 fractions of MeOH in 150 mm column with R2 > 0.908 and F > 30.52 (P < 0.05), showing the satisfactory fitting results. Meanwhile, the retention descriptors of ginsenosides were acquired under 0.17, 0.20, 0.23, 0.27 and 0.3 fractions of ACN for R1, Rg1 and Re, as well as 0.3, 0.33, 0.36 and 0.4 fractions of ACN for Rb1 and Rd with R2 ranged from 0.996 to 1.000 with P < 0.05, which also indicated the good linearity and significant statistics in the fitting process. Note that if organic modifier ratio went out of the φ-gradients range listed in Table S2, the RTs of ginsenosides would be either too long or too short, implying that the retention behaviors of ginsenosides are sensitive to the ratio of ACN and ginsenosides are difficult to be separated only relying on experience.
The accuracy of the proposed strategy was based on both the reliability of separating prediction for one-dimensional chromatographic system and the reasonability of connecting two one-dimensional systems, which were investigated in two steps as follows.
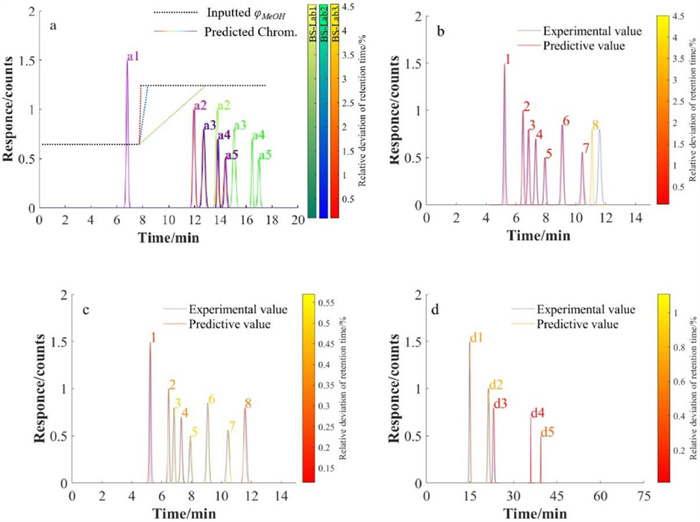
Firstly, five one-dimensional chromatographic conditions listed in Table S3 (Supporting information) were tested to verify the reliability of proposed strategy with two kinds of analogues, BPs and ginsenosides, and chromatograms of the predicted and experimental results are shown in Fig. 2. Fig. 2a included three experiments where φMeOH for BPA, BPC, BPZ, BPP and TMBPA in 150 mm column changed from 0.60 to 0.75 with different interval time at constant flow rate of 0.9 mL/min: BS-Lab1 cost 300 s, BS-Lab2 took 12 s and BS-Lab3 jumped rapidly in 0.06 s. The high consistency between the predicted and experimental chromatograms under all the three gradient programs indicated that the algorithm was robust under different gradient slopes of MeOH. Interestingly, the chromatograms of BS-Lab2 and BS-Lab3 were similar, which was the indirect proof of a relatively fixed gradient delay in gradient elution caused by td as stated by Nikitas [25]. It inspired us that when it comes to the BS-Lab 4, where the φACN for BPA, BPB, BPAF, BPAP, BPC, BPZ, BPPM, TMBPA in 250 mm column continuously varied within td, the set mobile phase gradient should be corrected by adding td with ti to compensate the influence of the delay on actual φ-gradient change. Actually, after correcting φ-gradient, the maximum RADs of predicted and experimental retention times reduced from 4.5% (Fig. 2b) to 0.55% (Fig. 2c) by delaying the changing time of mobile phase. Another type of compounds were gradient-sensitive ginsenosides. According to Pharmacopoeia of the People's Republic of China (2015 edition) [26], HPLC method (GS-Lab) where φMeOH pumped at the rate of 1.5 mL/min for R1, Rg1, Re, Rb1 and Rd in 150 mm column was applied to further confirm the reliability of the proposed strategy. As shown in Fig. 2d, the RADs between experimental and predictive values ranged from 0.2% to 1%. Herein, the proposed strategy can accurately predict the retention times and peak shapes for various compounds under different mobile phases and flow rates in one-dimensional chromatographic system with the RAD within 1%.
To evaluate the effect of the strategy on the online enrichment coupled with HPLC separation system, as well as to test the influence of three processes of this system (enrichment, backwash and separation processes) on prediction accuracy, three experiment programs according to the method reported in our previous work [27] (BD-Lab0 in Table S3) with some modifications were applied by employing BPs as the modeling compounds:
(1) The enrichment mobile phase ratio changed from 5% to 25% with fixed separation and backwash process (BD-Lab2 in Table S3).
(2) The backwash time was extended to 4 min while the enrichment and analysis processes remained unchanged (BD-Lab3 in Table S3).
(3) The mobile phase of separation changed while keeping the enrichment and backwash progress unchanged (BD-Lab4 in Table S3).
By comparing the experimental and predicted data collected from these three programs in Table S4 (Supporting information), it was observed that the RADs between experimental and predicted retention times were 0.01%–1.06%, indicating the accuracy of the online enrichment prediction model for retention time under different enrichment program. However, when it comes to the accuracy of half-peak widths, 84% RADs between the predicted half-peak widths and the measured values were less than 20%, while the rest were between 20% and 42%, which caused the RAD of resolution varied from 1.44% to 42.95%. The larger deviation occurred at the time when the peak appeared meanwhile the gradient of the mobile phase changed. The prediction of chromatographic peak width in two-dimensional LC was not as accurate as in one-dimensional LC system, which may be due to the more complex factors related to two-dimensional liquid hydrodynamics, which reminded us that the principle of peak width is much more complicated and is worth exploring further.
After verifying the feasibility of the prediction strategy, a software package for separation optimization was developed in our lab to output hypothetical optimal conditions and corresponding chromatograms to give highest resolution in shortest run time, which was then confirmed by practical experiments.
The hypothetical optimal separation conditions for BPs using MeOH as the mobile phase in tandem system was recorded as BD-Pre listed in Table S3. The experimental and predicted retention times as well as half-peak widths on the basis of the hypothetical optimal gradient elution program are listed in Table S5 (Supporting information). The results in Table S5 indicated that the satisfactory separation of BPs mixtures could be obtained in a minimum run time, ~17.29 min, which was shorter than the method of BD-Lab1 developed in our previous work [27] (the analysis time of which was 20.36 min). In other words, the optimization software package provided a protocol that all substances can be effectively separated (all resolutions > 1.2) in 15 s with comparable results to experimental ones.
In addition, the software package was employed to predict the separation conditions of gradient-sensitive ginsenosides in single column HPLC system (GS-Pre) and in two-dimensional HPLC system (GD-Pre), respectively. As shown in Tables S3 and S5, both of the predicted programs allowed baseline separation of 5 ginsenosides within 30 min, which was much shorter than the proposal mentioned in the Chinese Pharmacopoeia (~100 min) with more convenient chromatographic separation conditions [26].
So far, only the commercial prediction software used for one-dimensional LC can be available. Thus, the prediction results for single column were compared between the commercial ACD/LC and the homemade algorithm. The results listed in Table S6 (Supporting information) indicated that the predicted retention times of BS-Lab1, 2, 3 and GS-Lab using both software were similar, but the algorithm we developed was significantly better than ACD/LC in predicting retention times of BS-Lab4 due to the drastic change in the mobile phase was corrected in our algorithm. In terms of peak widths, the RADs between the predicted and experimental results were within 16% except BPZ and BPC, no matter it was coming from ACD/LC or our algorithm, which may be attributed to the narrow peak width magnified the deviation.
In conclusion, a new approach incorporating the prediction of retention time and peak shape that allows for optimizing separation of structural analogues in LC tandem system was proposed and validated. The method has been applied to the prediction and optimization of the separation among two groups of structural analogues, bisphenols and ginsenosides, respectively, by an optimization software package developed for simplifying the use of the strategy established in this work. The proposed strategy was efficient and eco-friendly to simultaneous analysis and monitoring structural analogues due to its high throughput, low solvent consumption and reduction of manual labor.
The authors declare that they have no known competing financial interests or personal relationships that could have appeared to influence the work reported in this paper.
This work was supported by National Natural Science Foundation of China (Nos. 82174090, 22176085, 21874065, 21577057), Natural Science Foundation for Colleges of Jiangsu (No. 21KJA360007), Priority Academic Program Development of Jiangsu Higher Education Institutions (PAPD), Jiangsu Qinglan Project and Jiangsu "333" Project.
Supplementary material associated with this article can be
found, in the online version, at doi:
L.R. Snyder, J.W. Dolan, J.R. Gant, J. Chromatogr. A 165 (1979) 3–30. doi: 10.1016/S0021-9673(00)85726-X
R. De Levie, Principles of Quantitative Chemical Analysis, McGraw-Hill International Edition, Singapore, 1997.
R. De Levie, How to Use Excel in Analytical Chemistry and in General Scientific Data Analysis, Cambridge University Press, Cambridge, 2001.
P. Nikitas, A. Pappa-Louisi, K. Papachristos, C. Zisi, Anal. Chem. 80 (2008) 5508–5514. doi: 10.1021/ac800514m
P. Nikitas, A. Pappa-Louisi, P. Balkatzopoulou, Anal. Chem. 78 (2006) 5774–5782. doi: 10.1021/ac0606655
S. Fasoula, C. Zisi, H. Gika, A. Pappa-Louisi, P. Nikitas, J. Chromatogr. A 1395 (2015) 109–115. doi: 10.1016/j.chroma.2015.03.068
C. Zisi, S. Fasoula, A. Pappa-Louisi, P. Nikitas, Anal. Chem. 85 (2013) 9514–9521. doi: 10.1021/ac4021243
S.Y. Han, H.M. Yu, Y.Q. Pei, Y.M. Chi. RSC Adv. 5 (2015) 62686–62696. doi: 10.1039/C5RA09524G
F. Gritti, G. Guiochon, J. Chromatogr. A 1145 (2007) 67–82. doi: 10.1016/j.chroma.2007.01.056
H. Liang, Y. Liu, J. Chromatogr. A 1040 (2004) 19–31. doi: 10.1016/j.chroma.2004.03.048
C.H. Jin, J.W. Lee, K.H. Row, J. Sep. Sci. 31 (2008) 23–29. doi: 10.1002/jssc.200700244
S.C. Pai, J. Chromatogr. A 988 (2003) 233–260. doi: 10.1016/S0021-9673(03)00029-3
E. Glueckauf, Trans. Faraday Soc. 51 (1955) 34–44. doi: 10.1039/TF9555100034
J.S. Fritz, D.M. Scott, J. Chromatogr. A 271 (1983) 193–212. doi: 10.1016/S0021-9673(00)80219-8
I. Molnar, J. Chromatogr. A 965 (2002) 175–194. doi: 10.1016/S0021-9673(02)00731-8
R. Cela, M. Lores, Comput. Chem. 20 (1996) 193–202. doi: 10.1016/0097-8485(95)00063-1
S. Heinisch, E. Lesellier, C. Podevin, J.L. Rocca, A. Tchapla, Chromatographia 44 (1997) 529–537. doi: 10.1007/BF02466747
S. Carda-Broch, J.R. Torres-Lapasió, M.C. Garcı́a-Alvarez-Coque, Anal. Chim. Acta 396 (1999) 61–74. doi: 10.1016/S0003-2670(99)00368-2
W.D. Beinert, R. Jack, V. Eckert, et al., Am. Lab. 33 (2001) 14–15.
D.N. Bassanese, B.J. Holland, X.A. Conlan, et al., Talanta 134 (2015) 402–408. doi: 10.1016/j.talanta.2014.11.037
A.A. Lobas, L.I. Levitsky, A. Fichtenbaum, et al., J. Anal. Chem. 72 (2017) 1375–1382. doi: 10.1134/s1061934817140076
P. Jandera, Cent. Eur. J. Chem. 10 (2012) 844–875. doi: 10.2478/s11532-012-0036-z
H.Z. Zhao, J.F. Li, X.L. Ma, et al., Chin. Chem. Lett. 29 (2018) 102–106. doi: 10.1016/j.cclet.2017.06.013
R.F. Bai, D.S. Sun, Y.Q. Shan, et al., Chin. Chem. Lett. 32 (2021) 3237–3240. doi: 10.1016/j.cclet.2021.04.031
P. Nikitas, A. Pappa-Louisi, J. Chromatogr. A 1068 (2005) 279–287. doi: 10.1016/j.chroma.2005.02.004
Chinese Pharmacopoeia Committee, Ginseng Radix Et Rhizoma in: Pharmacopoeia of the People's Republic of China (Volume I), China Medical Science Press, Beijing, 2015, pp. 8–9.
S.Y. Han, Y.L. Song, J.C. Hu, et al., Food Chem. 339 (2021) 127766. doi: 10.1016/j.foodchem.2020.127766

Figure 1 The algorithmic architecture for optimizing the chromatographic separation in the online enrichment-LC tandem system.

Figure 2 Comparison of the predicted and experimental chromatograms of one-dimensional chromatographic system. (a) Gradient programs of BS-Lab1, BS-Lab1 and BS-Lab3; (b, c) Gradient program of BS-Lab4; (d) Gradient program of GS-Lab. Peak identification: a1 and 1. BPA; 2. BPB; 3. BPAF; 4. BPAP; a2 and 5. BPC; a3 and 6.BPZ; a4 and 7. BPP; a5 and 8. TMBPA; d1. R1; d2. Rg1; d3. Re; d4. Rb1; d5. Rd.

 扫一扫看文章

扫一扫关注我们
 DownLoad:
 下载:
下载: