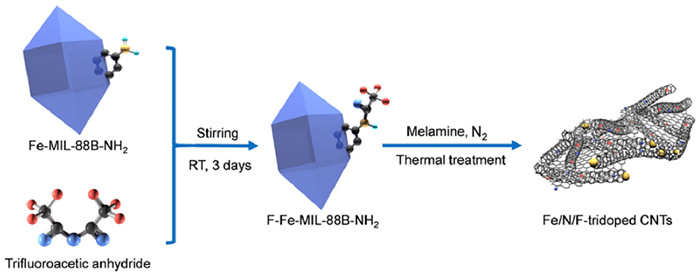
Scheme1.
Schematic illustration for the fabrication of FeNFC700/800/900 catalysts.
Transformation of postsynthesized F-MOF to Fe/N/F-tridoped carbon nanotubes as oxygen reduction catalysts for high power density Zn-air batteries
Ao Yu , Wangtao Long , Longtao Zhu , Yinan Zhao , Ping Peng , Fang-Fang Li

Today's energy-demanding society is still highly dependent on the input of fossil fuels. However, the use of fossil fuels is not only restricted by their finite storage but also triggers serious environmental issues that threaten the sustainable development of society. Metal-air batteries, such as Zn-air batteries (ZABs) with high theoretical energy density (1086 Wh/kg), are considered sustainable, ecofriendly, and low-cost alternatives to fossil energies [1-3]. Nevertheless, the sluggish reaction kinetics of the oxygen reduction reaction (ORR) at the air cathode of ZABs severely limits their practical applications [4]. Currently, Pt-based catalysts are regarded as state-of-the-art ORR catalysts but suffer from severe problems associated with rare resources, high cost, and vulnerable durability [5]. Therefore, exploring nonprecious metal catalysts with outstanding catalytic activity and stability as well as cost-effectiveness is highly desired.
Nonprecious metal-based catalysts and heteroatom (such as N, B, S, or F)-doped carbon materials [6-9] have been widely studied as potential candidates for replacing Pt-based catalysts and exhibited high catalytic activity, long-term durability, and excellent antipoisoning properties [10]. For heteroatom-doped carbons, the higher electronegativity of heteroatoms relative to carbon atoms leads to electron modulation surrounding the carbon atoms, which alters the charge distribution, electronic properties and chemical activity of doped carbons [11-14]. The doping of N has been extensively studied due to its high electronegativity of 3.04, which can induce the charge redistribution of adjacent carbon atoms and create new catalytic sites that favor the adsorption of O2, thereby enhancing the ORR activity of the electrocatalysts [15-17]. It has been reported that pyridinic-N can increase the onset potential and graphitic-N can enhance the electrocatalytic activity [18]. Among all the heteroatoms, F has the largest electronegativity of 4.0, which can maximally regulate the charge distribution on carbon atoms adjacent to F atoms, resulting in the formation of C-F bonds (including ionic C-F, semi-ionic C-F and covalent C-F bonds) [19]. It has been reported that F atoms bonded to ionic and semi-ionic C atoms can act as electron acceptors to promote charge transfer between F and C atoms, resulting in higher conductivity and modification of the electronic properties of pristine carbons [20,21]. Moreover, multi-heteroatom codoped carbon electrocatalysts show amazing catalytic performances due to synergistic effects [10,19,22-24].
In addition to heteroatom doping, nonnoble metal (such as Fe)-doped carbon materials have been studied as promising candidates for the ORR [25]. Fe-based nanoparticles such as Fe, Fe3C and FeNx embedded in N-doped carbons have been reported to demonstrate outstanding electrochemical performance toward the ORR in terms of activity and stability [26-28]. More importantly, the presence of transition metals can facilitate the growth of carbon nanotubes (CNTs). CNTs contribute to the electrical conductivity, mechanical properties and chemical stability of the materials and facilitate electron transfer within the carbon layer during the electrocatalytic process [29,30]. Furthermore, doping CNTs can prevent the stacking/aggregation of graphite under high-temperature annealing conditions, thereby enlarging the specific surface area and exposing more active sites for the ORR. In summary, multi-doped CNTs are expected to exhibit enhanced electrochemical performances. Although heteroatom-doped nanocarbons [31] and metal-doped carbons (such as carbon materials decorated with iron carbide or iron nitride) [32-34] have been largely reported, they are not nanotube structures, therefore, the fabrication of multi-doped carbon nanotubes remains an important challenge, and their electrochemical behavior is rarely studied.
Herein, to take full advantage of the co-doping of heteroatoms and nonnoble metals, we fabricated a novel Fe/N/F-tridoped CNTs (FeNFCs) by pyrolyzing the postsynthesized F-Fe-MIL-88B-NH2 nanocrystals and melamine favoring CNT formation. The results show that the pyrolysis temperature plays a key role in the formation of CNTs and the type of F species. FeNFC800 obtained at 800 ℃ shows a CNT morphology with a specific surface area of 519.41 m2/g, in which the F dopant is dominated by semi-ionic C-F bonds. FeNFC800 exhibits a high half-wave potential (E1/2) of 0.829 V vs. RHE, substantially long durability and strong resistance to CH3OH poisoning. Zn–air batteries assembled based on FeNFC800 deliver a higher power density of 196 mW/cm2, superior to that of the benchmark 20% Pt/C (140 mW/cm2). This work not only provides an efficient electrocatalyst for the ORR but also demonstrates a new approach for fabricating multiple-doped CNT.
The synthesis procedure of the FeNFC catalysts is displayed in Scheme 1. Fe-MIL-88B-NH2 nanocrystals were first synthesized by following previously described procedures (see the Experimental section for detailed synthesis procedures in Supporting information) [35]. Trifluoroacetic anhydride was then added to a CHCl3 solution of Fe-MIL-88B-NH2 to obtain F-doped Fe-MIL-88B-NH2 (F-Fe-MIL-88B-NH2) by the nucleophilic reaction of anhydride with the amino groups of Fe-MIL-88B-NH2. Afterward, F-Fe-MIL-88B-NH2 physically mixed with melamine was annealed at 700, 800 and 900 ℃ for 2 h in a N2 atmosphere, and then the obtained products were washed with 1 mol/L HCl for 12 h to remove the soluble substance. The finally obtained samples were named FeNFC700, FeNFC800 and FeNFC900, respectively (Scheme 1). The melamine addition favored the formation of CNTs and induced sufficient N-species, which can promote the conductivity of the catalyst and provide crucial active sites for the ORR [36]. Trifluoroacetic anhydride addition was used to introduce F species that are useful for the ORR [37].
The morphology of the prepared samples was first characterized by scanning electron microscopy (SEM). As shown in Figs. 1a and b, shuttle-shaped structures of Fe-MIL-88B-NH2 and F-Fe-MIL-88B-NH2 were observed. The XRD patterns of Fe-MIL-88B-NH2 corresponds exactly to the simulated XRD patterns (Fig. S1 in Supporting information), indicating the successful synthesis of Fe-MIL-88B-NH2 nanocrystals. Compared to Fe-MIL-88B-NH2, most diffraction peaks of F-Fe-MIL-88B-NH2 slightly shifted to a lower position, indicative of lattice expansion due to the decoration of trifluoroacetic anhydride in the Fe-MIL-88B-NH2 lattices. The presence of new peaks at 2θ = 12.0°, 23.3° and 24° and the absence of a peak at 2θ = 13.0° indicate that the addition of trifluoroacetic anhydride affects the crystal structure of Fe-MIL-88B-NH2. After heat treatment of a mixture of F-Fe-MIL-88B-NH2 and melamine, a structural evolution from an amorphous carbon to carbon tube-dominated carbon was observed with increasing temperature (Figs. 1c-e). For instance, FeNFC700 shows an irregular morphology (Fig. 1c) rather than a uniform shuttle-shaped structure. In contrast, FeNFC800 and FeNFC900 exhibit carbon nanotube (CNT) hybrid structures, but FeNFC900 has relatively few CNTs (Figs. 1d and e). This morphology transformation confirmed the crucial effects of pyrolysis temperature on the resulting FeNFCs.
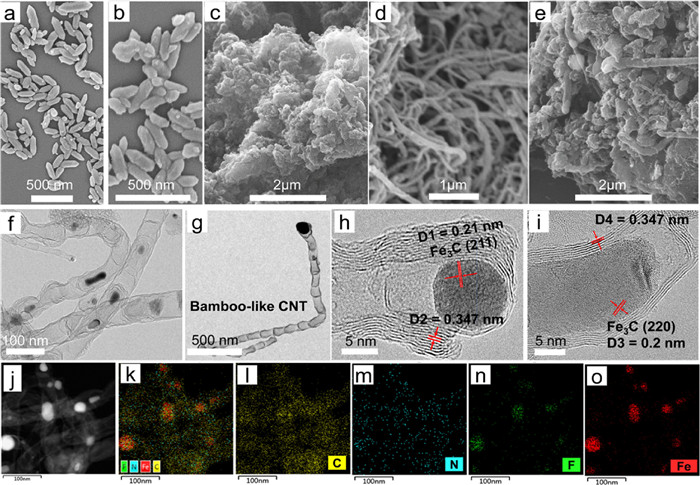
Transmission electron microscopy (TEM) was carried out to reveal detailed structural information about FeNFCs. FeNFC700 displays an amorphous carbon substrate with embedded particles. FeNFC900 has very few bamboo-shaped CNTs accompanied by amorphous carbons (Fig. S2 in Supporting information). FeNFC800 showed a large number of bamboo-shaped CNTs (Figs. 2f and g), which is consistent with the SEM results. Additionally, clearly defined lattice fringes can be resolved from the spherical Fe3C nanoparticles at the end and joint of the bamboo-shaped CNTs (high-resolution TEM images in Figs. 1h and i), featuring two interplanar spacings of 0.21 and 0.2 nm corresponding to the (211) and (220) crystal planes of Fe3C, respectively. The growth of bamboo-shaped CNTs could be ascribed to the rearrangement of supersaturated carbon atoms precipitated on Fe3C particles [38-40], and the elongation/contraction reshaping of Fe3C particles leaves a special surface curvature and thus triggers the typical bamboo-like joints [41]. CNT has a graphite layer spacing of 0.347 nm, referring to the (002) lattice plane of graphitic carbon (Figs. 1h and i).
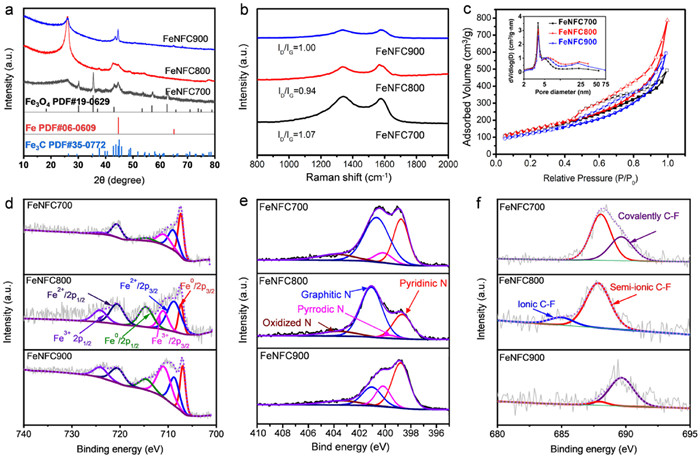
High-angle annular dark-field scanning transmission electron microscopy (HAADF-STEM) images and corresponding elemental mapping showed that bright nanoparticles on the end and in the middle of CNTs (Fig. 1j) were Fe. The C and N elements are uniformly distributed on carbon nanotubes (Figs. 1k-m), and the F element is more concentrated on Fe, indicative of the strong interaction between Fe and F (Figs. 1n and o). The evolution of Fe species with annealing temperatures was identified with X-ray diffraction (XRD). From the XRD results in Fig. 2a, FeNFC700 showed characteristic peaks of Fe3O4 that do not catalyze CNT growth. FeNFC800 showed diffraction peaks centered at 42.9° and 44.5°, corresponding to the (211) and (220) facets of Fe3C (PDF#35–0772). FeNFC900 showed typical metallic iron diffraction peaks. Such transformation from Fe3O4 and Fe3C to Fe with elevated temperature indicated the stepwise carbon thermal reduction of iron species during pyrolysis. Meanwhile, all three samples showed peaks at approximately 26° and 43.6°, corresponding to the diffraction peaks of the (002) and (101) crystal planes of graphite carbon (Fig. 2a) [42]. FeNFC800 displayed a sharp and intense peak at 26°, indicative of the enhanced graphitization degree compared to others, which can be attributed to the presence of highly graphitic CNTs. In addition, FeNFC800 showed diffraction peaks centered at 43.0°, 48.0° and 54°, corresponding to the (102), (022) and (202) facets of Fe3C (PDF#35–0772). As described above, Fe3C plays a crucial role in the growth of bamboo-shaped carbon nanotubes, which could affect the ORR catalytic performance of the as-prepared FeNFCs.
Raman spectra were obtained to evaluate the graphitization and verify the surface defect level of FeNFCs. FeNFCs showed characteristic D bands at ~1360 cm−1 induced by disordered carbon and G bands at ~1580 cm−1 induced by graphitic carbon (Fig. 2b) [43]. Compared to FeNFC700 (ID/IG = 1.07) and FeNFC900 (ID/IG = 1.00), FeNFC800 has the lowest ID/IG value (0.94), indicative of a lower defect level and higher graphitization of FeNFC800. This enhanced graphitization and lower defect degree of FeNFC800 may be attributed to the generated CNT structures and is beneficial to electron transfer in the electrocatalytic process.
In addition to the graphitization and defect degree, which affect the electronic transfer, the texture properties and pore structures associated with mass transfer were analyzed by N2 adsorption-desorption isotherms. As displayed in Fig. 2c, FeNFCs exhibited type-Ⅳ isotherms with a hysteresis loop (P/P0 = 0.45–1.0), suggesting mesoporous structures [44]. According to the multipoint Brunauer–Emmett–Teller (BET) method, the calculated specific surface area (SSA) of FeNFC800 is 519.41 m2/g, which is higher than those of FeNFC700 (507.17 m2/g) and FeNFC900 (438.22 m2/g) (Table S1 in Supporting information). The pore size distribution of FeNFC800 is mainly concentrated at ~3.9 nm based on the BJH model, and the median pore width calculated with the Horvath-Kawazoe method is 0.75 nm. More pore information of the prepared samples can be found in Table S1. It can be speculated that mesopore-dominant structures coupled with a high specific area will contribute to accelerating the ORR process by providing spacious accessible environments for fast mass transport (such as O2 penetration) and abundant active sites for O2 activation.
Further structural details (for example, element composition and valence states) of the samples were obtained from XPS measurements. It can be seen from the full spectra that elements including C, N, O, F and Fe were detected (Fig. S3 in Supporting information), suggesting the successful doping of Fe, N and F in FeNFCs. Fig. 2d shows the deconvoluted Fe 2p spectra for FeNFCs, including Fe0 2p3/2 (706.85 eV) [45], Fe2+ 2p3/2 (709 eV) [46], Fe3+ 2p3/2 (711 eV) [47], Fe2+ 2p1/2 (714.44 eV) [48], Fe0 2p1/2 (720.9 eV) [49] and Fe3+ 2p1/2 (724 eV) [46,47]. The N 1s high-resolution spectra of FeNFCs have four separated peaks at 398.2, 400.5, 401.3 and 403.8 eV, corresponding to pyridinic, pyrrolic N, graphitic N and oxidized-N, respectively (Fig. 2e) [50-52]. FeNFC800 has the highest graphitic N and pyridinic-N contents compared to the other samples (Fig. S4, Table S2 and S3 in Supporting information). It is well known that graphitic N and pyridinic-N can facilitate electron transfer by optimizing the local electronic structures of the carbon matrix and act as active sites for the ORR, which is beneficial for enhancing ORR performance [53,54].
The F element with the strongest electronegativity can greatly modulate the electronic structure of the carbon matrix, thus favoring the ORR process [20]. Interestingly, the high-resolution F 1s spectra of FeNFCs are different from each other (Fig. 2f). FeNFC700 and FeNFC900 are deconvoluted into semi-ionic C-F bonds (688.0 eV) and covalent C-F bonds (689.7 eV) [55], with semi-ionic C-F dominant in FeNFC700 and covalent C-F dominant in FeNFC900. FeNFC800 is split into ionic C-F bonds (684.8 eV) and semi-ionic C-F bonds (688.0 eV) [22]. Notably, ionic C-F is only observed in FeNFC800, while covalent C-F is detected in FeNFC700 and FeNFC900. Semi-ionic C-F is observed in the three samples, but it is very low in FeNFC900. Therefore, it can be concluded that the F species is sensitive to the annealing temperatures. As previously reported, the contribution of F species to ORR performance was in the order of ionic C-F > semi-ionic C-F > covalent C-F [56]; thus, different C-F species of the FeNFCs may affect the ORR catalytic performances.
Due to the unique structural properties and multielement doping, FeNFCs are expected to be advantageous for the ORR. The FeNFC catalysts were explored on a rotating disk electrode (RDE) in N2/O2-saturated 0.1 mol/L KOH solution. The four-electron ORR pathway under alkaline conditions can be represented by:
|
|
(1) |
|
|
(2) |
|
|
(3) |
|
|
(4) |
in which * represents an active site, and OOH*, O*, and OH* are the adsorbed intermediates. As shown in Fig. 3a, cyclic voltammograms (CVs, tested at a scan rate of 10 mV/s) of FeNFCs displayed remarkable oxygen reductions. Additionally, the linear scan voltammogram (LSV) curves were measured at a rotation rate of 1600 rpm and are plotted in Fig. 3b. FeNFC800 exhibits high activity with an onset potential (Eonset) of 0.953 V vs. RHE and half-wave potential (E1/2) of 0.829 V vs. RHE, which are more positive than those of FeNFC700 (Eonset = 0.917 V and E1/2 = 0.779 V vs. RHE) and FeNFC900 (Eonset = 0.93 V and E1/2 = 0.824 V vs. RHE) and comparable to the commercial 20 wt% Pt/C (Eonset = 0.946 V and E1/2 = 0.824 V vs. RHE, respectively), suggesting the superior ORR activity of FeNFC800 (Fig. 3c). Moreover, the ORR catalytic performance of FeNFC800 is better than many reported doped- and nonprecious metal carbon catalysts (Table S4 in Supporting information).
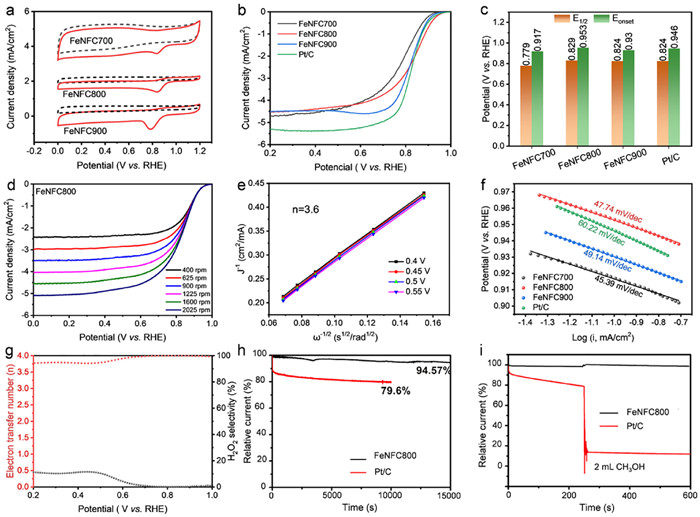
To gain insight into the reaction kinetics, rotating ring-disk electrode (RRDE) measurements with rotating speeds ranging from 400 rpm to 2025 rpm were carried out. As shown in Fig. 3d, the LSV curves of FeNFC800 display relatively wide current plateaus below 0.6 V, indicating a diffusion-controlled process. The Koutecky−Levich (K-L) plots for FeNFC800 calculated from the LSV polarization curves at different rotation speeds (Fig. 3e) showed nearly parallel fitting lines, demonstrating potential-independent electron transfer rate and first-order reaction kinetics associated with the O2 concentration. The electron transfer number (n) is calculated to be 3.6 according to the K-L plots (Fig. 3e), indicative of the four-electron ORR pathway. Furthermore, FeNFC700, FeNFC800 and FeNFC900 show Tafel slope values of 45.39, 47.74 and 49.14 mV/dec, respectively, which are lower than that of Pt/C (60.22 mV/dec), suggesting the fast reaction kinetics of FeNFCs. In addition, FeNFC800 exhibits a very low yield of the two-electron product H2O2 (Fig. 3g), and the electron transfer number (n) is measured to be 3.75–4.0 with a corresponding peroxide yield of 0–13% between 0.2 V and 1 V vs. RHE, further confirming the 4-electron dominant process. In contrast, based on the LSV curves of FeNFC700 and FeNFC900, the corresponding n values are calculated to be 3.3 and 3.0, respectively, indicative of the ORR catalytic performance of FeNFC700 and FeNFC900 being inferior to that of FeNFC800 (Fig. S5 in Supporting information).
Long-term stability and methanol tolerance are important factors for practical ORR applications. The durability of FeNFC800 and commercial 20% Pt/C was evaluated through current-time (i-t) chronoamperometric measurements at 0.6 V vs. RHE in O2-saturated 0.1 mol/L KOH at a rotation rate of 1600 rpm. As shown in Fig. 3h, FeNFC800 reveals better durability with a current retention of 94.6% after testing for 15000 s, while the Pt/C catalyst degraded to 79.6% after 10000 s. The methanol tolerance experiments for FeNFC800 and 20% Pt/C were measured in O2-saturated 0.1 mol/L KOH with the addition of 2 mL methanol into the electrolytes. As depicted in Fig. 3i, a sharp drop in current density occurred for Pt/C after methanol injection, while the current density of FeNFC800 remained, demonstrating the excellent tolerance to methanol.
To highlight the contributions of F and N dopants to the ORR performance, control experiments were designed and conducted. According to the preparation procedure of FeNFC800, FeFC800 was prepared without melamine addition, and FeNC800 was prepared without trifluoroacetic anhydride addition (see Experimental section in Supporting information). FeFC800 shows a non-CNTs amorphous structure, and FeNC800 shows an amorphous structure with very few CNTs (Fig. S6 in Supporting information), which indicates that melamine addition and trifluoroacetic anhydride decoration during sample synthesis are important to the formation of CNTs. The XRD and Raman results of FeFC800 further confirmed the amorphous structure (Figs. S7a and b in Supporting information). The strong peak at 26° in the XRD patterns of FeNC800 andFeNFC800 indicated that the introduction of melamine during sample synthesis greatly enhanced the graphitization. Consistent results were obtained from the Raman spectra, in which FeNC800 and FeNFC800 show lower ID/IG values of 0.90 and 0.94, respectively, than FeFC800 (ID/IG = 1.00) (Fig. S7b). Due to the non-CNT structures, FeFC800 and FeNC800 have lower specific surface areas (Figs. S7c and d, Table S1 in Supporting information) than FeNFC800. XPS measurement of FeFC800 confirmed the presence of F, which is mainly in the form of covalent C-F and ionic C-F (Fig. S8 in Supporting information), further confirming that 800℃ is favorable for ionic C-F formation. However, covalent C-F bonds are not observed in FeNFC800, indicating that the F species is also influenced by the melamine addition in the sample synthesis. XPS of FeNC800 confirmed the presence of pyridinic N, pyrrolic N, graphitic N and oxidized-N (Fig. S9 and Table S3 in Supporting information), similar to FeNFC800, suggesting that the N species was not affected by trifluoroacetic anhydride.
The ORR performances of FeFC800 and FeNC800 were first studied by CV (Fig. S10a in Supporting information). The onset and half-wave potentials for FeFC800 and FeNC800 are 0.880/0.765 and 0.861/0.735 V vs. RHE, respectively, which are much lower than those of FeNFC800 (0.953/0.829 V vs. RHE) (Figs. S10b and c in Supporting information), showing the significant contributions of N and F elements to the ORR performance. Given the similar F contents of FeFC800 and FeNFC800, the low ORR activity of FeFC800 can be attributed to the low content of N species (Tables S2 and S3). Although the FeNC800 sample has a higher N content than FeNFC800, the E1/2 (0.735 V vs. RHE) is the lowest among the five samples, suggesting a more significant contribution of F to the ORR performance. The Tafel slopes of FeFC800 and FeNC800 are calculated to be 37.05 and 57.65 mV/dec, respectively (Fig. S9d), which are lower than that of Pt/C (60.22 in Fig. 3c). The electron transfer number is calculated to be 3.3 for FeFC800 and 3.1 for FeNC800, which is lower than that of FeNFC800 (3.6), indicative of the inferior ORR performance to FeNFC800. Thus, the prominent ORR catalytic performance of FeNFC800 is suggested to come from the unique Fe-induced bamboo-shaped carbon nanotube structure and the compositional features of the catalyst, including rational N and F doping.
FeNFC800 shows a more positive half-wave potential of 0.829 V vs. RHE compared with FeFC800 and FeNC800, revealing that the N and F dopants enhanced the activity toward the ORR due to the amelioration electronegativity of carbon [23,57]. In addition, Fe ions were reduced at high temperatures, forming Fe3C ORR active sites [58]. The decent performance of FeNFC800 can be ascribed to the synergistic effects of multiple factors. The above control experiments confirmed that the doping of N and F is beneficial to catalyzing ORR. The graphitic N, pyridinic N, and F doping are conducive to the electrochemical ORR [19,56,59]. FeNFC800 has the highest graphitic N and pyridinic-N contents, and the largest specific surface area, ensuring more active sites exposure during the electrochemical ORR reaction. Moreover, the ionic C-F bond is considered to be the most active for ORR among ionic/semi-ionic/covalent C-F [56], leading to higher electrocatalytic activity towards ORR and better ORR performance of FeNFC800.
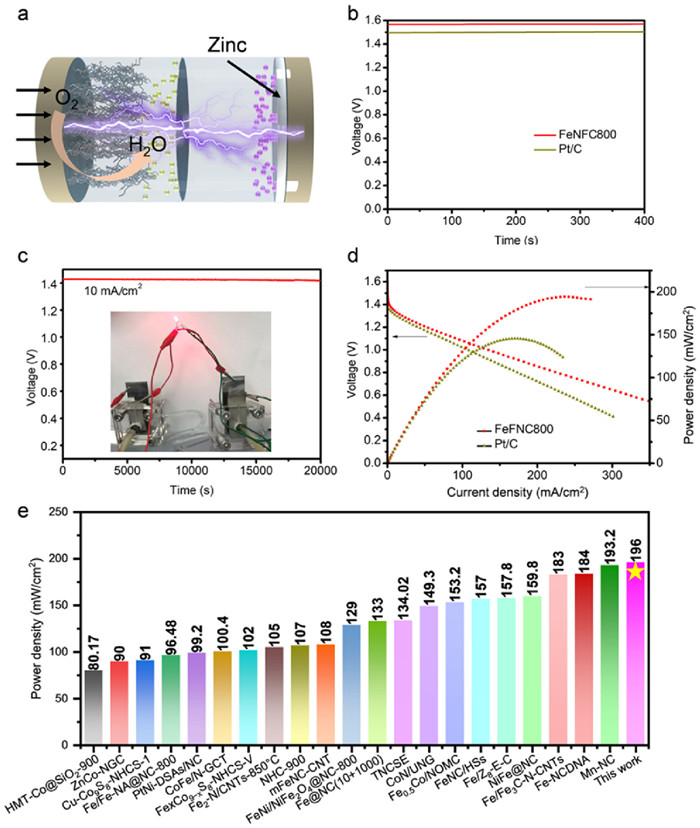
Inspired by the superior ORR catalytic performance, the practical application of the as-prepared FeNFC800 for Zn-air batteries was also studied. Fig. 4a displays a schematic illustration of a homemade Zn-air battery (ZAB), which is assembled by using the FeNFC800 catalyst (loading mass = 1 mg/cm2) on the gas diffusion layer as the air cathode, a Zn plate as the anode (Zn metal has been widely used in batteries [60], [61], [62]), and 6 mol/L KOH solution as the electrolyte. The noble metal benchmark pair (20% Pt/C) was employed as a control catalyst in the same Zn-air battery assembly. The FeNFC800-constructed ZAB delivers an open circuit voltage (OCV) of 1.56 V, outperforming the 20% Pt/C catalyst (1.47 V) (Fig. 4b), indicating the higher cell potential and the enhanced ability of FeNFC800 to drive electrical appliances. The galvanostatic discharge curve of the FeNFC800 catalyst is retained after 20000 s of operation, suggesting the potential of FeNFC800 in practical applications (Fig. 4c). Two of the connected ZAB devices can be used to drive a red light-emitting diode (Fig. 4c). Moreover, Fig. 4d shows the polarization discharge curves and the corresponding power density curves of the ZAB based on the FeNFC800 and Pt/C catalysts. The maximum power density of the FeNFC800-based ZAB is evaluated to be as high as 196 mW/cm2, which is much better than that of the commercial Pt/C catalyst (140 mW/cm2), further demonstrating that the FeNFC800 catalyst is a promising substitute for the traditional Pt/C in practical applications. Furthermore, the power density of the FeNFC800-based ZAB is much better than many reported works (Fig. 4e) [63-84], which exhibits great potential in actual applications as an energy source.
In summary, Fe/N/F-tridoped carbon nanotubes were rationally designed and prepared by annealing physically mixed trifluoroacetic anhydride-decorated Fe-MIL-88B-NH2 nanocrystals and melamine in an Ar atmosphere at 800 ℃. The characterization results show that the obtained FeNFC800 has a CNT-dominated structure with a large specific surface area, a high content of pyridinic/graphitic nitrogen, ionic/semi-ionic C-F bonds, and Fe3C species. This unique structure enables the FeNFC800 catalyst to outperform the benchmark 20% Pt/C in ORR performances by showing higher E1/2 and Eonset, stronger methanol tolerance and better long-term durability. More importantly, the FeNFC800-based Zn–air battery exhibits a much higher power density (196 mW/cm2) than 20% Pt/C (140 mW/cm2). The present study not only provides a promising electrocatalyst for the ORR in metal-air batteries but also highlights the crucial effects of Fe, N and F on the ORR performance.
The authors declare that they have no known competing financial interests or personal relationships that could have appeared to influence the work reported in this paper.
We acknowledge the financial supports from National Natural Science Foundation of China (Nos. 21971077, 22071070), the facility support of the Center for Nanoscale Characterization & Devices (CNCD), WNLO of HUST, and the Analytical and Testing Center in Huazhong University of Science and Technology for all related measurements.
Supplementary material associated with this article can be found, in the online version, at doi:
X. Zheng, N. Mohammadi, A.M. Zuria, M. Mohamedi, ACS Appl. Mater. Interfaces 13 (2021) 61374–61385. doi: 10.1021/acsami.1c22371
Z. Wang, J. Ang, J. Liu, et al., Appl. Catal. B 263 (2020) 118344. doi: 10.1016/j.apcatb.2019.118344
S. Zhao, L. Ban, J. Zhang, et al., Chem. Eng. J. 409 (2021) 128171. doi: 10.1016/j.cej.2020.128171
F. Fan, H. Zhou, R. Yan, et al., ACS Appl. Mater. Interfaces 13 (2021) 41609–41618. doi: 10.1021/acsami.1c10510
V. Jose, J.M.V. Nsanzimana, H. Hu, et al., Adv. Energy Mater. 11 (2021) 2100157. doi: 10.1002/aenm.202100157
P. Wei, X. Li, Z. He, et al., Chem. Eng. J. 422 (2021) 130134. doi: 10.1016/j.cej.2021.130134
L. Jiang, B. van Dijk, L. Wu, et al., ACS Catal. (2021) 173–182.
S. Bhattacharyya, B. Konkena, K. Jayaramulu, W. Schuhmann, T.K. Maji, J. Mater. Chem. A 5 (2017) 13573–13580. doi: 10.1039/C7TA00281E
X. Zhang, S. Yao, P. Chen, et al., J. Catal. 389 (2020) 677–689. doi: 10.1016/j.jcat.2020.07.003
K. Meng, Q. Liu, Y. Huang, Y. Wang, J. Mater. Chem. A 3 (2015) 6873–6877. doi: 10.1039/C4TA06500J
X. Feng, Y. Bai, M. Liu, et al., Energy Environ. Sci. 14 (2021) 2036–2089. doi: 10.1039/d1ee00166c
R.A. Nistor, D.M. Newns, G.J. Martyna, ACS Nano 5 (2011) 3096–3103. doi: 10.1021/nn200225f
D.S. Su, J. Zhang, B. Frank, et al., ChemSusChem 3 (2010) 169–180. doi: 10.1002/cssc.200900180
L. Zhao, R. He, K.T. Rim, et al., Science 333 (2011) 999–1003. doi: 10.1126/science.1208759
D. Guo, R. Shibuya, C. Akiba, et al., Science 351 (2016) 361–365. doi: 10.1126/science.aad0832
D. Gu, Y. Zhou, R. Ma, et al., Nano-Micro Lett. 10 (2017) 29.
R. Xing, T. Zhou, Y. Zhou, et al., Nano-Micro Lett. 10 (2017) 3. doi: 10.7844/kirr.2017.26.1.3
H. Wu, P.H.L. Sit, Comput. Theor. Chem. 1201 (2021) 113292. doi: 10.1016/j.comptc.2021.113292
T. Gong, R. Qi, X. Liu, H. Li, Y. Zhang, Nano-Micro Lett. 11 (2019) 9. doi: 10.1007/s40820-019-0240-x
G. Panomsuwan, N. Saito, T. Ishizaki, J. Mater. Chem. A 3 (2015) 9972–9981. doi: 10.1039/C5TA00244C
H. Zhou, Y. Peng, H.B. Wu, et al., Nano Energy 21 (2016) 80–89. doi: 10.1016/j.nanoen.2015.12.016
H.J. Zhang, X. Zhang, S. Yao, et al., J. Electrochem. Soc. 164 (2017) H1081–H1085. doi: 10.1149/2.0901714jes
M. Wu, Y. Wang, Z. Wei, et al., J. Mater. Chem. A 6 (2018) 10918–10925. doi: 10.1039/C8TA02416B
Y. Zhao, Y. Liu, Y. Chen, et al., J. Mater. Chem. A 9 (2021) 18251–18259. doi: 10.1039/d1ta05485f
M. Zhou, H.L. Wang, S. Guo, Chem. Soc. Rev. 45 (2016) 1273–1307. doi: 10.1039/C5CS00414D
H. Jiang, Y. Yao, Y. Zhu, et al., ACS Appl. Mater. Interfaces 7 (2015) 21511–21520. doi: 10.1021/acsami.5b06708
A. Kong, X. Zhu, Z. Han, et al., ACS Catal. 4 (2014) 1793–1800. doi: 10.1021/cs401257j
X. Cui, L. Gao, S. Lei, et al., Adv. Funct. Mater. 31 (2021) 2170064. doi: 10.1002/adfm.202170064
C. Li, Q. Hu, Y. Li, et al., Sci. Rep. 6 (2016) 25556. doi: 10.1038/srep25556
Y. Zhang, R. Jiang, Z. Wang, et al., J. Colloid Interface Sci. 579 (2020) 391–400. doi: 10.1016/j.jcis.2020.06.057
J.C. Li, P.X. Hou, C. Liu, Small 13 (2017) 1702002. doi: 10.1002/smll.201702002
Q. Chen, S. Chen, L. Zhao, et al., Chem. Eng. J. 431 (2022) 133961. doi: 10.1016/j.cej.2021.133961
M. Liu, Y. He, J. Zhang, Mater. Chem. Front. 5 (2021) 6559–6567. doi: 10.1039/d1qm00707f
L. Song, T. Wang, Y. Wang, et al., ACS Appl. Mater. Interfaces 9 (2017) 3713–3722. doi: 10.1021/acsami.6b14754
Y. Ou, L. Yao, Y. Li, et al., J. Colloid Interface Sci. 570 (2020) 163–172. doi: 10.1016/j.jcis.2020.02.116
A. Liu, M. Ma, X. Zhang, et al., J. Electroanal. Chem. 824 (2018) 60–66. doi: 10.1016/j.jelechem.2018.07.039
K. Niu, M. Li, X. Chen, et al., Int. J. Electrochem. Sci. 16 (2021) 210762.
Z. He, J.L. Maurice, A. Gohier, et al., Chem. Mater. 23 (2011) 5379–5387. doi: 10.1021/cm202315j
J. Meng, C. Niu, L. Xu, et al., J. Am. Chem. Soc. 139 (2017) 8212–8221. doi: 10.1021/jacs.7b01942
A.J. Page, Y. Ohta, S. Irle, K. Morokuma, Acc. Chem. Res. 43 (2010) 1375–1385. doi: 10.1021/ar100064g
S. Hofmann, R. Sharma, C. Ducati, et al., Nano Lett. 7 (2007) 602–608. doi: 10.1021/nl0624824
A. Yu, G. Ma, L. Zhu, et al., Nanoscale 13 (2021) 15973–15980. doi: 10.1039/d1nr04176b
A. Yu, G. Ma, L. Zhu, et al., Appl. Catal. B 307 (2022) 121161. doi: 10.1016/j.apcatb.2022.121161
A. Yu, G. Ma, J. Jiang, et al., Chem. Eur. J. 27 (2021) 10405–10412. doi: 10.1002/chem.202100998
S. Shang, C. Guo, K. Lan, et al., BioRes. 15 (2020) 4294–4313. doi: 10.15376/biores.15.2.4294-4313
Y. Mi, L. Wen, Z. Wang, et al., Nano Energy 30 (2016) 109–117. doi: 10.1016/j.nanoen.2016.10.001
J.S. Li, S.L. Li, Y.J. Tang, et al., Chem. Commun. 51 (2015) 2710–2713. doi: 10.1039/C4CC09062D
W. Sun, A.S. Saleemi, Z. Luo, et al., J. Appl. Phys. 122 (2017) 165101. doi: 10.1063/1.4998996
H. Zhu, Z. Zhu, J. Hao, et al., Chem. Eng. J. (2021) 133251.
J.R. Pels, F. Kapteijn, J.A. Moulijn, Q. Zhu, K.M. Thomas, Carbon 33 (1995) 1641–1653. doi: 10.1016/0008-6223(95)00154-6
X. Cui, Z. Pan, L. Zhang, H. Peng, G. Zheng, Adv. Energy Mater. 7 (2017) 1701456. doi: 10.1002/aenm.201701456
R. Liu, H. Zhang, X. Zhang, et al., RSC Adv. 7 (2017) 19181–19188. doi: 10.1039/C7RA01798G
M. Sun, X. Wu, X. Deng, et al., Mater. Lett. 220 (2018) 313–316. doi: 10.1016/j.matlet.2018.03.050
J. Zhang, Q. Li, H. Wu, et al., J. Mater. Chem. A 3 (2015) 10851–10857. doi: 10.1039/C5TA00547G
I. Palchan, M. Crespin, H. Estrade-Szwarckopf, B. Rousseau, Chem. Phys. Lett. 157 (1989) 321–327. doi: 10.1016/0009-2614(89)87255-0
S. Jiang, Y. Sun, H. Dai, et al., Nanoscale 7 (2015) 10584–10589. doi: 10.1039/C5NR01793A
S.K. Singh, K. Takeyasu, J. Nakamura, Adv. Mater. 31 (2019) 1804297. doi: 10.1002/adma.201804297
W.J. Jiang, L. Gu, L. Li, et al., J. Am. Chem. Soc. 138 (2016) 3570–3578. doi: 10.1021/jacs.6b00757
K. Gong, F. Du, Z. Xia, M. Durstock, L. Dai, Science 323 (2009) 760–764. doi: 10.1126/science.1168049
Z. Li, Z. Gong, X. Wu, et al., Chin. Chem. Lett. 33 (2022) 3936–3940. doi: 10.1016/j.cclet.2021.11.015
K. Wu, F. Ning, J. Yi, et al., J. Energy Chem. 69 (2022) 237–243. doi: 10.1016/j.jechem.2022.01.037
X. Liu, Y. Fang, P. Liang, et al., Chin. Chem. Lett. 32 (2021) 2899–2903. doi: 10.1016/j.cclet.2021.02.055
X. Deng, S. Imhanria, Y. Sun, et al., J. Environ. Chem. Eng. 10 (2022) 108052. doi: 10.1016/j.jece.2022.108052
C. Han, X. Zhang, Q. Sun, et al., Inorg. Chem. Front. 9 (2022) 2557–2567. doi: 10.1039/d2qi00394e
C. Li, Y. Wu, M. Fu, et al., ACS Appl. Energy Mater. 5 (2022) 4340–4350. doi: 10.1021/acsaem.1c03956
Q. Li, T. Zhao, C. He, et al., Electrochim. Acta 410 (2022) 139975. doi: 10.1016/j.electacta.2022.139975
K. Qin, Z. Zhu, F.X. Ma, J. Zhang, J. Electroanal. Chem. 906 (2022) 116021. doi: 10.1016/j.jelechem.2022.116021
Q. Sun, K. Zhu, X. Ji, et al., Sci. China Mater. 65 (2022) 1453–1462. doi: 10.1007/s40843-021-1933-4
B. Wang, J. Tang, X. Zhang, et al., Chem. Eng. J. 437 (2022) 135295. doi: 10.1016/j.cej.2022.135295
H. Wang, S. Su, T. Yu, et al., Appl. Surf. Sci. 596 (2022) 153522. doi: 10.1016/j.apsusc.2022.153522
L. Wang, S.Q. Guo, Z. Hu, B. Shen, W. Zhou, ChemCatChem 14 (2022) e202200063.
S. Wu, D. Deng, E. Zhang, H. Li, L. Xu, Carbon 196 (2022) 347–353. doi: 10.1016/j.carbon.2022.04.043
Y. Xie, S.J. Li, J.P. Huang, et al., J. Alloys Compd. (2022) 166076.
J. Zhang, Y. Chen, Y. Liu, X. Liu, S. Gao, Sci. China Mater. 65 (2022) 653–662. doi: 10.1007/s40843-021-1775-2
X. Zhang, J. Wang, C. Dai, et al., J. Power Sources 538 (2022) 231563. doi: 10.1016/j.jpowsour.2022.231563
X. Zhang, J. Xu, L. Wu, Mater. Today Sustain. (2022) 100180.
K. Chen, S. Ci, Q. Xu, et al., Chin. J. Catal. 41 (2020) 858–867. doi: 10.1016/S1872-2067(19)63507-2
S.J. Li, Y. Xie, B.L. Lai, et al., Chin. J. Catal. 43 (2022) 1502–1510. doi: 10.1016/S1872-2067(21)63932-3
Y.R. Lv, X.J. Zhai, S. Wang, et al., Chin. J. Catal. 42 (2021) 490–500. doi: 10.1016/S1872-2067(20)63667-1
F. Shi, X. Zhu, W. Yang, Chin. J. Catal. 41 (2020) 390–403. doi: 10.1016/S1872-2067(19)63514-X
H.L. Wei, A.D. Tan, S.Z. Hu, J.H. Piao, Z.Y. Fu, Chin. J. Catal. 42 (2021) 1451–1458. doi: 10.1016/S1872-2067(20)63752-4
L. Zong, X. Chen, S. Dou, et al., Chin. Chem. Lett. 32 (2021) 1121–1126. doi: 10.1016/j.cclet.2020.08.029
X. Deng, Z. Jiang, Y. Chen, et al., Chin. Chem. Lett. 34 (2023) 107389. doi: 10.1016/j.cclet.2022.03.112
Y. Jia, F. Zhang, Q. Liu, et al., Chin. Chem. Lett. 33 (2022) 1070–1073. doi: 10.1016/j.cclet.2021.05.052

Figure 1 SEM images of (a) Fe-MIL-88B-NH2, (b) F-Fe-MIL-88B-NH2, (c) FeNFC700, (d) FeNFC800, and (e) FeNFC900. (f, g) TEM and (h, i) HRTEM and (j) HAADF-STEM images of FeNFC800. (k) An overlay EDS element mapping image. Individual elemental mapping images of (l) C, (m) N, (n) F and (o) Fe.

Figure 2 (a) XRD, (b) Raman, and (c) N2 adsorption/desorption isotherms (inset: pore size distribution) of FeNFCs. XPS high-resolution spectrum of (d) Fe 2p, (e) N 1s and (f) F 1s of FeNFCs.

Figure 3 (a) CV curves of the as-prepared samples in N2-saturated (dashed lines) and O2-saturated (solid lines) 0.1 mol/L KOH electrolyte. (b) LSV curves of FeNFCs and Pt/C in O2-saturated 0.1 mol/L KOH electrolyte. (c) The corresponding histogram of the Eonset potential and E1/2 potential. (d) LSV curves of FeNFC800 in O2-saturated 0.1 mol/L KOH electrolyte at different rotation speeds. (e) K-L equations at different potentials. (f) Tafel slope curve of FeNFCs and Pt/C. (g) Electron transfer number and H2O2% of FeNFC800. (h) Current-time curve of FeNFC800 and Pt/C in O2-saturated 0.1 mol/L KOH solution at a rotating speed of 1600 rpm and a potential of 1.5 V vs. RHE was applied on the ring to collect the H2O2 current. (i) Current-time curve of FeNFC800 and commercial Pt/C; 2 mL methanol was added to the solution at 250 s.

Figure 4 (a) Schematic diagram of the Zn-air battery. (b) Open circuit voltage of Zn-air battery based on FeNFC800 and Pt/C. (c) Galvanostatic discharge curve of the Zn-air battery based on FeNFC800 at 10 mA/cm2, inset: Optical photograph of a red light-emitting diode driven by two FeNFC800-based ZABs connected in series. (d) Discharge polarization curves and the corresponding power density curves of the ZAB based on FeNFC800 and the Pt/C catalyst. (e) A comparison of the FeNFC800-based ZAB with the reported works.

 扫一扫看文章

扫一扫关注我们
 DownLoad:

 下载:
下载: