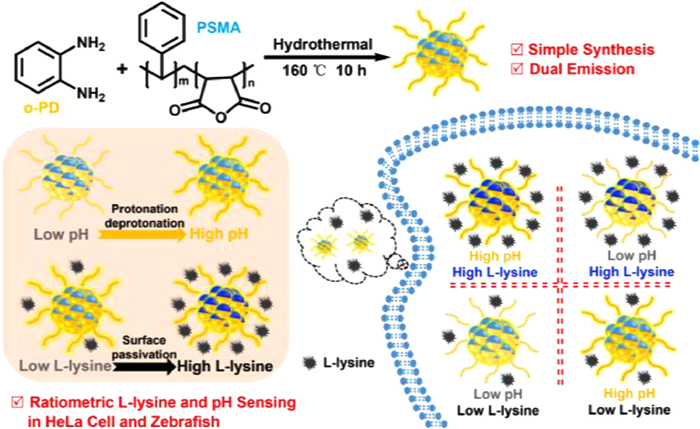
Scheme 1.
Schematic illustration of the designed CPDs for ratiometric detection of L-lysine and pH.

Biological active species such as L-lysine and pH play vital roles in maintaining various biofunctions in biological systems. The imbalance of L-lysine concentration in blood and urine is associated with some diseases and physiological/pathological process such as anemia, tumor growth, aging progression, and leukemic cell proliferation [1]. Meanwhile, the maintenance of a defined free H+ concentration within narrow limits is a prerequisite and feature of living organisms [2]. The tiny changes of intracellular pH may destroy the acid-base balance and lead to tremendous disturbance in cellular microenvironment [3]. It is highly important to selectively and accurately monitor and image intracellular L-lysine and pH for understanding the physiological and pathological processes in biological systems because they could act as the biomarkers in certain abnormal conditions and may give us a warning of the occurrence of diseases [4-6].
Fluorescence sensing and imaging techniques have shown promising advantages in monitoring biological active species in living systems because this technique enables minimal adverse effects and high temporal and spatial resolution [7-10]. To achieve in fluorescent biosensing/bioimaging of target, the exogenous fluorescent probe, which is specifically sensitive to target is generally required. Especially, ratiometric fluorescent probe, which uses the ratio of fluorescence intensities at two well-resolved independent emission peaks as the function against the target concentration, is highly desired to improve detection accuracy of sensing systems because it can effectively reduce even eliminate the effects induced by the excitation source fluctuation of fluorescence spectrophotometer, variation of local measuring environment, and the distribution of probe concentration [7, 11-19]. Furthermore, it has been attracted more focuses to develop new ratiometric fluorescent probes for identify two different targets through dual emission channels, which can provide more detection information for bioanalysis [20-22]. Up to now, different fluorescent probes such as ortho-pthaldialdehyde [23], 1-fluoro-2, 4-dinitrobenzene [24], zinc(Ⅱ) and cadmium(Ⅱ) coordination complexes [25], Zr(Ⅳ)-based MOFs (UiO-66-NH2) [26] have been reported for L-lysine detection. Various fluorescent materials including dye-doped silica nanoparticles [3-5], organic small moleculars [6], semiconducting polymers dots [7, 8] have also used for pH sensing in different pH range. In this study, it is attempted to design dual-emission ratiometric fluorescent probe for ratiometric sensing and imaging L-lysine and pH.
Carbonized polymer dots (CPDs), which possess carbon/polymer hybrid structure rather than pure carbon structure and are constituted of a carbon core and large amounts of functional groups/polymer chains on the surface due to the low carbonization degree in the prepared process, are increasingly recognized as the new member of the family of carbon dots [27-32]. The unique hybrid structure endows CPDs with the improved advantages of both polymers and quantum dots (QDs) [33-36]. For example, CPDs display increased stability compared with pristine polymers due to carbonization, and also improved compatibility compared with conventional quantum dots (QDs) due to the presence of polymer chains [37-39]. As the new form of carbon-based nanomaterials, CPDs have shown wide potentials in fluorescence sensing/bioimaging, medical diagnosis, etc. owing to their good chemical stability, excellent biocompatibility, low toxicity, allowable metabolism, superior luminescent properties, and easy chemical/biological functionalization. Especially, the presence of abundant surface groups such as oxygen-containing functional groups makes CPDs hydrophilic enough without additional changes in luminescent properties, and favorable for applications in living systems [40-46]. Xu's group developed green-emitting CPDs, which used ethanediamine and catechol as precursors by one-pot hydrothermal method, for pH detection in MCF-7 cells with three modes including colourimetric analysis, single-photon fluorescence, and two-photon fluorescence (TPF) signals. The pH sensing mechanism of this CPD is dependent on the hydrogen ion regulation on its surface states, which is evidenced for the first time by transient spectroscopy [47]. Kang et al. prepared zwitterionic groups via betanization of PEG-g-PDMA with 1, 3-propanesultone through the ring-opening reaction, and the followed by carbonization process to form pH-responsive fluorescent nanoparticles (FNP). The synthesized pH-sensitive zwitterionic FNP was used for tumor selective theranostics via pH-turn on/off fluorescence and photothermal effect in vivo and in vitro [48]. Wang's group used nylon 66 waste fibers as a precursor and glutaraldehyde as a crosslinking agent to prepare CPDs for sensing pH from 2.60 to 12.6 with a hydrothermal technique based on the cross-linking enhanced emission effect [49]. Recently, our group designed a multifunctional dual-emission CPD in blue and red regions, which employed ethylene imine polymer (PEI) and 4, 4′, 4″, 4‴-(porphine-5, 10, 15, 20-tetrayl)tetrakis(benzoic acid) (TCPP) as precursors through a one-step hydrothermal amide reaction, for ratiometric pH sensing, pH-dependent 1O2 generation for photodynamic therapy (PDT) of cancer cells, and monitoring the dynamics effects of PDT through pH-guided imaging [9]. Song et al. synthesized dual-emission carbon dots using o-phenylenediamine (oPD) as raw material with the aid of phosphoric acid by a one-pot hydrothermal carbonization method for ratiometric detection intracellular lysine and pH. A detection linear range of 0.5–260 µmol/L with a detection limit of 94 nmol/L toward lysine and pH variation between 1.5 and 5.0 were readily realized [10]. In this study, a CPDs-based ratiometric fluorescent probe was designed for L-lysine and pH sensing and imaging at two specific emission channels in live cell and zebrafish. As shown in Scheme 1, o-phenylenediamine (o-PD) and poly(styrene-co-maleic anhydride) (PSMA) are used as the precursors to synthesize the desired CPDs through one-step hydrothermal amide method. The prepared CPDs display two well-resolved fluorescence emission bands, i.e., a very weak emission centered at 470 nm in blue region and a strong emission centered at 558 nm in yellow region. It is found that the two emissions are both responsive to L-lysine, whereas, only the yellow emission is responsive to pH. Based on the different responsive behaviors, ratiometric detection and imaging of L-lysine and pH are achieved.
The morphologies and particle size of the prepared CPDs were characterized by transmission electron microscopy (TEM) and dynamic light scattering (DLS), respectively. As shown in Figs. 1a and b, the CPDs display uniformly spherical distribution with the average particle size of 57.56 nm in diameter. For comparison, the nanoparticles with single o-PD or PSMA were prepared with similar methods. The particle size distributions of the o-PD and PSMA nanoparticles are characterized by DLS and TEM (Fig. S1 in Supporting information) as 2.51 nm and 2.21 nm in diameter, respectively. The enlarged particle size of CPDs comparing with that of o-PD and PSMA nanoparticles suggests that the designed CPDs are successfully prepared through the polymerization reaction between o-PD molecules and PSMA oligomers. The crystallinity of the CPDs is analyzed by Raman spectroscopy and shown in Fig. 1c. The peak at 1522/1578 cm−1 is responsible for the G-band (ordered sp2 carbon), while the peak at 1368 cm−1 is responsible for the D-band (disorder sp3 carbon) [50]. The results from Raman spectra indicate that the prepared CPDs display a high degree of graphitization. The chemical composition of the prepared CPDs was characterized by Fourier transform infrared spectroscopy (FT-IR) and X-ray photoelectron spectroscopy (XPS), respectively. The abundant surface functional groups contained in the CPDs are shown in FT-IR spectra in Fig. 1d. The typically characteristic peaks are explained as follows. The stretching vibration at 1638 cm−1 and bending vibration at 1562 cm−1 are resulted from C=O and N—H groups, respectively, which strongly demonstrates that the CPDs were successfully prepared by the amide reaction [51]. The stretching vibration peaks at 3444 and 3427 cm−1 are attributed to N—H and O—H bonds [52]. The stretching vibration peaks at 2926 and 2856 cm−1 are responsible the saturated C—H [53]. The characteristic peak around 1500 cm−1 is attributed to the stretching vibration of C=C [54]. The peak at 1383 cm−1 is attributed to the single-bond skeleton vibration of C—C bond and the stretching vibration of C—O/C—N [55]. The peak at 1054 cm−1 is responsible for the characteristic peak of C—O—C bond [56]. The XPS spectra shown in Fig. S2 in Supporting information indicate that the three peaks at 284.7 eV, 398.7 eV and 532.1 eV are responsible for C 1s, N 1s and O 1s, respectively. It also indicates that the prepared CPDs are mainly composed of 78.06% of carbon, 7.55% of nitrogen and 14.39% of oxygen elements. The composition of the prepared CPDs is also characterized by the high-resolution X-ray photoelectron spectroscopy (HR-XPS) technique. The C 1s spectra (Fig. 1e) display four binding energies of 284.1 eV, 285.0 eV, 286.0 eV and 288.7 eV, representing C—C/C=C, C—N, C—O and C=O bonds, respectively [57]. The N 1s spectra (Fig. 1f) show three peaks of 398.5 eV, 399.5 eV and 400.5 eV, attributing to C—N—C bond, O=C—N bond and N—H group, respectively [58]. The O 1s spectra (Fig. 1g) show three peaks of 531.5 eV, 532.4 eV and 533.4 eV, corresponding to C=O, O=C—N and O=C—O groups, respectively [59].
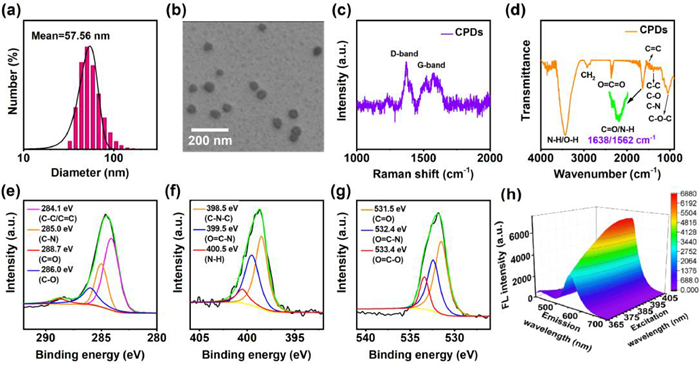
The fluorescence spectra of the prepared CPDs were also studied. As shown in Fig. 1h, it can be clearly seen from the 3D fluorescence spectra chart that the positions of the two fluorescence emission peaks, one is extremely weak and located at 470 nm while the other is strong and located at 558 nm, are independent on the excitation wavelengths, while the peak intensities are wavelength-dependent, when the CPDs are excited with different wavelengths. These observations are typical characteristics of fluorescence emission of CPDs and demonstrate that the prepared CPDs display dual-emission fluorescence at 470 nm in blue region and 558 nm in yellow region with the optimum excitation of 405 nm. In order to understand the photoluminescence mechanism of the prepared CPDs, the control experiments about the fluorescence spectra of the nanoparticles prepared from the single precursor of o-PD or PSMA were carried out. As shown in Fig. S3 (Supporting information), we can see that the nanoparticles prepared from the single precursor o-PD show same fluorescence strong emission at 558 nm (black line in Fig. S3a), while the nanoparticles prepared from non-fluorescent PSMA precursor (black line in Fig. S3b) display extremely weak fluorescence emission at 470 nm with the excitation of 405 nm. The photoluminescence behavior of CPDs is dominated by the electronic structure, which can be altered by the surface functional groups and carbon cores [26]. In this study, based on the behavior of the prepared CPDs and the results from control experiments, the strong fluorescence emission at 558 nm is may attributed to the molecule state of o-PD unit of CPDs, while weak emission at 470 nm is originated from the carbon core state of CPDs due to the carbonization of PSMA units.
The feasibility of the CPDs for sensing L-lysine and pH was investigated. As shown in Fig. 2a, in the absence of 4 mol/L L-lysine, CPDs display the intrinsic emission fluorescence at 470 and 558 nm, respectively, in pH 7.4 20 mmol/L phosphate buffer solution (red curve). Interestingly, upon 4 mmol/L L-lysine is introduced, the emission fluorescence at both 470 nm and 558 nm are increased (blue curve). The sensing mechanism of the CPDs to L-lysine is further studied through UV-vis absorption spectra (Fig. 2b), FT-IR spectra (Fig. 2c) and fluorescence lifetime (Fig. 2d). As shown in Figs. 2b and c, the UV-vis and FT-IR absorption spectra of CPDs do not show obvious change before and after the addition of L-lysine, suggesting that the presence of L-lysine does not induce the formation of new bonding interactions. The zeta potential test demonstrates that zeta potential of CPDs is decreased from −11.6 mV to −32.4 mV in the presence of L-lysine in pH 7.4 buffer solution. This result indicates that L-lysine with a pKa value of 2.16 in pH 7.4 buffer solution is negatively charged and the positive charge on CPDs can be partially shield by L-lysine due to the surface interaction between CPDs and L-lysine. Furthermore, the fluorescence lifetime of the CPDs is significantly prolonged after the addition of L-lysine from 1.79 ns (orange curve) to 4.06 ns (purple curve) in pH 7.4 buffer solution (Fig. 2d). The prolonged fluorescence lifetime suggests L-lysine molecules can passivate the surface of CPDs and therefore non-radiative processes are suppressed, leading to the fluorescence enhancement of CPDs in the presence of L-lysine. From the control experiments shown in Fig. S3, we can see that the fluorescence of o-PD nanoparticles and PSMA nanoparticles is also enhanced in the presence of L-lysine comparing with the situation without L-lysine, further suggesting that enhanced fluorescence of CPDs in the presence of L-lysine is attributed to their surface passivation. Based on the dual-emission fluorescence response of CPDs at 470 and 558 nm to L-lysine, a ratiometric turn-on sensor for L-lysine is constructed using the ratio of fluorescence intensities (I558/I470) as the function against L-lysine concentrations, as shown in Figs. 2e and f. From Fig. 2e, it is clear that the fluorescence intensities of CPDs at both 470 nm and 558 nm are gradually increased when increasing the L-lysine concentrations in pH 7.4 buffer solution. These observations suggest that the fluorescence enhancement is originated from the interaction between CPDs and L-lysine. The ratios (I558/I470) show a good linear relationship with the concentration of L-lysine from 0 µmol/L to 150 µmol/L (Fig. 2f) with the limit of detection (LOD) of 2.65 µmol/L. At the same time, the distinct colors varied from yellow to light blue under a 365 nm UV lamp can be obviously observed with the increasing concentration of L-lysine, indicating that the L-lysine variation can also be observed with the naked eye (inset of Fig. 2e). The comparison on analytical performances of the proposed sensing method in this study with the reported L-lysine detection methods is shown in Table S1 (Supporting information). From the comparision, we can see that the proposed method shows the advantages such as wide linear detection ranges, comparable detection limit, and easy preparation of CPDs.
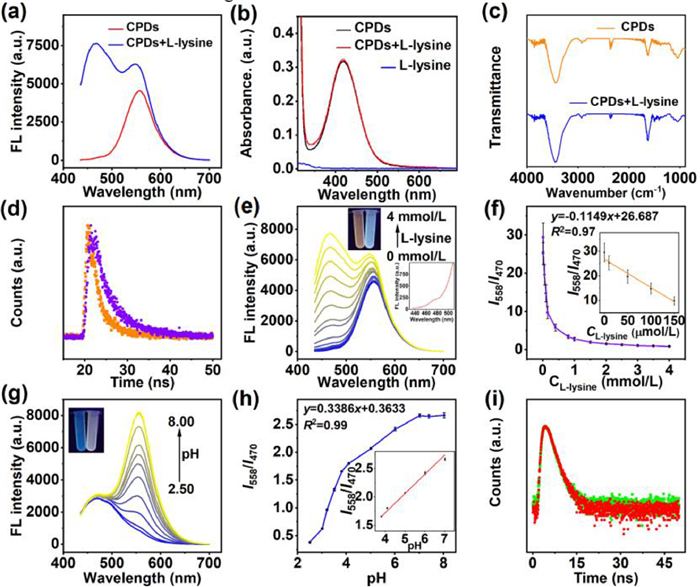
The pH sensing using the prepared CPDs as fluorescent probe is also investigated. As shown in Fig. 2g, with the pH values increased from 2.50 to 8.00, the fluorescence intensity of the CPDs is significantly increased at 558 nm in the yellow region, while the fluorescence intensity at 470 nm in the blue region is essentially unchanged. As shown in Fig. 2h, the ratios of fluorescence intensities (I558/I470) show a good linear relationship between pH at 3.81 and 7.02. At the same time, the distinct colors can be obviously observed from blue to light yellow on a 365 nm UV lamp with the increasing pH value, indicating that the changing pH can also be observed with the naked eye (inset of Fig. 2g). The pKa of the pH-sensitive CPDs is calculated to be 5.52 based on the fluorescence spectra in buffer solution with different pH values. The control experiments about the fluorescence spectra of the nanoparticles prepared from o-PD (a) and PSMA (b) in 20 mmol/L phosphate buffer solution with different pH values are shown in Fig. S4 (Supporting information). It is clear that when increasing the pH values, significant increase in the fluorescence intensity of o-PD nanoparticles (Fig. S4a), while no obvious changes in the fluorescence intensity of PSMA nanoparticles (Fig. S4b) is observed. This suggests that the response of CPDs to pH is originated from the o-PD units. The abundant amino groups on the surface of CPDs may take the protonation/deprotonation processes, which induces the disturbance of electronic state of CPDs and leads to the changes in fluorescence intensity under different pH values. The zeta potentials of CPDs at three typical pH values including 7.4, 5.0, 3.0 are measured (Table S2 in Supporting information), and the corresponding values are −11.6, −5.6, 14.2 mV, respectively, suggesting that the protonation/deprotonation processes occur with the changes of pH values. The fluorescence lifetimes of CPDs under pH 3.0 and 7.4 values were measured, respectively. As shown in Fig. 2i, we can see that the fluorescence lifetimes of CPDs do not show visible change and are about 1.60 ns. These results indicate that protonation/deprotonation processes may take place on the surface of CPDs under the ground electronic state. Based on the response behavior of CPDs to pH, a ratiometric fluorimetry for pH monitoring is developed.
The photostability of the CPDs in different pH buffer solution is investigated in vitro. As shown in Figs. S5a–c (Supporting information), the relative fluorescence intensities of the CPDs show no significant changes in continuous measurement for 3600 s in pH 3.0, 5.0 and 7.4 buffer solution, respectively, indicating that the CPDs have good photostability and capability of long-term pH monitoring. Fig. S5d (Supporting information) shows the variations in fluorescence intensities for cyclic detection between pH 3.00 and 7.40 to investigate the reversibility for pH monitoring. The result demonstrates that the fluorescence intensities show no significant changes in alternate measurement for 5 times, suggesting that the prepared CPDs display good reversibility for pH measurement. In order to investigate the biological application ability of the CPDs in living systems, the effect of ionic strength on the fluorescence of CPDs is studied. As shown in Figs. S5e and f (Supporting information), the fluorescence intensity is basically coincided with the blank value after adding a series of different concentrations of NaCl (0.001–0.5 mol/L), indicating that ionic strength displays little effect on the fluorescence of CPDs. The anti-interference ability of the CPDs is studied for sensing L-lysine and pH. As shown in Figs. S6a and d (Supporting information), in the presence of 1.5 mmol/L L-lysine, the fluorescence intensities at 470 and 558 nm are both enhanced as described above. When different potential interfering substances including metal ions, small biological molecules, amino acids are further added into the working solution, no obvious changes at 470 and 558 nm channels are observed, as shown in Fig. S6 (Supporting information). These experiments results demonstrate that the CPDs have high specificity to L-lysine and pH responsiveness at different channels and the capability to monitor L-lysine and pH in living systems.
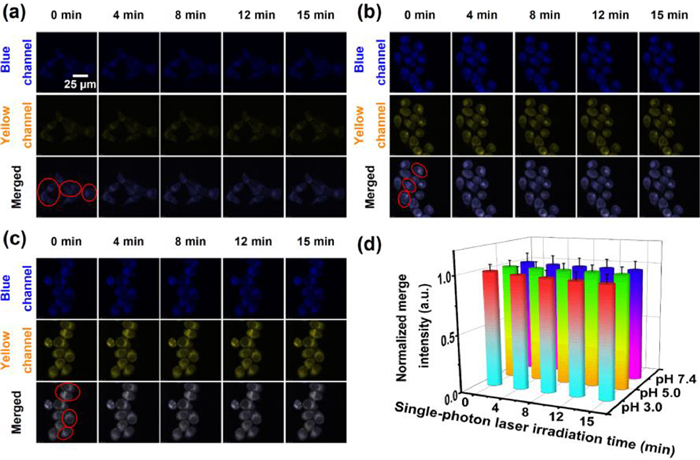
The cytotoxicity test of the CPDs in HeLa cells is investigated through the MTT assay. As shown in Fig. S7 (Supporting information), the survival rate of HeLa cells co-incubated with the CPDs at different concentrations (10–300 µg/mL) in 96-well plates for 24 h can reach over 80%, indicating that the CPDs exhibit ultra-low cytotoxicity and good biocompatibility. The intracellular photostability is one of the important indexes for the reliable application of the CPDs in living systems. As shown in Figs. 3a–c, the fluorescence intensities at 558 nm in yellow region and 470 nm in blue region show no significant fluctuations in different pH in the presence of L-lysine, when the irradiated time increases from 0 to 15 min. To further evaluate the photo-bleaching performance of the CPDs, we quantified the mean fluorescence intensity of the yellow circles in the merged channels. As shown in Fig. 3d, the 3D column chart intuitively shows no significant changes in the fluorescence intensity of merged channels. Based on above experiment results, we can see that the cells are basically undamaged and the fluorescence intensity in each channel shows no substantial fluctuation under continuous irradiation for 15 min, indicating that the prepared CPDs have excellent resistance to photo-bleaching properties and can be well applied to the long-term bioimaging.
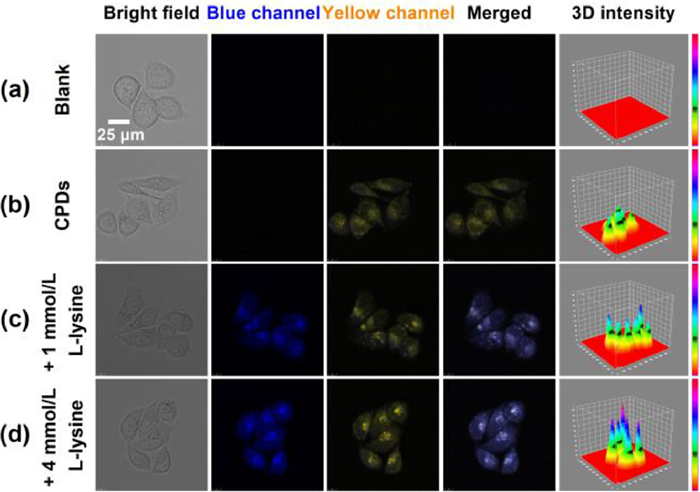
In this study, HeLa cells and zebrafish were selected as the model organisms to evaluate the feasibility of prepared CPDs in fluorescence imaging of L-lysine and pH in living systems. To verify imaging capability of the CPDs for L-lysine, HeLa cells were co-incubated in 20 mmol/L pH 7.4 phosphate buffer solution containing 47.8 µg/mL CPDs in the presence of 1.0 mmol/L, and 4.0 mmol/L L-lysine for 30 min, respectively. As shown in Fig. 4, comparing with the images shown in Figs. 4a and b, the fluorescence in yellow channel is obviously displayed, while the fluorescence in blue channel is almost not seen in the absence of L-lysine, suggesting the fluorescence is originated from the pure CPDs and is good agreement with the observations of fluorescence spectra shown in Fig. 1h. However, when 1.0 mmol/L L-lysine is introduced into the co-incubated solution, as shown in Fig. 4c, the fluorescence in blue channel is brightened, and the fluorescence in yellow channel gets brighter than that shown in Fig. 4b. Furthermore, the more L-lysine is added into co-incubated solution, the fluorescence in both blue and yellow channels becomes more brighter by comparing Fig. 4d to Fig. 4c. These results show that CPDs display favorable L-lysine imaging performances in cells.
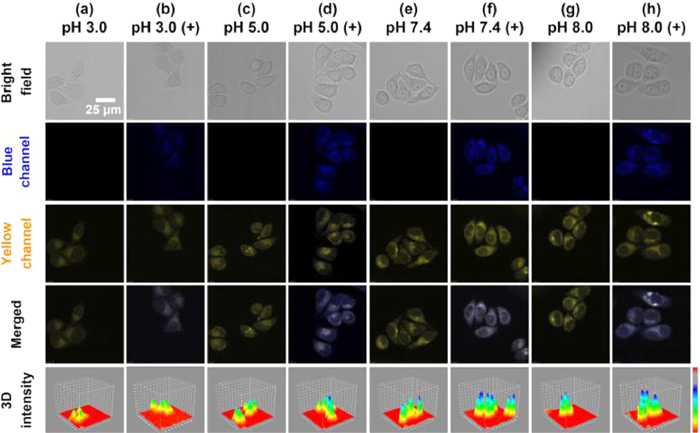
The fluorescence imaging feasibility of pH in HeLa cells using the prepared CPDs as indicators is also investigated. The HeLa cells are co-incubated in 20 mmol/L phosphate buffer with various pH values including 3.0, 5.0, 7.4 and 8.0 in the presence of 2 mmol/L L-lysine and 47.8 µg/mL CPDs for 30 min. As shown in Fig. 5, in the absence of L-lysine, the fluorescence in yellow channels is gradually brightened with increasing pH values from 3.0 to 8.0 (Figs. 5a, c, e and g), while the fluorescence in blue channels is almost not observed, which is well consistent with the spectral experiments and indicates that the pH variations in HeLa cells can be effectively monitored through the fluorescence imaging using CPDs as indicators. Furthermore, in the presence of L-lysine (Figs. 5b, d, f and h), the fluorescence in yellow channels is still obviously increased with increasing pH values from 3.0 to 8.0, while the fluorescence in blue channels is lighted, indicating that the yellow fluorescence is only responsive to pH, and the presence of L-lysine does not interfere the pH detection in cells.
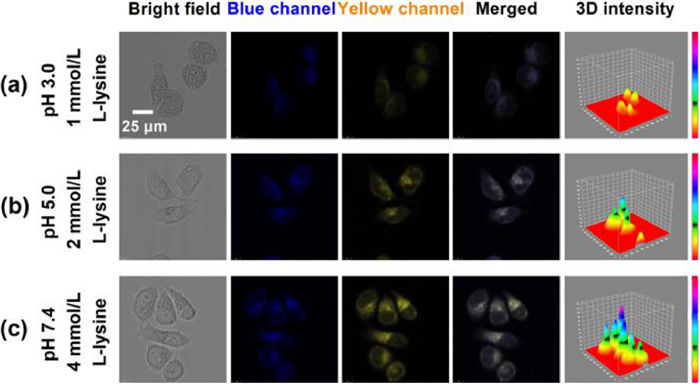
Based on the observations on the fluorescence imaging of L-lysine and pH, respectively, in HeLa cells, the CPDs show the potential to simultaneous imaging L-lysine and pH in cells as indicators. Fig. 6 shows the fluorescence images of HeLa cells co-incubated in 20 mmol/L phosphate buffer solution with various pH values (pH 3.0, 5.0, 7.4) in the presence of different concentrations of L-lysine. As shown in Fig. 6, with the L-lysine concentration and pH increased, the fluorescence intensities in blue and yellow channels are both gradually brightened, and the merged images display different brightness, suggesting that L-lysine and pH do not interfere with each other and simultaneous imaging in living cells can be achieved with the prepared CPDs.
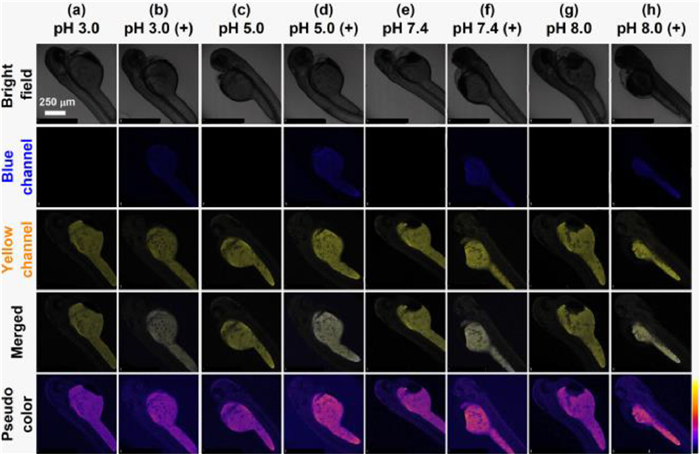
The above experimental results demonstrate that CPDs have good biocompatibility and imaging capacity in HeLa cells for monitoring L-lysine and pH. In order to further explore the ability of CPDs probe to detect L-lysine and pH in living systems, confocal imaging studies were carried out in zebrafish with 87% genetic similarity to human. The toxicity of CPDs in zebrafishes was firstly evaluated. Zebrafishes were co-incubated with CPDs of 75 and 225 µg/mL for 0.5, 1, 4, 8, 24, 48 and 72 h, respectively, to observe the survival status of zebrafishes. From the recorded videos (Supporting information), it was found that zebrafish still had a 100% survival rate in the presence of CPDs with the concentration as high as 225 µg/mL in three days. These results suggest that CPDs display low toxicity in zebrafish. As shown in Fig. 7, with the increase of pH values from 3.0 to 8.0, the fluorescence intensities of CPDs in yellow channels show an increasing trend (Figs. 7a, c, e and g) in the absence of L-lysine. When L-lysine was added into the incubated solutions, strong blue fluorescence appears in blue channels (Figs. 7b, d, f and h). The imaging results in zebrafish are consistent with those in HeLa cells, indicating that CPDs show good tissue penetration, and detection of L-lysine and pH can also be achieved in zebrafish.
In summary, dual-emission carbonized polymer dots at 470 nm in blue region and 558 nm in yellow region have been facilely prepared using o-phenylenediamine and poly(styrene-co-maleic anhydride) as precursors through one-step hydrothermal amide reaction. The prepared CPDs show independent response to L-lysine and pH based on surface passivation and protonation/deprotonation of the amino and carboxyl group, respectively. Independent detection of L-lysine and pH can be achieved using ratiometric fluorescence intensity as the function against the concentration. In addition, the CPDs display lower cytotoxicity, good biocompatibility and excellent bioimaging performances of L-lysine and pH in HeLa cells and zebrafish. In all, we believe that the desired fluorescent carbonized polymer dots can be rationally designed for sensing and imaging in living systems through the optimal choose of the precursors, which is an alternative strategy to fabricate functional fluorescent probes.
All of the animal experiments were performed in compliance with the relevant laws and guidelines issued by the Ethical Committee of Anhui Normal University.
The authors declare that they have no known competing financial interests or personal relationships that could have appeared to influence the work reported in this paper.
This work was financially supported by the National Natural Science Foundation of China (Nos. 21874001, 21575004) and the Foundation for Innovation Team of Bioanalytical Chemistry of Anhui Province.
Supplementary material associated with this article can be found, in the online version, at doi:
C.S. Pundir, B. Nohwal, R. Chaudhary, Int. J. Biol. Macromol. 186 (2021) 445–461. doi: 10.1016/j.ijbiomac.2021.07.010
J.R. Casey, S. Grinstein, J. Orlowski, Nat. Rev. Mol. Cell Biol. 11 (2010) 50–56. doi: 10.1038/nrm2820
F. Gao, L. Wang, L.J. Tang, C.Q. Zhu, Microchim. Acta 152 (2005) 131–135. doi: 10.1007/s00604-005-0418-4
F. Gao, L.J. Tang, L. Dai, L. Wang, Spectrochim. Acta A: Mol. Biomol. Spectrosc. 67 (2007) 517–521. doi: 10.1016/j.saa.2006.08.009
F. Gao, X.X. Chen, Q.Q. Ye, et al., Microchim. Acta 172 (2011) 327–333. doi: 10.1007/s00604-010-0494-y
P. Cui, X.K. Jiang, J.Y. Sun, Q. Zhang, F. Gao, Methods Appl. Fluoresc. 5 (2017) 024009. doi: 10.1088/2050-6120/aa69c7
J.Y. Sun, P.H. Ling, F. Gao, Anal. Chem. 89 (2017) 11703–11710. doi: 10.1021/acs.analchem.7b03154
Q. Zhang, J.Y. Sun, R.C. Zhang, et al., Chem. Commun. 56 (2020) 8647–8650. doi: 10.1039/D0CC01811B
X.X. Hu, Q. Zhang, X.M. Dai, J.Y. Sun, F. Gao, ACS Appl. Bio Mater. 4 (2021) 7663–7672. doi: 10.1021/acsabm.1c00892
W. Song, W.X. Duan, Y.H. Liu, et al., Anal. Chem. 89 (2017) 13626–13633. doi: 10.1021/acs.analchem.7b04211
J.Y. Sun, H. Mei, S.F. Wang, F. Gao, Anal. Chem. 88 (2016) 7372–7377. doi: 10.1021/acs.analchem.6b01929
J.Y. Sun, S.F. Wang, F. Gao, Langmuir 32 (2016) 12725–12731. doi: 10.1021/acs.langmuir.6b03002
Y.Y. Ma, Y.H. Tang, Y.P. Zhao, S.Y. Gao, W.Y. Lin, Anal. Chem. 89 (2017) 9388–9393. doi: 10.1021/acs.analchem.7b02216
W. Pan, H.H. Wang, L.M. Yang, et al., Anal. Chem. 88 (2016) 6743–6748. doi: 10.1021/acs.analchem.6b01010
Q. Zhang, X.X. Hu, X.M. Dai, et al., ACS Nano 15 (2021) 13633–13645. doi: 10.1021/acsnano.1c04581
Z.X. Liu, X. Zhou, Y. Miao, et al., Angew. Chem. Int. Ed. 56 (2017) 5812–5816. doi: 10.1002/anie.201702114
X.L. Chen, J.Y. Sun, Q. Zhang, X.K. Jiang, F. Gao, Chem. Commun. 56 (2020) 3035–3038. doi: 10.1039/C9CC08912H
J.J. He, X.K. Jiang, P.H. Ling, J.Y. Sun, F. Gao, ACS Omega 4 (2019) 8282–8289. doi: 10.1021/acsomega.9b00702
D. Cheng, Y. Pan, L. Wang, et al., J. Am. Chem. Soc. 139 (2017) 285–292. doi: 10.1021/jacs.6b10508
J.Y. Sun, N.N. Chen, X.L. Chen, Q. Zhang, F. Gao, Anal. Chem. 91 (2019) 12414–12421. doi: 10.1021/acs.analchem.9b03010
Y.Y. Han, C.Q. Ding, J. Zhou, Y. Tian, Anal. Chem. 87 (2015) 5333–5339. doi: 10.1021/acs.analchem.5b00628
J.Y. Sun, H. Mei, F. Gao, Biosens. Bioelectron. 91 (2017) 70–75. doi: 10.1016/j.bios.2016.12.034
E. Ferrer, A. Alegria, R. Farre, et al., Food Nahr. 47 (2003) 403–407. doi: 10.1002/food.200390090
M. Hikuma, M. Kawarai, Y. Tonooka, et al., Anal. Lett. 24 (1991) 2225–2236. doi: 10.1080/00032719108053047
Y.F. Shi, Y.P. Jiang, P.P. Sun, et al., Spectrochim. Acta A: Mol. Biomol. Spectrosc. 249 (2021) 119214. doi: 10.1016/j.saa.2020.119214
J. Dong, X.D. Zhang, X.F. Xie, et al., RSC Adv. 10 (2020) 37449–37455. doi: 10.1039/D0RA06879A
Y.B. Song, S.J. Zhu, S.T. Zhang, et al., J. Mater. Chem. C 23 (2015) 5976–5984.
K. Muthamma, D. Sunil, P. Shetty, App. Mater. Today 23 (2021) 101050. doi: 10.1016/j.apmt.2021.101050
S.J. Zhu, X.H. Zhao, Y.B. Song, S.Y. Lu, B. Yang, Nano Today 2 (2016) 128–132.
S.Y. Tao, T.L. Feng, C.Y. Zheng, S.J. Zhu, B. Yang, J. Phys. Chem. Lett. 17 (2019) 5182–5188.
X.H. Zhao, J. Li, D.N. Liu, et al., iScience 23 (2020) 100982. doi: 10.1016/j.isci.2020.100982
S.Y. Tao, S.J. Zhu, T.L. Feng, et al., Mater. Today Chem. 6 (2017) 13–25. doi: 10.1016/j.mtchem.2017.09.001
C.L. Xia, S.J. Zhu, T.L. Feng, M.X. Yang, B. Yang, Adv. Sci. 6 (2019) 1901316. doi: 10.1002/advs.201901316
B.E. Saji, M. Saji, N. Joseph, M. Balachandran, Biointerface Res. Appl. Chem. 12 (2022) 4662–4674.
C.Y. Kang, S.Y. Tao, F. Yang, B. Yang, Aggregate 3 (2022) e169.
F. Rigodanza, M. Burian, F. Arcudi, et al., Nat. Commun. 12 (2021) 1–9. doi: 10.1038/s41467-020-20314-w
S.Y. Tao, S.Y. Lu, Y.J. Geng, et al., Angew. Chem. Int. Ed. 57 (2018) 2393–2398. doi: 10.1002/anie.201712662
Y.B. Song, S.J. Zhu, J.R. Shao, B. Yang, J. Polym. Sci. Pol. Chem. 55 (2017) 610–615. doi: 10.1002/pola.28416
S.Y. Tao, S.Y. Lu, Y.J. Geng, et al., Angew. Chem. Int. Ed. 57 (2018) 2393–2398. doi: 10.1002/anie.201712662
W.Q. Gao, W.J. Wang, X.Y. Dong, Y. Sun, Small 16 (2020) 2002804. doi: 10.1002/smll.202002804
Y.J. Jiang, M. Lin, T. Yang, et al., J. Mater. Chem. B 7 (2019) 2074–2080. doi: 10.1039/C8TB02998A
M.X. Liu, S. Chen, N. Ding, Y.L. Yu, J.H. Wang, Chem. Commun. 56 (2020) 3050–3053. doi: 10.1039/C9CC10016D
J.H. Liu, D.Y. Li, J.H. He, et al., ACS Appl. Mater. Interfaces 12 (2020) 4815–4820. doi: 10.1021/acsami.9b18934
H. Liu, X. Geng, X. Wang, L. Wei, Z. Li, S. Lin, L. Xiao, CCS Chem. 3 (2021) 3081–3093.
Z. Ye, X. Geng, L. Wei, Z. Li, S. Lin, L. Xiao, ACS Nano 15 (2021) 934–943. doi: 10.1021/acsnano.0c07555
Z. Ye, L. Wei, X. Geng, X. Wang, Z. Li, L. Xiao, ACS Nano 13 (2019) 11593–11602. doi: 10.1021/acsnano.9b05354
Z. Huo, G. Chen, Y. Geng, et al., Nanoscale 12 (2020) 9094–9103. doi: 10.1039/D0NR01543A
E.B. Kang, J.E. Lee, Z.A.I. Mazrad, et al., Nanoscale 10 (2018) 2512–2523. doi: 10.1039/C7NR07900A
R. Wang, W. Gu, Z. Liu, et al., ACS Omega 6 (2021) 32888–32895. doi: 10.1021/acsomega.1c04808
Z.P. Huo, G. Chen, Y.J. Geng, et al., Nanoscale 12 (2020) 9094–9103. doi: 10.1039/D0NR01543A
J.J. Liu, D.W. Li, K. Zhang, et al., Small 14 (2018) 1703919. doi: 10.1002/smll.201703919
X.H. Zhao, Q.L. Tang, S.J. Zhu, et al., Nanoscale 11 (2019) 9526–9532. doi: 10.1039/C9NR01118H
C. Liu, Y.Z. Jin, R.J. Wang, et al., iScience 23 (2020) 101546. doi: 10.1016/j.isci.2020.101546
C. Dong, M.S. Xu, J.H. Huang, et al., ACS Appl. Nano Mater. 3 (2020) 10560–10564. doi: 10.1021/acsanm.0c02244
F. Li, X. Wang, W. Liu, L.Q. Wang, G.Y. Wang, Opt. Mater. 86 (2018) 79–86. doi: 10.1016/j.optmat.2018.09.040
T.L. Feng, S.J. Zhu, Q.S. Zeng, et al., ACS Appl. Mater. Interfaces 10 (2017) 12262–12277.
S.Y. Lu, L.Z. Sui, M. Wu, et al., Adv. Sci. 6 (2019) 1801192. doi: 10.1002/advs.201801192
C. Guo, Q.Q. Nie, S.Y. Xu, L.Y. Wang, Anal. Chem. 93 (2021) 13880–13885. doi: 10.1021/acs.analchem.1c02661
B. Liu, Z. Chen, B. Chu, et al., Adv. Photonics Res. 2 (2021) 2000161. doi: 10.1002/adpr.202000161

Scheme 1 Schematic illustration of the designed CPDs for ratiometric detection of L-lysine and pH.

Figure 1 The characterization of the obtained carbonized polymer dots. DLS (a), TEM image (b), Raman (c), and FT-IR (d) spectra of the CPDs. High-resolution XPS spectra of C 1s (e), N 1s (f), and O 1s (g) of the CPDs. (h) 3D fluorescence emission spectra of the CPDs with a concentration of 63.7 µg/mL under various excitation wavelengths in pH 7.4, 20 mmol/L phosphate buffer solution.

Figure 2 (a) Fluorescence spectra of CPDs in the absence (red line) and presence (blue line) of 4 mmol/L L-lysine in 20 mmol/L pH 7.4 phosphate buffer solution (PBS). (b) UV-vis absorption spectra of the CPDs in the absence (black line) and presence (red line) of 2 mmol/L L-lysine, and 2 mmol/L L-lysine (blue line) in 20 mmol/L pH 7.40 PBS. (c) FT-IR spectra of the CPDs without (orange line) and with (blue line) L-lysine. (d) Fluorescence lifetime curves at 470 nm of the CPDs in the absence (orange line) and presence (purple line) of L-lysine in 20 mmol/L pH 7.4 PBS. (e) Fluorescence spectra of the CPDs in the presence of various concentrations of L-lysine in pH 7.4 20 mmol/L PBS. The inset figure shows the enlarged curve with 0 mmol/L L-lysine. The inset photo is the corresponding color changes with 0 mmol/L and 4 mmol/L of L-lysine in pH 7.4 20 mmol/L PBS under a 365 nm UV lamp, respectively. (f) The curve of relative fluorescence intensity ratios (I558/I470) of the CPDs against the concentration of L-lysine. The inset photo is the linear relationship ranging from 0 µmol/L to 150 µmol/L of L-lysine. (g) Fluorescence spectra of the CPDs in 20 mmol/L PBS with different pH values. The inset photo is the corresponding color changes in pH 2.50 and 8.00 under a 365 nm UV lamp, respectively. (h) The curve of relative fluorescence intensity ratios (I558/I470) of the CPDs against pH values. The inset photo is the linear relationship ranging from 3.81 to 7.02 of pH values. (i) Fluorescence lifetime curve at 558 nm of the CPDs in 20 mmol/L PBS with pH 3.0 (green line) and 7.4 (red line). The concentration of the CPDs is 63.7 µg/mL for all experiments.

Figure 3 The intracellular photostability of the CPDs in 20 mmol/L phosphate buffer solution with different pH values of 3.0 (a), 5.0 (b) and 7.4 (c) in the presence of 2 mmol/L L-lysine. Dynamic fluorescence images are captured by time-sequential scanning of HeLa cells incubated in phosphate buffer solution containing 2 mmol/L L-lysine and 47.8 µg/mL CPDs. (d) The corresponding 3D column chart of the mean fluorescence intensities with red circles in merged channel of (a), (b) and (c), respectively. The red circles indicate the average fluorescence intensity of the three groups of cells at each pH. Blue channel = 440–500 nm, yellow channel = 530–590 nm, Ex = 405 nm. Scale bar = 25 µm.

Figure 4 Fluorescence images of HeLa cells co-incubated in pH 7.4 20 mmol/L phosphate buffer solution containing 47.8 µg/mL CPDs and 1 mmol/L (c) and 4 mmol/L (d) L-lysine. The 3D intensity is corresponding to the merged images which are resulted from the combined images in blue channel and yellow channel. Blue channel = 440–500 nm, yellow channel = 530–590 nm, Ex = 405 nm, Scale bar = 25 µm.

Figure 5 Fluorescence images of HeLa cells co-incubated in 20 mmol/L phosphate buffer solution with different pH values (pH 3.0, 5.0, 7.4 and 8.0) in the presence of 47.8 µg/mL CPDs in the absence (a, c, e and g) or presence (b, d, f and h) of 2 mmol/L L-lysine. The 3D intensity is corresponding to the merged images which are resulted from the combined images in blue channel and yellow channel. Blue channel = 440–500 nm, yellow channel = 530–590 nm, Ex = 405 nm, scale bar = 25 µm.

Figure 6 (a–c) Fluorescence images of the HeLa cells co-incubated in 20 mmol/L phosphate buffer solution with 47.8 µg/mL CPDs and various pH values (pH 3.0, 5.0, 7.4) in the presence of different concentrations of L-lysine. The 3D intensity is corresponding to the merged images which are resulted from the combined images in blue channel and yellow channel. Blue channel = 440–500 nm, yellow channel = 530–590 nm, Ex = 405 nm, scale bar = 25 µm.

Figure 7 Fluorescence images of 4-day-old zebrafish incubated with 47.8 µg/mL CPDs in the absence (a, c, e and g) or presence (b, d, f and h) of 2 mmol/L L-lysine in 20 mmol/L phosphate buffer solution with different pH values (pH 3.0, 5.0, 7.4 and 8.0). Blue channel = 440–500 nm, yellow channel = 530–590 nm, Ex = 405 nm. Merged images represent the combination of blue channel and yellow channel. The pseudo colors are corresponding to the merged images. Scale bar = 250 µm.

 扫一扫看文章

扫一扫关注我们
 DownLoad:
 下载:
下载: