Table 1.
Key components for assembling an ECL device.
Citation:
Shuqi Xia, Jiangfei Pan, Deshen Dai, Zong Dai, Mengsu Yang, Changqing Yi. Design of portable electrochemiluminescence sensing systems for point-of-care-testing applications[J]. Chinese Chemical Letters,
2023, 34(5): 107799.
doi:
10.1016/j.cclet.2022.107799

Design of portable electrochemiluminescence sensing systems for point-of-care-testing applications
English
Design of portable electrochemiluminescence sensing systems for point-of-care-testing applications
Abstract:
Point-of-care testing (POCT) technology is highly desirable for clinical diagnosis, healthcare monitoring, food safety inspection, and environment surveillance, because it enables rapid detection anywhere, anytime, and by anyone. Electrochemiluminescence (ECL) has been widely used in chemo-/bio analysis due to its advantages such as high sensitivity, simplicity, rapidity and easy to control, and is now attracting increasing attention for POCT applications. However, to realize the accurate on-site quantitation, it is still challenging to develop portable devices which can precisely collect, analyze, transmit and display the ECL signals. This review will focus on how to develop a portable ECL device by summarizing recent examples and analyzing their key components part by part. Then the possible solutions to the existing challenges in the development and applications of portable ECL devices are summarized and discussed in detail, followed by offering future perspectives. We attempted to provide an appealing viewpoint to inspire interested researchers to comprehend and explore portable ECL sensing systems for practical applications and even commercialization.
-
1. Introduction
The dramatically increasing needs for rapid, cost-effective, field-deployable detection which can be performed by laypersons have motivated and accelerated the development of point-of-care testing (POCT) techniques. Since POCT techniques are featured with minimized instrument size and procedures as well as the increased integration of cutting-edge information technology, they can work independently of medical infrastructures and thereafter enable rapid diagnosis anywhere, anytime, and by anyone. This is extremely important for timely clinical management decisions, which plays an important role in improving patient safety and clinical outcomes, especially during the emergence of pandemics such as COVID-19 and H1N1 flu, as well as prevalence of epidemic diseases such as Zika, dengue and malaria [1–6]. POCT represents the most advanced concept and technique of laboratory medicine around the world. With the sustained growth in vitro diagnostic (IVD) markets around the world, POCT is one of the most developed areas. According to statistics, the global POCT market was about 35.5 billion dollars in 2021 and is expected to exceed 96.0 billion dollars in 2025.
According to the reporting signals, POCT techniques can be categorized into different types, for example, photochemical, electrochemical, magnetic, acoustic [7–10]. Among all the well-established approaches, electrochemiluminescence (ECL), also known as electrogenerated chemiluminescence, has emerged as a promising reporting signal for POCT applications, since it combines the high sensitivity from chemiluminescence and strong controllability from electrochemistry. ECL refers to an approach of light emission generated by a highly energetic redox reaction on electrode surface. Due to the perfect combination of electrochemical trigger and optical readout, ECL exhibits outstanding features such as ultrafast response speed, near-zero background and excellent sensitivity, and provides a flexible sensing platform with both spatial and temporal controllability for POCT applications.
However, to realize the accurate quantitation of analytes at the points of need, it is still challenging to develop portable devices which can precisely collect, analyze, transmit and display the reporting signals. Regarding the importance of ECL in biomedical diagnosis and biochemical analysis, a comprehensive review on portable ECL sensing systems is highly appreciated. There are various good reviews covering novel luminophores and electrode design for ECL approaches as well as ECL concept and advance [11–16], but to the best of our knowledge, there is no review paper focusing on how to design a portable ECL sensing system for POCT applications. In this review, key components for assembling a portable ECL sensing system are explored in detail by summarizing and analyzing recent examples. Considering the importance of smartphones in recent development of portable quantitation systems, special attention will be put on how to develop smartphone-based portable devices for ECL signal collection and analysis. We attempted to provide an appealing viewpoint to inspire interested researchers to comprehend and explore portable ECL sensing systems for biomedical applications and future possible commercialization. At the end, challenges in the development and application of portable ECL sensing systems are summarized, and future perspectives are offered.
2. Design of portable ECL devices
To precisely collect and process ECL signals, an ECL device should contain the following key components (summarized in Table 1): (1) an electrochemical system to trigger the luminescence process; (2) an optical system to collect the luminescence; (3) a laptop computer or a smartphone installed with specific software to display, process and analyze the signals. Herein, in this section, all three key components will be analyzed part by part.
Table 1
2.1 Electrochemical system
ECL refers to a technique in which exited state molecules that emit photons (optical readout) are generated by a potential applied to electrodes (electrochemical trigger). Electrochemical systems including electrodes and excitation voltage generator, are responsible for triggering ECL signals. Specifically, electrodes on which electrochemical reactions happen, determine the sensitivity and stability of the detection. While, excitation voltage generator is responsible for outputting a voltage signal to initiate electrochemical redox reactions.
2.1.1 Electrode
To facilitate POCT applications, SPEs and ITO electrodes with different setups such as single-electrode, two-electrode, three-electrode, and bipolar-electrode electrochemical system are widely used for ECL signal generation.
SPEs are fabricated by screen-printing conductive inks such as carbon, graphite, gold, silver, platinum, and poly(3,4-ethylenedioxythiophene) (PEDOT) onto various substrates including plastic, paper or ceramic, and are the most widely used electrodes in electrochemical detection [17]. Taking advantages of screen-printing technique, electrodes can easily be manufactured with different spatial distributions on any substrate with different shapes such as discs, rings, and strips. Featured with flexible design, simple structure, good consistency, low cost, easy mass production, screen printing technique has been extensively explored to fabricate electrode systems with different setups for POCT applications in a highly reproducible and reliable manner. More importantly, the electrochemical behavior of a specific analyte can be modulated by changing the printed inks or modifying the surface of the working electrode (WE), endowing SPEs with great versatility. For example, the electron-loss process of TPrA can be substantially accelerated on TiO2 nanoneedle-modified electrode, thus promoting the reaction between Ru(bpy)2(cpaphen)2+ and TPrA as well as increasing the ECL signal [18].
Among various substrates for SPE fabrication, paper has presented itself as an appealing substrate for developing disposable sensors, because of its unique advantages such as inexpensive, foldability, low background signal, hydrophilia and capillarity [19,20]. For example, multi-step ECL immunoassays have been implemented using a rotational paper-based analytical device [21]. The device consisted of three paper discs: (1) the detection disc containing four immune-zones that screen-printed with carbon working electrodes, (2) the auxiliary disc containing four punched holes and four hydrophilic zones on the surface of which the reference electrode (RE) and counter electrode (CE) were screen-printed, and (3) the washing disc. Through rotating the auxiliary disc manually, the typical three-electrode system could be formed. Simultaneous analysis of carcinoembryonic antigen (CEA) and prostate specific antigen (PSA) has been demonstrated with a detection limit of 0.07 ng/mL and 0.03 ng/mL, respectively.
Recently, BPE-based ECL systems have attracted increasing attention for POCT applications, because of their advantages such as ease-of-use and high throughput [22]. Known as a "wireless technique", BPE is operated as a conductor immersed in a uniform electric field which is generated by two driven electrodes (DEs) linked to the power source. The redox reaction of electroactive chemicals in the solution will occur at the two ends of BPE when the electric potential difference (∆E) between the two ends of the conductor reaches a particular value [23].
According to the structure type of electrolytic cell, there are two different types of BPE, namely, open BPEs (O-BPEs) and closed BPEs (C-BPEs). O-BPE can be facilely prepared by positioning a conductor in a single electrolyte between a pair of DEs without any electric connection, while the electrolyte in contact with each pole of BPE is physically separated by an insulating substance in C-BPE setup. There are two possible pathways (namely, BPE and solution) for current to flow in O-BPE setup (Fig. 1a), but only one pathway (namely, BPE) in C-BPE setup (Fig. 1b). Therefore, for O-BPE, ΔE = Etot(LBPE/LC) [23]; for C-BPE, ΔE = Etot[(Lce+Lae)/(Lcc+Lac)] [24], where Etot is the total applied voltage across DEs, LBPE and LC are the length of the BPE and channel, Lce and Lae refer to the length of the cathode and anode of the BPE, Lcc+Lac represents the sum of the lengths of two electrolytic cells, respectively.
Figure 1
 Figure 1. Schematic diagram of (a) O-BPE, (b) C-BPE and (c) SEES.
Compared with O-BPE, C-BPE offers various advantages for biosensor development, including lower driving potential and 100% current efficiency [25]. In addition, thanks to the physically separated two half-cells, mutual interference can be avoided [26], and the ratiometric detection can be easily achieved [27–29]. In a typical spatial-resolved ratiometric ECL example, the molecularly imprinted polymer (MIP) which can specifically recognize ascorbic acid (AA) was decorated on the anode of the C-BPE, while Ru(bpy)32+ and ZnIn2S4 served as anode-emitter and cathode-emitter, respectively. Rebinding of AA at anode resulted in the increase of the ECL signal of ZnIn2S4 (440 nm) at cathode and the decrease of the ECL signal of Ru(bpy)32+ (605 nm) at anode synchronously [27]. More importantly, ECL signal can be facilely enhanced by modifying the BPE material, since the current only flows through the BPE between two half-cells [30,31]. For example, AuPd nanoparticles (AuPd NPs) catalyzed the reduction rate of H2O2 at the cathode, which indirectly accelerated the oxidation rate of Ru(bpy)32+ resulted in a low detection limit (0.67 pmol/L) of miRNA-155 [30]. However, due to the multiple solid-liquid interfaces and its own resistance, the power consumption of BPE is higher than that of traditional two-electrode and three-electrode systems.
In addition to screen printing, 3D printing technology and laser processing technology are also extensively used for BPE fabrication. For example, fused deposition modeling (FDM) printing technology has been demonstrated to fabricate BPEs using conductive graphene filament and white polylactic acid (PLA) filament [32]. In another attempt, the local heat generated by laser irradiation is used to carbonize polyimide (PI) film to fabricate laser-induced graphene BPEs via recombining carbon atoms from sp3 bond to sp2 bond and decomposing oxygen and nitrogen groups [33]. The graphene produced by this technology is featured with high porosity, high mechanical robustness, and excellent electrical and thermal conductivity.
Featured with uniform thickness, good repeatability, stability and durable, ITO electrode is another extensively used electrode for ECL applications, due to its visible light transmittance of more than 80% and sheet resistance as low as 10 Ω/sq [34]. ITO electrode is fabricated by coating a layer of indium tin oxide film on a transparent PET or glass substrate using electron beam evaporation, chemical vapor deposition, magnetron sputtering, radio frequency sputtering, and etc. [35]. Taking advantages of photolithography and wet chemical etching technique, ITO electrodes can be designed with different spatial distributions and different setups. Noteworthy, ITO electrode alone, in the absence of any other electrodes, can be used to generate ECL signals. This so-called single-electrode ECL system (SEES) was first proposed by Guobao Xu (Fig. 1c) [36]. An insulating material with holes is used to distinguish the electrolytic cell from the electrically connected parts (DEs) on both sides, and external voltage is applied between the two DEs. Due to the resistance of electrode itself and electrolyte solution, a potential difference can be created to trigger the ECL reaction [22]. As shown in Fig. 1c, the potential difference is calculated according to the equation ΔE = Etot(Lc/LDE), where Etot represents total applied external potential and Lc and LDE refer to the length of channel and DE, respectively [22,36].
Multiplexed detection is of great importance for more accurate disease diagnosis, because a single biomarker cannot fully reflect a patient's illness condition. However, the cost, the workload and error risks will significantly increase by parallelly performing multiple single-plex detection [37]. Therefore, the sensitive and high-throughput detection of multiple biomarkers in a single test can not only reduce the cost, the sample volume and the analysis time, but also contribute to better diagnostic decision making. Actually, the throughput of ECL detection can be easily improved by using the electrode array, which is the most straightforward solution. To this end, SPE, BPE and ITO electrodes are also extensively explored to develop electrode array (Figs. 2a–c). The versatility of screen-printing technique enables that SPEs with different spatial distributions can be facilely fabricated, even the electrode array. As shown in Fig. 2a, a screen-printed carbon electrode which consists of four carbon WEs, one Ag/AgCl RE, and one carbon CE, has been successfully conditioned for sensing four different analytes. The possible cross-talk between the adjacent electrodes can be eliminated by the sequential detection mode [38].
Figure 2
 Figure 2. The development of electrode arrays for high-throughput analysis. (a) SPE array. Reproduced with permission [38]. Copyright 2011, Elsevier. (b) C-BPE array. Reproduced with permission [39]. Copyright 2020, American Chemical Society. (c) ITO electrode array. Reproduced with permission [36]. Copyright 2018, Royal Chemical Society. (d) Array of ultramicro-BPEs. Reproduced with permission [44]. Copyright 2020, American Chemical Society. (e) Ultra-high-density gold microwell electrode array. Reproduced with permission [47]. Copyright 2021, Frontiers.
Because a pair of DEs can drive multiple BPEs wirelessly, high-throughput ECL detection can also be easily achieved by fabricating multiple BPEs and a pair of DEs using lithographic and wet etching technique [39–41]. In a typical example, 32 BPEs were fabricated on a glass slide and controlled wirelessly using a pair of DEs which can be functioned with only a single power supply (Fig. 2b) [39]. This C-BPE electrode array has been successfully demonstrated for real-time tracking the respiratory activities of individual MCF-7 cell aggregates by monitoring ECL signals. Obviously, the simple wiring setup makes the BPE electrode array more suitable for high-throughput detection than SPE array, because of the limitation of area for connecting electrodes.
Taking advantages of the principle of resistance induced potential difference which is proposed by Prof. Guobao Xu, ITO electrodes can be conditioned for multiplexed detection by being attached with an insulating self-adhesive plastic film with a series of holes (Fig. 2c) [36]. Each hole can serve as an independent microelectrochemical cell, and a potential difference between the two ends of the microelectrochemical cell will be generated to initiate faradaic reactions when an external voltage is applied to both ends of ITO electrode. Multiplexed ECL analysis of glucose, uric acid and H2O2 is demonstrated using this SEES. Based on the same principle, a SEES was developed by attaching a plastic sticker with multiple holes onto a single carbon ink SPE for high-throughput ECL immunoassay [42]. Obviously, it is quite simple to prepare electrode arrays based on the principle of resistance induced potential difference. However, along with the increase of the throughput, the size and resistance of the electrode will substantially increase. More unfavorably, higher voltage needs to be applied to initiate the electrochemical reaction in each microelectrochemical cell, which might result in significantly increased energy consumption, possible electrode damage and evaporation of solution in microelectrochemical cell due to the thus generated heat.
The higher the processing resolution, the smaller the electrode can be made. Therefore, the advances in micromanufacturing techniques make possible the fabrication of electrodes with increasing numbers in a limited area. For example, 4200 microelectrodes with a diameter of 4 µm and a pitch of 100 µm, have been successfully fabricated on a 6 × 6 mm2 Si wafer using a nanolithography technique. ECL detection at a single nanostructured electrode can be performed in a cell with volume of ~40 µL under an optical microscope [43]. Similarly, more than 146,522 carbon C-BPEs with a diameter of 8 µm were successfully fabricated in a 1 cm2 Si wafer, which enables that electrochemical reactions on hundreds of thousands of individual electrodes with millisecond temporal resolution can be simultaneously monitored (Fig. 2d) [44]. Besides the traditional lithography, micromanufacturing techniques such as thermal drawing process [45] and electroless plating [46] can also be used for the fabrication of C-BPE arrays.
Compared with planar electrodes, microwell electrodes are featured with high specific surface area, small volume and increased collision frequency of reactants, which can enhance the ECL signal. For example, an ultra-high-density (1.15 × 10⁶/cm2) microwell electrode array (UMEA) fabricated by Su and co-workers using micro-/nanofabrication and electroless deposition of Au, was used for ECL imaging analysis (Fig. 2e). It is believed that the superposition of diffusion fields in both radial and longitudinal directions results in the enhanced ECL generation in the confined microwells [47]. In another example, a microwell BPE array was fabricated onto optical fiber using wet-etching method to develop a remote ECL sensing platform for determining nicotinamide adenine dinucleotide (NADH). In this setup, light emission generated at the distal face of the optical fiber bundle will be detected at its proximal face [48].
2.1.2 Excitation voltage generator
To initiate the electrochemical redox reaction on electrode, excitation voltage generator which can output voltage signals is indispensable. Various commercially available electrochemical workstations such as Gamry, CHI, Princeton, and Admiral, can satisfy this requirement. However, to realize POCT applications in a more cost-effective manner, it is crucial to design and manufacture excitation voltage generators with less functionality, smaller size and lighter weight. Fortunately, various portable electrochemical workstations have been developed for electrochemical analysis, providing guidance to design excitation voltages generator for ECL applications [49–53].
Different to classical electrochemical measurements which record electrical signals fed back under electrical stimulation, ECL measurements record the emitted photons generated by an electrochemical trigger. Therefore, only portable potentiostats or even DC-DC converter circuits are sufficient to provide excitation voltages to trigger ECL reactions. In a typical example, an electronic circuit powered by a rechargeable lithium-ion battery which is mainly composed of DC-DC step-down voltage regulator chip XL4015, capacitor, zener diode, inductor coil, potentiometer, three-bit digital tube and indicator LED, is designed for voltage control (Fig. 3a) [54]. Using the designed circuit, the driving voltage from 0 V to 12.0 V can be output by adjusting the R2 potentiometer. Similarly, other DC-DC voltage regulator chips such as LM317 [55], LM2596S [56,57] have also been used in the development of voltage control circuits.
Figure 3
 Figure 3. Diagrams and images of the excitation voltage generator for portable ECL sensing devices. (a) The electronic circuit powered by a rechargeable lithium-ion battery, and (b) the smartphone-controlled potentiostat: ⅰ. Diagram of the electronic circuit; ⅱ. Photo of the PCB. (a–i) Reproduced with permission [54]. Copyright 2011, Elsevier. (a–ii) Reproduced with permission [82]. Copyright 2017, Elsevier. (b) Reproduced with permission [59]. Copyright 2021, Elsevier.
Besides battery, smartphones can also be used as a power supply to facilitate POCT applications. For example, the Universal serial bus-on the go (USB-OTG) on the smartphone has been successfully conditioned to output a fixed 5 V voltage for ECL signal generation, and the output voltage can be further adjusted from 2.0 V to 3.0 V via a voltage divider circuit [58]. In order to further improve the portability and accessibility of the portable ECL sensing platform, the NFC function of the smartphone is used to wirelessly control the output voltage of the portable potentiostat [59]. As shown in Fig. 3b, the PCB is mainly composed of a high-performance controller STM32F1 equipped with 12-bit A/D and D/A converters, a potentiostat module including an operational amplifier AD8608, a 16-bit dual voltage output digital-to-analog converter DAC8552 and an extended reference, and a power management module. The potentiostat module can realize a controllable 0-5 V voltage output for ECL signal generation, and can be wirelessly controlled by the NFC module.
2.2 Optical system
In order to collect the luminescence signals generated on the electrode in a reproducible and precise manner, it is indispensable to design an optical system that should contain the following main modules: (1) a dark box assembled with possible optical components to prevent the influence of external light and precisely collect ECL signals; (2) a photoelectric converter connected with signal processing circuits to convert optical signals into electrical signals for quantitation.
2.2.1 Dark box
External light will seriously interfere with the precise collection of ECL signal, since ECL is a weak luminescence phenomenon. Therefore, how to design and manufacture a dark box with smaller size and lighter weight is another key technical problem to be tackled. In recent years, 3D printing has presented itself as a robust tool for the manufacture of various analytical devices. Especially, the direct design-to-object workflow of 3D printing can facilitate the one-step fast prototyping of devices with complex geometry, thus accelerating the R & D process [60–63]. In our group, a series of specifically designed peripheral accessories for smartphone-based sensing devices are fabricated using 3D printing techniques [6,64–69]. For example, a mini image dark box containing one chip tray for positioning sensor chips and two optical element carriers for assembling optical elements, is fabricated by a Form 1+ 3D printer using EP Epoxy Resin (Fig. 4a). The special designs including two parallel excitation light beams and a black paint-sprayed device, ensure the accurate and highly reproducible collection of fluorescence signals [67]. In another example, FDM 3D printing technique is employed by Zenhausern and co-workers to fabricate fluorescence microscope scaffolds to create a dark environment using acrylonitrile-butadiene-styrene (ABS) polymer as the printing material [70]. As a rapid, cost-effective and precision manufacturing technique, 3D printing will play a continuously growing role in facilitating POCT applications [6,65,67,69,70], even for ECL [59,71,72].
Figure 4
 Figure 4. Light shielding dark box. (a) Fabrication by a Form 1+ 3D printer using EP Epoxy Resin. Reproduced with permission [67]. Copyright 2020, American Chemical Society. (b) Design by LEGO Digital Designer software and assembled manually with LEGO bricks. Reproduced with permission [73]. Copyright 2018, American Chemical Society.
When 3D-printers are not available, LEGO is an excellent alternative. With the assistance of LEGO Digital Designer software, it is quite easy to construct a dark box with all the necessary components embedded for luminescent signal collection (Fig. 4b) [64,73]. In an example of LEGO-based dark box for photoluminescence signal collection, the dark box was equipped with a DC-DC converter to provide steady output voltage for LED which triggers the luminescence, and an optical filter for light homogenization and divergency [64]. LEGO edges with any shape can be easily assembled on the top to guide any kind of photoelectric converter. LEGO-based dark boxes exhibit the distinguish advantages such as rapid reconfiguration and on-the-go satisfaction of the design needs [64,73].
Although optical components are eliminated in most dark boxes designed for ECL signal collection, it has been reported by Li and coworkers that the detection sensitivity can be increased by 10 times if only low-cost optical lenses are used [74]. Well integration of dark boxes with cost-effective optical components for better performance in ECL signal collection deserves further exploration.
2.2.2 Photoelectric converter
ECL signals can be collected in two different technical ways, namely, direct photoelectric conversion mode and imaging mode. Typical photoelectric converters include PDs [75–77] and PMTs. PD, the simplest photoelectric sensor, is composed of a PN junction and can directly convert optical signals into electrical signals. PD is cost-effective, operated at a low voltage, and can be easily integrated with portable devices. For example, by serving as a light-to-current converter, PD is integrated with a potentiostat to develop a portable reconfigurable ECL reader by Carvajal et al. (Fig. 5a). A field programmable analog array (FPAA) which can real-time reconfigure filter and gain stages, is included in this ECL reader for analog conditioning [75]. Although limited in sensitivity, this ECL reader offers an inexpensive and versatile mean of ECL measurements. However, due to lack of internal gain, PDs still suffer from relatively low sensitivity, although operational amplifiers can be integrated.
Figure 5
 Figure 5. Portable ECL devices using different photoelectric converters. (a) PD. Reproduced with permission [75]. Copyright 2012, Elsevier. Reproduced with permission [77]. Copyright 2015, Elsevier. (b) PMT (H10722). Reproduced with permission [79]. Copyright 2022, Wiley. (c) SiPM. Reproduced with permission [72]. Copyright 2022, Elsevier. (d) CCD camera. Reproduced with permission [82]. Copyright 2017, Elsevier. (e) COMS camera-equipped smartphone. Reproduced with permission [56]. Copyright 2022, Elsevier.
PMTs themselves have high internal gain and can detect ultra-weak optical signals, but they fail to synchronously collect optical signals in multiple regions [78]. Because of its extremely high sensitivity, PMTs have been extensively used in desktop instruments such as fluorescence spectrophotometers and luminometers. Actually, Roche Cobas series automatic ECL immunoassay systems, such as Cobas E411, Cobas E601 and Cobas E801, which has monopolized the market for years, use PMTs as the detector. However, the features of PMTs such as high supply voltage, poor seismic resistance and high price, restrict their applications in POCT systems. Fortunately, with the development of microelectronics technology, low supply voltage PMTs, for example, the PMT (H10722) module, which can be operated at an input voltage range of ±4.5 ~ ±5.5 V, is becoming commercially available and successfully used to develop miniaturized ECL devices (Fig. 5b) [79].
Recently, the advances in silicon solid-state photoelectric technology have enabled photosensitive devices with micro-packaging and high sensitivity. For example, SiPM, also called MPPC, which consists of multiple avalanche PD (APD) pixels operated in Geiger mode, exhibits excellent photon counting capability and various advantages over PMT including cost-effectiveness, smaller size, operation at lower voltage, and insensitivity to magnetic fields [80]. In a recent study, an MPPC with a sensitive area of 3 mm × 3 mm and 40,000 pixels was used as the ECL signal detector by Dai and co-workers to develop a portable ECL instrument [81]. This portable instrument consisted of a control circuit with potentiostat for triggering the electrochemical reaction on the SPE, a light shielding box with MPPC detector for collecting ECL signals generated on electrodes, and a laptop computer installed with specific software for data processing and analysis [81]. Very recently, a handheld ECL device using a SiPM module for ECL signal collection is developed for sensing dopamine. As shown in Fig. 5c, besides a SiPM, this handheld ECL device is composed of a flexible PCB for electrical stimulation, signal processing and data transmission; a smartphone installed with a self-developed Android application for parameters setting and results display via Bluetooth; and a light-tight box [72]. Same as PDs and PMTs, a single SiPM also cannot realize simultaneous detection of multiple zones.
In contrast, various imaging equipment such as CCD and CMOS cameras, is featured with multi-channel detection, high spatial resolution, and instant image management, although their sensitivity is not as good as PMTs [78]. In a CCD camera, based on the photoelectric effect, a photosensitive element is stimulated by photons to release charge which will be converted into an output voltage. Thanks to its excellent signal-to-noise ratio, CCD camera is extensively used in developing portable ECL instruments. Using the same configuration as Dai's work but replacing MPPC detector with CCD camera, Liu and co-workers designed and assembled a portable ECL instrument for POCT applications (Fig. 5d) [82].
CMOS image sensor shares the same photoelectric conversion principle as CCD image sensor, but their signal readout process is different. In CCD image sensor, only one or a few output nodes are read out uniformly, ensuring the consistency of its signal output. While, in CMOS image sensor, each pixel has its own signal amplifier which performs charge voltage conversion respectively, resulting in poorer signal output consistency than CCD image sensor. In addition, compared with CCD image sensor, CMOS image sensor exhibits advantages of lower power consumption and manufacturing cost, faster imaging speed, although its sensitivity is not as good as CCD image sensor. Actually, most of current smartphones are equipped with CCD or CMOS cameras. Therefore, CCD or CMOS camera-equipped smartphones are becoming appealing platforms to develop portable ECL devices [56,58,59,71,83]. Fig. 5e illustrates a typical example, where CMOS camera on the smartphone serves as the ECL signal detector [56].
Notably, thanks to their advanced computing capability, powerful built-in sensors, wireless connectivity, safety data management and user-friendly operation interface, smartphones can serve as not only detector, but also laptop computer as well as monitor. In the example illustrated in Fig. 5c, the smartphone serves as a laptop computer for parameters setting and results display [72]. Obviously, smartphones can simplify and facilitate the design of quantitation devices for POCT applications [6,84–86]. Besides ECL signals [56,58,59,71,83], smartphone-based devices have been successfully conditioned to precisely collect and analyze electrochemical [49], colorimetric [87], fluorescent [67], surface plasmon resonance (SPR) [88] signals, etc.
In the typical example of smartphone-based ECL devices, smartphones simultaneously serve as the ECL signal detector, the power supply for potentiostat, and the laptop computer for data analysis and result display. For example, to develop a smartphone-based ECL device, CMOS camera and universal serial bus-on the go (USB-OTG) on smartphone have been successfully conditioned as the ECL signal detector and electrical stimulation [33,55,58,83], respectively. As shown in Fig. 6a, smartphone USB have five lines, namely, GND, ID, D+, D- and Vcc. In this USB-OTG stimulated luminescence system, Vcc is the power line which is linked with WE, GND is electrical ground line which is linked with both CE and RE, and ID is used to identify the host device or slave device during USB-OTG communication [58]. Through a divider circuit, the fixed 5 V voltage outputted by smartphone which serves as the host device can be divided into adjustable voltages for triggering electrochemical reactions on WEs. After being captured by phone camera, ECL images are analyzed using various methods such as red-green-blue (RGB), hue-saturation-brightness (HSB), and Gray analysis [58].
Figure 6

In another example, smartphone-based ECL sensing system is operated by a PCB which consists of STM32F1 microcontroller serving as the central process unit, a battery management module for power distribution and voltage regulation, a potentiostat module for triggering electrochemical reaction on electrodes, and an NFC communication module for data sending and command receiving (Fig. 6b) [59]. To ensure system alignment and ambient light shielding, all components, including the PCB, NFC antenna, battery and electrode, were placed in a 3D-printed dark box. An NFC enabled smartphone was used for setting parameter, collecting and displaying results, and further data analysis. Open-source software, OpenCV and FFmpeg, were integrated into the user-friendly custom application (APP) for image processing. On site quantitation of 3-nitrotyrosine was successfully achieved using this portable ECL sensing system.
Due to their built-in function modules and "smart" capabilities, smartphones enable not only advanced POCT systems through the simplification of instrument design, but also easy-to-use detection through user-friendly custom APPs. More importantly, smartphones enable truly affordable and accessible POCT systems at low-resource settings, although those smartphone-based ECL devices might exhibit lower sensitivity than the laboratory opponents. Obviously, advanced strategies of smartphone-based POC testing have enabled laboratory-based detection to be performed in plug-and-play stand-alone devices. In addition, the real-time connectivity of smartphones also allows more and more people to access digital health pathways. However, to take full advantage of smartphone-based ECL devices, extensive research is still indispensable.
2.3 Software for data processing and analysis
After ECL signals generated on electrodes are successfully collected by photoelectric converters, the next step is to use a computer or a smartphone installed with specific software to display the reporting signals, and more importantly, process and analyze data. Different ECL detectors need to use different data processing methods. Since PMTs are extensively used in large-scale ECL instruments, there is usually proprietary software designed by the company to satisfy such requirements. However, for ECL signals collected by CCD or CMOS cameras, customized or open resource image processing software or APP is usually used to precisely extract information from ECL images. Since CCD or CMOS camera is the preferred detector to design a portable ECL sensing system for POCT applications, this section will focus on various image processing software/APP as well as some image processing algorithms.
There are two different ways to collect ECL signals using cameras, namely, to capture a single image or record a video which is composed of several coherent pictures. Because the change of ECL signal intensity with time can be recorded in real time, video recording is becoming the favorite ECL signal collection method when using cameras. As we know, ECL is a weak luminescence phenomenon, always resulting in that the ECL images captured by cameras are difficult to analyze. Image manipulation enhanced algorithms might contribute to ECL image analysis, for example, Msrcp, Msrcr, Automsrcr, Curve, Mapping, etc. [56,71]. In the study carried out by Rao and Wang, barely any difference can be observed in the original ECL images captured by smartphone's cameras. In contrast, after being applied with image manipulation enhanced algorithms, the differences among ECL images can be obviously observed by even bare eyes (Fig. 7a) [56].
Figure 7
 Figure 7. (a) Language algorithms enhance ECL signals. Reproduced with permission [56]. Copyright 2022, Elsevier. (b) Artificial neural network is constructed on smartphone to realize ML. Reproduced with permission [56]. Copyright 2022, Elsevier. (c) Process of multimodal data collection and prediction process through ML. Reproduced with permission [98]. Copyright 2021, MPDI.
After ECL signals are collected by cameras, various commercially available image processing software such as ImageJ [54,57,89], Photoshop [90], Python [91], MATLAB [32,90,92] can be used for ECL signal processing and analysis. However, those software might not be well suited for smartphone-based ECL sensing systems, especially for on-site data analysis. In order to provide the end-user a stand-alone device, a customized APP with user-friendly interface might be appreciated.
Currently, mainstream smartphones are usually equipped with CMOS cameras which capture images or videos using RGB color models. Therefore, the precise extraction of RGB information from digital images is the most important function of the customized APP. Two algorithms are extensively applied to convert the RGB information extracted from digital images to grayscale values, namely, the averaged RGB algorithm (the averaged grayscale, AG = (R + G + B)/3) [68] and the weighted RGB algorithm (the weighted average grayscale, WAG = 0.299R + 0.587G + 0.114B) [67,93]. After embedding the algorithm which is established based on the relationship between the analyte concentration and designing the user-friendly interface, the customized APP with the minimum function is ready for use.
However, the psychological non-intuitive and perceptual inconsistencies usually result in individual differences in the visualization of colors in RGB color models. In addition, the relationship between the values of the three-color components and the generated colors is also not intuitive. To address this issue, another color model, HSL/HSV (Hue, Saturation, Lightness/Value), is extensively used for the ECL analysis, because a single parameter, namely, L or V is used to represent ECL intensity in HSL/HSV mode [56,59,71]. L is calculated according to the equation L = mid(R, G, B) = (max + min)/2 [59,94], where max is the maximum color component of RGB and min is the minimum color component of RGB; while V is calculated according to the equation V = max(R, G, B) [94,95]. Specifically, the L or V value of 0 or 1 is fully black or white, respectively.
Additionally, the Commission International Eclairage Lab (CIELAB), also termed as L*a*b*, is a color space where equal distances are used to represent threshold or suprathreshold perceived color differences of equal size. The color space expresses color as three values: L* for the lightness from black (0) to white (100), a* from green (−) to red (+), and b* from blue (−) to yellow (+). CIELAB is a color system based on physiological characteristics, which means that digital methods are used to describe human visual induction. However, its calculation is quite complicated, requiring conversion from standard RGB space to XYZ space, and finally to L*a*b* space [94,96]. And it has been reported that HSV color space performs better than L*a*b* with respect to color image segmentation [96]. In a recent study, Liu and co-workers creatively replaced chromaticity coordinates (x, y) with L*a*b* through Eqs. 1–3 [97]:
(1) (2) (3) When image color changes, coordinate (x, y) will also change, then the relationship between the net color-shift distances and targets would be formed. The net color-shift distance, d, is calculated according to the equation d=∆x2+∆y2, ∆x=x-x0, ∆y=y-y0, where x0 and y0 were the color coordinates without target, respectively. In colorimetric detection, the chromaticity coordinates can more clearly reflect the linear offset compared with two initial colors under the color caused by different conditions in the chromaticity diagram [97].
Recently, the integration of deep learning and smartphone has achieved fast and accurate ECL image analysis and processing. For example, convolutional neural networks (CNNs) is a class of feedforward neural networks (FNNs) with convolutional computation and deep structure, enabling batch processing of images. CNNs can be used to select the suitable ECL images for the subsequent extraction of luminescence intensity for quantitative analysis, thus eliminating the manual identification process and improving the credibility of detection results (Fig. 7b) [56,71]. In addition, Hyun J. Kwon's research group utilized machine learning (ML) algorithms, including support vector regression (SVR), decision trees, random forest (RF), neural networks (NN), Gaussian Process Regression (GPR), genetic algorithm (GA), to effectively analyze the nonlinear and multidimensional sensor data [98–100]. As illustrated in Fig. 7c, taking advantages of ML algorithms, multimodal data is unified into a single predictive model using multiple key features extracted from the time series data [98]. Results reveal that, compared with the traditional single or two feature based-regression analysis, the ML algorithm can maximize the use of the obtained information, find some unforeseen interrelations, and achieve accurate prediction of the compounds under test.
Unfortunately, there is no generic approach that can be applied to all situations. But one thing is certain, namely, image manipulation enhanced algorithms can make weak ECL signals easier to observe and analyze. For a specific application, a thorough comparison of available imaging processing methods should be performed to determine which method is the most appropriate [56,58,83]. Actually, to make a smartphone-based ECL sensing platform more practical and ease-of-use, contributions from researchers with expertise in image processing algorithms are highly apricated and encouraged.
3. Challenges and possible solutions
The well-developed laboratory-based ECL sensing systems which use high performance but expensive hardware, account for more than half of the tests performed in clinical laboratories. In contrast, although numerous portable ECL sensing systems have been reported, no such systems have been commercialized or used in clinical settings. For portable ECL sensing systems, challenges still exist in improving detection sensitivity to satisfy the diagnostic requirements, and in realizing "sample-in-result-out" detection to satisfy the requirements at low-resource settings.
3.1 Enhancement of ECL signal intensity
Since portable ECL sensing systems usually use cost-effective but low performance hardware, enhancing ECL signal intensity is the best choice to satisfy the sensitivity requirements of clinical diagnosis. Various strategies can be used to enhance ECL signal intensity, including: (1) using ECL luminophores with higher efficiency; (2) loading ECL luminophores into micro/nano materials to increase the local concentration of ECL luminophores; 3) amplifying the detection signal or analyte.
3.1.1 ECL luminophores with higher efficiency
The booming science of aggregation-induced emission (AIE) also injects new possibilities into ECL analysis, especially in enhancing ECL efficiency and intensity [101,102]. During the process of aggregation-induced electrochemiluminescence (AIECL) which was put forward by Cola et al. in 2017 [103], the rotation and vibration of ECL luminophores are restricted, resulting in the substantially reduced quenching degree among molecules and thereafter the substantially enhanced ECL emission intensity. Platinum complexes [103] and iridium complexes [104] are the extensively explored inorganic AIECL luminophores. For example, when Pt(Ⅱ) complexes were close enough to each other (< 3.5 Å), the dz2-orbitals could interact, forming new molecular orbitals and changing the HOMO and LUMO energies by self-assembly. As a result, platinum complexes exhibited 20% higher emission efficiency than Ru(bpy)32+/TPrA [103]. [Ir(tpy)(bbbi)] molecules could self-assemble into nanoparticles in aqueous solution through supramolecular interaction (π-π-stacking and hydrogen bonding). As a result, molecular vibration of Ir complexes could be inhibited, leading to the dramatic enhancement in its ECL emission efficiency, which is 4.04 times of Ru(bpy)32+/TPrA under the same conditions [104]. In another example, the AIECL luminophore, cyclometalated iridium(Ⅲ)-poly-4-vinylpyridine nanoparticles along with aptamer-modified gold nanoparticles (AuNPs-Apt) and nitrogen-doped graphene, were coated onto carbon SPE to fabricate a biosensor for early diagnosis of acute myocardial infarction (MI). Thanks to the AIECL phenomenon, the detection of MI biomarker, troponin I (TI), can be realized with a LOD of 20 fmol/L [105].
In addition, polymers and small organic molecules whose structures can be finely modulated to increase the aggregation feasibility and guarantee the AIECL property, represent the other classical AIECL luminophores. Especially, polymers and small organic molecules could aggregate into dots, enabling elaborate modulation and even higher emission efficiency [101,106,107].
Nanomaterial also presents itself as a promising type of highly efficient ECL luminophore. Various nanomaterials including semiconductor quantum dots (QDs) [108,109], carbon quantum dots (CQDs) [110,111], nanocrystals [112,113], nanocluster (NCs) [114–116], nanosheets [117], polymer dots (Pdots) [118,119], have been explored their ECL properties. The characteristics of nanoscale ECL luminophores always afford them strong quantum size effect, propitious ECL process, good optical stability, and more importantly, enhanced ECL efficiency. For instance, the crystallization-induced enhanced ECL emission effects result in the ECL efficiency (ΦECL) of tetraphenyl alkene nanocrystals substantially increasing to 31.53% [112]. And AuNCs with triethylamine (TEA) as a co-reactant exhibited a high ΦECL of 66%, because accumulation of oxidized species induced by pre-oxidation treatment led to more effective electron transfer between AuNCs and TEA [114].
The second advantage of nanoscale ECL luminophores is their versatile synthesis methods, which enable fine modulation of their ECL emission and electrical properties via various doping strategies, changing the co-reactants, and tuning the size or surface states. For example, L-Pdots which emitted the blue ECL (λmax = 450 nm) in the presence of H2O2 at +0.6 V, were prepared by encapsulating luminol into poly (styrene-co-maleic anhydride). While, N-Pdots which emitted the self-enhanced red ECL (λmax = 675 nm) under +1.0 V, could be prepared by coupling diethylamine with poly[2,7-(9,9-dioctylfluorene)-alt-4,7-bis(thiophen-2-yl)benzo-2,1,3-thiadiazole] [118]. In another example, Au25NCs served as highly efficient bipolar ECL luminophores for cathodic ECL detection of CEA using TiO2 nanosheets as the coreaction accelerator and anodic ECL detection of mucin 1 (MUC1) using Cu2O@Cu nanoparticles as the coreaction accelerator simultaneously [116].
3.1.2 Increase of the local concentration of ECL luminophores
In addition to nanoscale ECL luminophores, nanomaterials which have no intrinsic ECL emission property, for example, dendrimers [120], mesoporous nanometer materials [121], MXene [122,123], core-shell structured NPs [124,125], hydrogels [126], have also been extensively used to load and concentrate ECL luminophores to enhance ECL emission intensity. More importantly, in addition to ECL luminophores, co-reactants and other auxiliary components can also be incorporated into nanomaterials, resulting in the shortened distance of electron transport, accelerated electron transfer and thus enhanced ECL efficiency. For example, poly(3,4-ethylenedioxythiophene) (PEDOT)-hosted AgNCs exhibited a ΦECL of 69.56%, because PEDOT served a triple function as the AgNCs stabilizer, interface electron injection accelerator and the electro-catalyzer for AgNCs-S2O82– ECL system (Fig. 8a) [115]. In another example, 6-aza-2-thiothymine (ATT) protected AuNCs with TEA as a co-reactant were reported to exhibit a ΦECL of 78%, enabling visual observation. A dual-enhancement mechanism was proposed to account for this extremely high ΦECL, namely, an electrocatalytic effect and solid-state AIECL (Fig. 8b) [127].
Figure 8
 Figure 8. ECL signal tags based on ECL luminophores-encapsulated nanomaterials. (a) PEDOT-hosted AgNCs. Reproduced with permission [115]. Copyright 2021, American Chemical Society. (b) ATT-protected AuNCs. Reproduced with permission [127]. Copyright 2019, Wiley. (c) DNA nanoclews loaded with Ru(phen)32+. Reproduced with permission [128]. Copyright 2020, Elsevier.
Recently, DNA-based 3D nanostructures have attracted increasing research attention in the development of biosensors, because of their distinguishing characteristics including sequence programmability, automated synthesis and modification, inherent functionality and excellent biocompati-bility. Representative DNA-based 3D nanostructures include DNA nanoclews [128], DNA nanoflowers [129], DNA nanotubes [130], hybridization chain reaction-based DNA polymers [131] and branched-DNA [132]. For example, significant ECL signal enhancement has been successfully achieved using Ru(phen)32+-embedded DNA nanoclews (Fig. 8c) [128], Ru(bpy)32+-accumulated DNA nanoflowers [129] and Ru(phen)32+-loaded DNA nanotube [130], because lots of Ru(Ⅱ) complexes are readily embedded into the DNA duplex structures. Rolling circle amplification (RCA) reactions can be conditioned to synthesize DNA nanoclews and DNA nanoflowers by using palindromic sequences encoded in primers, and DNA nanotubes can be easily prepared via self-assembly.
In recent years, many efforts have been devoted to design metal-organic framework (MOF)-based ECL luminophores, because it has been proven to be an effective strategy to improve ECL efficiency [14]. MOFs which are synthesized using metal ions/clusters and organic linkers, are emerging porous and crystalline materials. The features of MOFs can facilitate ECL applications, because their interconnecting pores and channels can concentrate ECL luminophores, shorten diffusion paths of electrons, and thus enhancing ECL emission efficiency. However, the low water stability and poor conductivity significantly restrain the application of MOF-based ECL luminophores. Recent advances in the development of MOF-based ECL luminophores demonstrate that such defects can be remedied by integrating functional materials [133–137]. MOF-based ECL luminophores can be prepared via three main pathways [14], namely, (1) direct synthesis of MOF materials using ECL luminophores as ligands; (2) in situ encapsulation of ECL luminophores during the synthesis of MOF materials; (3) post-synthetic functionalization of MOF materials with ECL luminophores.
It is an ideal way to incorporate organic ECL luminophores into MOF scaffolds as ligands to prepare MOF-based ECL luminophores. As typical organic ECL luminophores, porphyrins and their derivatives have been extensively used as ligands for the synthesis of MOF-based ECL luminophores. For example, meso-tetra(4-carboxyphenyl)porphyrin (TCPP) [133] and zinc tetrakis(carboxyphenyl)-porphyrin (ZnTCPP) [138] were successfully used as ligands for the synthesis of MOF-based ECL luminophores for quantification of proprotein convertase subtilisin/kexin type 9 and protein kinase A activity, respectively. Through metal ion chelation, Ru complexes, the most commonly used ECL luminophore, could also be readily integrated into MOF structures. In a specific example, 2D Ru-MOF nanosheets were successfully synthesized by using Ru(dcbpy)32+ as bridging ligand and Zn(NO3)2 as the metal center (Fig. 9a) [139]. A 2D nanostructure can form a faraday cage on the electrode surface, allowing electrons to flow freely between the signal unit and the electrode and thus improving the sensing performance. In addition, AIE ligands, for example, 1,1,2,2-tetra(4-carboxylbiphenyl)ethylene (H4TCBPE) and 4′, 4′′′, 4′′′′, 4′′′′′′′-(ethene-1,1,2,2-tetrayl)tetrakis(([1,1′-biphenyl]-4-oxylic acid)) (H4ETTC), were used to synthesize Hf-based MOF (Hf-TCBPE) (ΦECL = 21.72%) [134] and 2D metal-organic layer (ΦECL = 27.63%) [135], respectively. AIE ligands within rigid MOFs result in substantial ECL enhancement.
Figure 9
 Figure 9. MOF-based ECL luminophores. (a) 2D Ru-MOF nanosheets. Reproduced with permission [139]. Copyright 2018, Elsevier. (b) Ru@MOF@Ru-NCND@SmS2 QDs. Reproduced with permission [141]. Copyright 2022, Elsevier. (c) Ru-PCN-777. Reproduced with permission [142]. Copyright 2018, American Chemical Society.
In situ encapsulation of ECL luminophores during the synthesis of MOF materials is an alternative approach to synthesize MOF-based ECL luminophores. Thanks to their tunable pore sizes, the self-enhanced Ru(dcbpy)32+-polyethyleneimine-l-lysine (Ru-PEI-L-lys) complex was successfully encapsulated into zeolitic imidazolate framework-8 (ZIF-8). The resultant Ru-PEI-L-lys-ZIF-8 exhibited excellent ECL emission behavior and was successfully conditioned for sensing telomerase activity with a LOD of 0.02 amol/L [140]. Through this in situ encapsulation approach, both the desirable ECL property of encapsulated luminophores, highly efficient analyte accumulation performance and catalyst property of MOF can be well preserved. For example, CdTe QDs-encapsulated IRMOF-3 exhibited significantly improved ECL efficiency, because IRMOF-3 promoted the transformation of S2O82− co-reactant into sulfate radical anion [136]. Similar to nanomaterials, MOF also provides a robust framework in which both ECL luminophores and co-reactants can be incorporated. In a typical example, ECL luminophore Ru(bpy)2(phen-NH2)2+ was in situ encapsulated and dual co-reactants of nitrogen doped carbon nanodots (NCNDs) and SmS2 QDs was decorated into MOF material (Fig. 9b). ECL efficiency of the resultant MOF-based ECL luminophores was 13.34%, increased by 8 folds [141].
Various functional groups enable MOF materials to use the post-synthetic functionalization approach to load ECL luminophores. PCN-777 [142], UiO-66 [143], MIL-53 [144] and ZIF-67 [137] have been successfully conjugated with various ECL luminophores for ECL sensing. For example, Ru(bpy)2(mcpbpy)2+ can be grafted on the inner and outer surfaces of mesoporous MOF (PCN-777) through the strong coordination bond between Zr4+ and -COO− (Fig. 9c) [142]. In another example, after conjugation onto ZIF-67 surface via electrostatic interaction, luminol-capped AgNPs exhibited ~115-fold enhancement in ECL efficiency compared with individual luminol [137]. The substantially accelerated production of oxygen radicals by ZIF-67 due to the atomically dispersed Co2+ and the porous structure should be responsible for this dramatic enhancement.
3.1.3 Amplification strategy
For amplification strategy, there are two different ways: 1) amplifying the analyte and 2) amplifying the detection signal. Examples of amplifying the analyte can be easily found in the detection of nucleic acid, because there are lots of well-established nucleic acid amplification methods [145]. Polymerase chain reaction (PCR) [146] and various isothermal amplification methods such as nucleic acid sequence-based amplification (NASBA) [147], loop-mediated amplification (LAMP) [148], RCA [119], and strand displacement amplification (SDA) [128] have been well-integrated with ECL to realize ultrasensitive detection.
Recycling of the analyte is another extensively used approach for amplifying nucleic acids. Recycling of the analyte can be achieved by designing the analyte as a switch to trigger the occurrence of a cycle event with the aid of nuclease cleavage [140,149] and/or chain displacement [128,150]. For example, a chain displacement reaction and DNA walker amplification strategy have been designed for ratiometric ECL sensing of SARS-CoV-2 RdRp gene [150]. As shown in Fig. 10a, the substrate with a toehold designed for specific recognition of SARS-CoV-2 RdRp gene, consists of three nucleic acids with different sequences, namely, the scaffold chain for hybridization with the analyte, the bandage chain for subsequent DNA walker, and the blocker. The hybridization of SARS-CoV-2 RdRp with the scaffold initiates the cycle amplification by subsequently forming the intermediate 1, releasing the bandage and transforming to the intermediate 2. Thereafter, fuel can hybridize with the exposed toehold of intermediate 2 to produce double-stranded waste, and in the meantime, release RdRp gene which further initiates the next cycle.
Figure 10
 Figure 10. Different nucleic acid amplification strategies. (a) Dual wavelength ratiometric ECL biosensor with target recycling by chain displacement reaction and bipedal DNA walker amplification strategies. Reproduced with permission [150]. Copyright 2022, Elsevier. (b) Testing of cytomegalovirus pp65 antibody via smart circular peptide-DNA nanomachine amplification and silver nanoflowers loaded with luminophores. Reproduced with permission [151]. Copyright 2018, American Chemical Society. (c) HCR and magnetic assisted enrichment. Reproduced with permission [131]. Copyright 2021, Elsevier. (d) Tripedal DNA Walker. Reproduced with permission [154]. Copyright 2020, American Chemical Society.
Nucleic acid amplification methods can also be conditioned for protein detection by using a reporter DNA [151,152]. For example, a cascade recycling amplification technique which can be initiated by a circular peptide-DNA nanomachine, is designed for ultrasensitive detection of cytomegalovirus pp65 antibody (anti-CMV pp65) with a LOD of 0.33 fmol/L [151]. As shown in Fig. 10b, an antigenic peptide is designed to be labeled with a specific nucleic acid sequence to serve as the capture probe (Cp) for anti-CMV pp65. The specific recognition between Cp and anti-CMV pp65 results in the formation of target complex which triggers the formation of the circular peptide-DNA nanomachine by the proximity hybridization of DNA motifs in the presence of Fuel 1 and Fuel 2, two auxiliary DNA strands. Two recycles are then implemented successively by the circular peptide-DNA nanomachine: 1) phi29 DNA polymerase activates the recycle I to generate the double-stranded DNA (dsDNA) template and target complex, and 2) the endonuclease Nt.BbvCI subsequently initiates recycle Ⅱ by triggering strand displacement amplification to output massive mimic targets which were used for the ECL detection.
Similar to the increase of the local concentration of ECL luminophores by using nanomaterials, the detection signal can be amplified by introducing multiple ECL luminophores via chain reaction. As a typical type of toehold-mediated strand displacement reaction, hybridization chain reaction (HCR) is featured with isothermal and enzyme-free amplification with excellent efficiency, and has been extensively explored for sensing a wide variety of analytes, including nucleic acids, small molecules, proteins and even cells [153]. In the process of HCR, the analyte triggers the cross-opening of two DNA hairpins, yielding a nicked double helix that grows until the hairpin supply is exhausted. For example, Xu et al. [131] developed a homogeneous ECL biosensor for highly sensitive detection of miRNA-21 based on target-induced HCR (Fig. 10c). miRNA-21 triggers HCR amplification to produce long strand dsDNA whose grooves can be embedded with Ru(phen)32+, leading to strong ECL emission. Combined with magnetic enrichment and separation, ultrasensitive detection of miRNA-21 in the urine of patients with acute kidney injury (AKI) was achieved.
DNA walker, a sort of dynamic DNA nanomachine, has been widely employed in bioanalysis because of its superior motility and controllability. 3D-DNA walker is based on a highly localized entropy-driven reaction, which is a simple, isothermal, enzyme-free, and quick detection technique. Wang et al. [154] reported a tripedal DNA walker biosensor for sensing miRNA-21 with a superior LOD of 4 amol/L. As shown in Fig. 10d, the Y-shaped tripedal DNA walker formed by three well-designed hairpins (HP1, HP2 and HP3), was synthesized by an enzyme-free target-triggered catalytic hairpin assembly (CHA) reaction. On the surface of the Au electrode, abundant hairpin DNA strands (HP4) were conjugated to serve as DNA tracks, the "legs" of the tripedal DNA walker would open HP4, then the exposed part of HP4 could hybridize with Au@luminol-HP5 and release DNA walker through strand displacement reaction. With the binding and release of DNA walker, a large amount of Au@luminol-HP5 was fixed on the electrode surface to increase the ECL signal.
3.2 Detection in a "sample-in-result-out" manner
In order to simplify operation steps and realize foolproof detection, POCT should be designed as one-step detection, namely sample-in-result-out. This is a highly integrated and automated process that requires a combination of various technologies. Fortunately, microfluidic technology is a promising way for realizing "sample-in-result-out" detection [155,156]. Highly integrated microfluidic chip can realize various analytical steps such as reagent pre-storage, sample pre-treatment, reagent mixing and biochemical reaction, with advantages of automatic operation, low reagent consumption and rapid detection. As to the signal display, ordinary electronic display screens, computers or smartphones are our choices. But smartphones are obviously superior to the other two options in terms of excellent human-computer interaction interface, small and portable, signal processing and storage. The fixtures are usually made by 3D printing, but can also be built in other ways.
Ganguli et al. [157] reported a lab-on-chip device for simultaneous detection of zika, chikungunya, and dengue viruses in a "sample-in-result-out" manner. In the device, the flow of liquid was driven by capillary action, and the positive temperature coefficient (PTC) heater was used to realize LAMP temperature setting. The Arduino Gemma microcontroller board was used to realize the power supply and operation of the light source module. The 3D printing technology was used to fabricate the housing and fixing bracket of each component, which also played a role in light protection. In order to realize the automatic control of microfluidics, valve switches and other electronic devices, the Arduino open source electronic platform has become an outstanding choice due to its flexibility, ease of use, open source and sharing. In addition, the smartphone was used to collect fluorescence signals and communicate with the external computing system through a cloud connection for data processing.
More importantly, as shown in Fig. 11a, microfluidic chips can also be integrated with electrodes for designing ECL sensors [158,159]. Kadimisetty et al. [159] bonded the end of the microfluidic chip with graphite microwell electrode (WE) through adhesive. The microfluidic channel reserved the grooves for insertion of RE and CE, forming a three-electrode system. The front part of the microfluidic chip was prefilled with various reaction reagents and buffers (Fig. 11b), and an electronic control system costing about $120 was built independently to control the switch of the micropump and the on/off of the excitation voltage to achieve automatic detection (Figs. 11c and d). The electronic control system consisted of a touch screen, an Arduino Mega microcontroller board, and automated programming, was used to control the different steps of immunoassays. The independent micropump microcontroller was connected to the Arduino automation platform to control the on/off cycle of the micropump to perform the incubation washing step and complete the formation of immune sandwich structure on the electrode surface. This electronic control system was also connected to a potentiostat to apply an excitation voltage to the electrode surface. The entire system was powered by a 4.5 V rechargeable lithium battery and could also be powered by other devices (such as smartphones) via a USB port on the Arduino Mega microcontroller board. CCD camera and computer software were then used for the subsequent ECL signal acquisition and processing. Beyond all doubt, the integration of microfluidics, electrode system, micro-electronic circuit control system, 3D printing technology and smartphone is a feasible solution to achieve "sample-in-result-out" detection.
Figure 11
 Figure 11. Automated portable ECL devices. (a) Overall schematic diagram. (b) 3D-printed microfluidic array and sandwich immunoassay strategy. (c) Physical picture of automation device and its touch operation page. (d) Side view of automation setup showing all the components. Reproduced with permission [159]. Copyright 2018, American Chemical Society.
4. Conclusion
The convergence of ECL sensor for POCT applications offers an appealing screening method for on-site detection at low-resource settings. This paper summarizes the design rationale of portable ECL devices from electrochemical system (including electrode and excitation voltage generator), optical detection system (including light shielding black box and photoelectric converter) and signal processing. Especially, smartphone-based ECL sensing systems enable traditional laboratory-based detection, which suffers from expensive instruments and insufficient skilled technicians, to be performed anywhere, anytime, and by anyone.
Though the enormous advantages are clearly manifested, several critical issues concerning the practical applications of portable ECL sensing systems remain. Due to the use of cost-effective but low performance hardware, portable ECL sensing systems always suffer from insufficient sensitivity. The best choice to satisfy the sensitivity requirements of various practical POCT applications, is to develop ECL sensing strategies with higher sensitivity to compensate for sensitivity insufficiency of the device itself. Extensive research efforts have been dedicated to this research area, leading to various good strategies such as: (1) using ECL luminophores with higher efficiency; (2) loading ECL luminophores into micro/nano materials to increase the local concentration of ECL luminophores; (3) amplifying the detection signal or analyte. Another challenge faced by portable ECL sensing systems for practical applications is the foolproof detection performed by laypersons. The most promising way is to develop "sample-in-result-out" detection to simplify operations, thus reducing dependence on skilled technicians. Extensive research efforts have been dedicated to design and fabricate various microfluidic chips to accomplish this.
Additionally, to make smartphone-based ECL sensing systems more practical and easy-of-use, contributions from researchers with expertise in image processing algorithms and artificial intelligence are highly appreciated and encouraged. Through taking advantages of wireless connection of smartphones, highly efficient ECL image recognition and data processing can be realized in the cloud, thanks to powerful cloud computing and storage capacity. This will greatly improve data processing efficiency and break through the limitations of computing capacity of smartphone itself.
Undoubtedly, in order to bring portable ECL sensing systems into full play, constant research efforts should be made in developing portable ECL sensing devices with higher performance, ECL sensing strategies with higher sensitivity, and microfluidic chips with versatile functions, and etc. We believe this review can help interested researchers to comprehend the design rationale of portable ECL sensing systems and push the development of mobile detection forward, leading to more valuable sensing systems and their diversified applications, even future commercialization.
Declaration of competing interest
The authors declare that they have no known competing financial interests or personal relationships that could have appeared to influence the work reported in this paper.
Acknowledgments
The financial support from the National Key Research and Development Program of China (No. 2022YFE0201800), Shenzhen Science and Technology Innovation Commission (Nos. GJHZ20210705142200001 and JCYJ20210324140004013), and Guangdong Natural Science Foundation (Nos. 2021A1515220020 and 2020B1212060077) is gratefully acknowledged.
-
-
[1]
Z. Zhang, P. Ma, R. Ahmed, et al., Adv. Mater. 34(2022) 2103646. doi: 10.1002/adma.202103646
-
[2]
J.G.M. Koeleman, H. Brand, S.J. de Man, D.S.V. Ong, Eur. J. Clin. Microbiol. Infect. Dis. 40(2021) 1975–1981. doi: 10.1007/s10096-021-04274-7
-
[3]
S. Jain, M. Nehra, R. Kumar, et al., Biosens. Bioelectron. 179(2021) 113074. doi: 10.1016/j.bios.2021.113074
-
[4]
T.K. Teoh, J. Powell, J. Kelly, et al., J. Hosp. Infect. 110(2021) 45–51. doi: 10.1016/j.jhin.2021.01.004
-
[5]
C.S. Wood, M.R. Thomas, J. Budd, et al., Nature 566(2019) 467–474. doi: 10.1038/s41586-019-0956-2
-
[6]
M. Xiao, F. Tian, X. Liu, et al., Adv. Sci. 9(2022) 2105904. doi: 10.1002/advs.202105904
-
[7]
M. Zarei, Biosens. Bioelectron. 98(2017) 494–506. doi: 10.1016/j.bios.2017.07.024
-
[8]
G. Chen, X. Xiao, X. Zhao, et al., Chem. Rev. 122(2022) 3259–3291. doi: 10.1021/acs.chemrev.1c00502
-
[9]
S. Shrivastava, T.Q. Trung, N.E. Lee, Chem. Soc. Rev. 49(2020) 1812–1866. doi: 10.1039/C9CS00319C
-
[10]
Y. Hang, J. Boryczka, N. Wu, Chem. Soc. Rev. 51(2022) 329–375. doi: 10.1039/C9CS00621D
-
[11]
Z. Liu, W. Qi, G. Xu, Chem. Soc. Rev. 44(2015) 3117–3142. doi: 10.1039/C5CS00086F
-
[12]
B. Babamiri, D. Bahari, A. Salimi, Biosens. Bioelectron. 142(2019) 111530. doi: 10.1016/j.bios.2019.111530
-
[13]
K.G. Cho, J.I. Lee, S. Lee, et al., Adv. Funct. Mater. 30(2020) 1907936. doi: 10.1002/adfm.201907936
-
[14]
J. Zhou, Y. Li, W. Wang, et al., Biosens. Bioelectron. 164(2020) 112332. doi: 10.1016/j.bios.2020.112332
-
[15]
N. Sojic, Analytical Electrogenerated Chemiluminescence, The Royal Society of Chemistry, London, 2020.
-
[16]
J. Zhang, S. Arbault, N. Sojic, D. Jiang, Annu. Rev. Anal. Chem. 12(2019) 275–295. doi: 10.1146/annurev-anchem-061318-115226
-
[17]
E. Martínez-Periñán, C. Gutiérrez-Sánchez, T. García-Mendiola, E. Lorenzo, Biosensors 10(2020) 118. doi: 10.3390/bios10090118
-
[18]
R. Zhang, X. Zhong, A. Chen, et al., Anal. Chem. 91(2019) 3681–3686. doi: 10.1021/acs.analchem.8b05795
-
[19]
S.R. Chinnadayyala, J. Park, T.N.L. Hien, et al., Biosens. Bioelectron. 126(2019) 68–81. doi: 10.1016/j.bios.2018.10.038
-
[20]
E.M. Gross, H.E. Durant, K.N. Hipp, R.Y. Lai, ChemElectroChem 4(2017) 1594–1603. doi: 10.1002/celc.201700426
-
[21]
X. Sun, B. Li, C. Tian, et al., Anal. Chim. Acta 1007(2018) 33–39. doi: 10.1016/j.aca.2017.12.005
-
[22]
M. Bhaiyya, P.K. Pattnaik, S. Goel, Curr. Opin. Electrochem. 30(2021) 100800. doi: 10.1016/j.coelec.2021.100800
-
[23]
S.E. Fosdick, K.N. Knust, K. Scida, R.M. Crooks, Angew. Chem. Int. Ed. 52(2013) 10438–10456. doi: 10.1002/anie.201300947
-
[24]
M. Liu, R. Liu, D. Wang, C. Liu, C. Zhang, Lab Chip 16(2016) 2860–2870. doi: 10.1039/C6LC00289G
-
[25]
X. Zhang, Q. Zhai, H. Xing, J. Li, E. Wang, ACS Sens. 2(2017) 320–326. doi: 10.1021/acssensors.7b00031
-
[26]
X. Xiong, Y. Li, W. Yuan, et al., Biosens. Bioelectron. 150(2020) 111873. doi: 10.1016/j.bios.2019.111873
-
[27]
Y. Hu, Y. He, Z. Peng, Y. Li, Biosens. Bioelectron. 167(2020) 112490. doi: 10.1016/j.bios.2020.112490
-
[28]
H. Lu, W. Zhao, J. Xu, H. Chen, Biosens. Bioelectron. 102(2018) 624–630. doi: 10.1016/j.bios.2017.12.008
-
[29]
J. Zhao, C.X. Chen, J.W. Zhu, et al., Anal. Chem. 94(2022) 4303–4310. doi: 10.1021/acs.analchem.1c04971
-
[30]
F. Wang, C. Fu, C. Huang, et al., Biosens. Bioelectron. 150(2020) 111917. doi: 10.1016/j.bios.2019.111917
-
[31]
Q. Feng, H. Chen, J. Xu, Sci. China Chem. 58(2015) 810–818. doi: 10.1007/s11426-014-5295-4
-
[32]
M. Bhaiyya, P.K. Pattnaik, S. Goel, Microchim. Acta 189(2022) 79. doi: 10.1007/s00604-022-05200-0
-
[33]
M. Bhaiyya, P.K. Pattnaik, S. Goel, IEEE Trans. Electron. Devices 68(2021) 2447–2454. doi: 10.1109/TED.2021.3066083
-
[34]
Y.G. Bi, Y.F. Liu, X.L. Zhang, et al., Adv. Opt. Mater. 7(2019) 1800778. doi: 10.1002/adom.201800778
-
[35]
D.S. Hecht, L. Hu, G. Irvin, Adv. Mater. 23(2011) 1482–1513. doi: 10.1002/adma.201003188
-
[36]
W. Gao, K. Muzyka, X. Ma, B. Luo, G. Xu, Chem. Sci. 9(2018) 3911–3916. doi: 10.1039/C8SC00410B
-
[37]
T. Jet, G. Gines, Y. Rondelez, V. Taly, Chem. Soc. Rev. 50(2021) 4141–4161. doi: 10.1039/D0CS00609B
-
[38]
C. Li, Z. Fu, Z. Li, Z. Wang, W. Wei, Biosens. Bioelectron. 27(2011) 141–147. doi: 10.1016/j.bios.2011.06.031
-
[39]
K. Ino, R. Yaegaki, K. Hiramoto, Y. Nashimoto, H. Shiku, ACS Sens. 5(2020) 740–745. doi: 10.1021/acssensors.9b02061
-
[40]
M. Wu, Z. Liu, H. Shi, H. Chen, J. Xu, Anal. Chem. 87(2015) 530–537. doi: 10.1021/ac502989f
-
[41]
R. Guo, S. Hu, Z. Wang, Analyst 145(2020) 3569–3574. doi: 10.1039/D0AN00678E
-
[42]
F. Du, Z. Dong, Y. Guan, et al., Anal. Chem. 94(2022) 2189–2194. doi: 10.1021/acs.analchem.1c04709
-
[43]
P. Podesva, X. Liu, P. Neuzil, Sens. Actuators B: Chem. 286(2019) 282–288. doi: 10.1016/j.snb.2018.11.127
-
[44]
T.J. Anderson, P.A. Defnet, B. Zhang, Anal. Chem. 92(2020) 6748–6755. doi: 10.1021/acs.analchem.0c00921
-
[45]
T. Iwama, Y. Guo, S. Handa, et al., Adv. Mater. Technol. 7(2021) 2101066.
-
[46]
T. Iwama, K.Y. Inoue, H. Abe, T. Matsue, H. Shiku, Analyst 145(2020) 6869–6895.
-
[47]
J. Ding, P. Zhou, W. Guo, B. Su, Front. Chem. 8(2021) 630246. doi: 10.3389/fchem.2020.630246
-
[48]
H. Li, T. Zhang, H. Zhou, et al., ChemElectroChem 8(2021) 1473–1477. doi: 10.1002/celc.202100158
-
[49]
Z. Xu, Z. Liu, M. Xiao, L. Jiang, C. Yi, Chem. Eng. J. 394(2020) 124966. doi: 10.1016/j.cej.2020.124966
-
[50]
Y. Cheng, X. Gong, J. Yang, et al., Biosens. Bioelectron. 203(2022) 114026. doi: 10.1016/j.bios.2022.114026
-
[51]
T. Guan, W. Huang, N. Xu, et al., Sens. Actuators B: Chem. 294(2019) 132–140. doi: 10.1016/j.snb.2019.05.028
-
[52]
J. Gao, W. Huang, Z. Chen, C. Yi, L. Jiang, Sens. Actuators B: Chem. 287(2019) 102–110.
-
[53]
E. Kerr, R. Farr, E.H. Doeven, et al., Sens. Actuators B: Chem. 330(2021) 129261. doi: 10.1016/j.snb.2020.129261
-
[54]
L. Chen, C. Zhang, D. Xing, Sens. Actuators B: Chem. 237(2016) 308–317. doi: 10.1016/j.snb.2016.06.105
-
[55]
E.H. Doeven, G.J. Barbante, A.J. Harsant, et al., Sens. Actuators B: Chem. 216(2015) 608–613. doi: 10.1016/j.snb.2015.04.087
-
[56]
T. Liu, J. He, Z. Lu, et al., Chem. Eng. J. 429(2022) 132462. doi: 10.1016/j.cej.2021.132462
-
[57]
M. Salve, A. Mandal, K. Amreen, et al., IEEE Trans. Instrum. Meas. 70(2021) 1–10.
-
[58]
S. Li, D. Zhang, J. Liu, et al., Biosens. Bioelectron. 129(2019) 284–291. doi: 10.1016/j.bios.2018.09.055
-
[59]
L. Zhu, S. Li, W. Liu, et al., Biosens. Bioelectron. 187(2021) 113284. doi: 10.1016/j.bios.2021.113284
-
[60]
J. Yang, Y. Cheng, X. Gong, et al., Chin. Chem. Lett. 33(2022) 2231–2242. doi: 10.1016/j.cclet.2021.08.105
-
[61]
A. Lambert, S. Valiulis, Q. Cheng, ACS Sens. 3(2018) 2475–2491. doi: 10.1021/acssensors.8b01085
-
[62]
J. Zhang, H. Huang, G. Song, et al., Biosens. Bioelectron. 202(2022) 114003. doi: 10.1016/j.bios.2022.114003
-
[63]
E.J. Carrasco-Correa, E.F. Simó-Alfonso, J.M. Herrero-Martínez, M. Miró, TrAC Trends Analyt. Chem. 136(2021) 116177. doi: 10.1016/j.trac.2020.116177
-
[64]
Z. Liu, M. Xiao, R. Yang, et al., J. Anal. Test. 5(2021) 19–29. doi: 10.1007/s41664-021-00163-2
-
[65]
Y. Liu, M. Xiao, N. Xu, M. Yang, C. Yi, Sens. Actuators B: Chem. 367(2022) 132083. doi: 10.1016/j.snb.2022.132083
-
[66]
M. Xiao, Q. Zhou, H. Zhang, et al., ACS Appl. Nano Mater. 4(2021) 8184–8191. doi: 10.1021/acsanm.1c01413
-
[67]
M. Xiao, Z. Liu, N. Xu, et al., ACS Sens. 5(2020) 870–878. doi: 10.1021/acssensors.0c00219
-
[68]
L. Li, Z. Liu, H. Zhang, et al., Sens. Actuators B: Chem. 254(2018) 337–346. doi: 10.1016/j.snb.2017.07.074
-
[69]
Z. Liu, Y. Zhang, S. Xu, et al., Anal. Chim. Acta 966(2017) 81–89. doi: 10.1016/j.aca.2017.02.022
-
[70]
R. Zenhausern, A.S. Day, B. Safavinia, et al., Biosens. Bioelectron. 200(2022) 113916. doi: 10.1016/j.bios.2021.113916
-
[71]
Y. Zhang, Y. Cui, M. Sun, et al., Biosens. Bioelectron. 209(2022) 114262. doi: 10.1016/j.bios.2022.114262
-
[72]
L. Zhu, W. Fu, J. Chen, et al., Sens. Actuators B: Chem. 366(2022) 131972. doi: 10.1016/j.snb.2022.131972
-
[73]
X. Sun, A.A. Boulgakov, L.N. Smith, et al., ACS Cent. Sci. 4(2018) 854–861. doi: 10.1021/acscentsci.8b00193
-
[74]
Y. Li, X. Ma, W. Wang, et al., J. Biophotonics 13(2020) e201900241.
-
[75]
M.A. Carvajal, J. Ballesta-Claver, D.P. Morales, et al., Sens. Actuators B: Chem. 169(2012) 46–53. doi: 10.1016/j.snb.2012.01.072
-
[76]
A. Martínez-Olmos, J. Ballesta-Claver, A. Palma, M.D.C. Valencia-Mirón, L. Capitán-Vallvey, Sensors 9(2009) 7694–7710. doi: 10.3390/s91007694
-
[77]
M.A. Carvajal, J. Ballesta-Claver, A. Martínez-Olmos, L.F. Capitán-Vallvey, A.J. Palma, Sens. Actuators B: Chem. 221(2015) 956–961. doi: 10.1016/j.snb.2015.07.038
-
[78]
B. Towaranonte, Y. Gao, Anal. Lett. 55(2022) 186–202. doi: 10.1080/00032719.2021.1920971
-
[79]
M. Bhaiyya, M.B. Kulkarni, P.K. Pattnaik, S. Goel, Luminescence 37(2022) 357–365. doi: 10.1002/bio.4179
-
[80]
H. Li, N. Lopes, S. Moser, G. Sayler, S. Ripp, Biosens. Bioelectron. 33(2012) 299–303. doi: 10.1016/j.bios.2012.01.008
-
[81]
W. Dai, W. Zhao, Y. Ma, J. Ye, J. Jin, Electroanalysis 32(2020) 2018–2026. doi: 10.1002/elan.202000094
-
[82]
M. Liu, D. Wang, C. Liu, et al., Sens. Actuators B: Chem. 246(2017) 327–335. doi: 10.1016/j.snb.2017.02.076
-
[83]
S. Li, Y. Lu, L. Liu, et al., Sens. Actuators B: Chem. 285(2019) 34–41. doi: 10.1016/j.snb.2019.01.035
-
[84]
P. Escobedo, M.M. Erenas, A. Martínez-Olmos, et al., Biosens. Bioelectron. 141(2019) 111360. doi: 10.1016/j.bios.2019.111360
-
[85]
D. Zhang, Q. Liu, Biosens. Bioelectron. 75(2016) 273–284. doi: 10.1016/j.bios.2015.08.037
-
[86]
S. Di Nonno, R. Ulber, Analyst 146(2021) 2749–2768. doi: 10.1039/D1AN00025J
-
[87]
Y. Xia, Y. Chen, Y. Tang, et al., ACS Sens. 4(2019) 3298–3307. doi: 10.1021/acssensors.9b01927
-
[88]
C. Lertvachirapaiboon, A. Baba, K. Shinbo, K. Kato, Anal. Methods 10(2018) 4732–4740. doi: 10.1039/C8AY01561A
-
[89]
M. Bhaiyya, P.K. Pattnaik, S. Goel, Microfluid. Nanofluid. 25(2021) 41. doi: 10.1007/s10404-021-02442-x
-
[90]
Y. Yao, H. Li, D. Wang, C. Liu, C. Zhang, Analyst 142(2017) 3715–3724. doi: 10.1039/C7AN01008G
-
[91]
C. Liu, D. Song, Z. Yang, et al., Analyst 146(2021) 7611–7617. doi: 10.1039/D1AN01275D
-
[92]
K.L. Rahn, T.D. Rhoades, R.K. Anand, ChemElectroChem 7(2020) 1172–1181. doi: 10.1002/celc.202000079
-
[93]
A. Almuntashri, S. Agaian, IEEE Int. Conf. Syst. (2010) 3942–3947.
-
[94]
J. Pardede, M.G. Husada, A.N. Hermana, S.A. Rumapea, IEEE Int. Conf. Comput. Sci. Inf. Technol. (2019) 1–5.
-
[95]
V. Chernov, J. Alander, V. Bochko, Comput. Electr. Eng. 46(2015) 328–337. doi: 10.1016/j.compeleceng.2015.08.005
-
[96]
D.J. Bora, K.G. Anil, A.K. Fayaz, Int. J. Emerg. Technol. Adv. Eng. 2(2015) 192–203.
-
[97]
Y. Liu, R. Li, F. Liang, et al., Biosens. Bioelectron. 197(2022) 113781. doi: 10.1016/j.bios.2021.113781
-
[98]
J. Taylor, E. Ccopa-Rivera, S. Kim, et al., Sensors 21(2021) 6004. doi: 10.3390/s21186004
-
[99]
E. Ccopa Rivera, J.J. Swerdlow, R.L. Summerscales, et al., Sensors 20(2020) 625. doi: 10.3390/s20030625
-
[100]
E.C. Rivera, R.L. Summerscales, P.P. Tadi Uppala, H.J. Kwon, ChemistryOpen 9(2020) 854–863. doi: 10.1002/open.202000165
-
[101]
X. Wei, M.J. Zhu, H. Yan, C. Lu, J.J. Xu, Chem. Eur. J. 25(2019) 12671–12683. doi: 10.1002/chem.201902465
-
[102]
G. Moreno-Alcántar, A. Aliprandi, L. De Cola, Top. Curr. Chem. 379(2021) 31. doi: 10.1007/s41061-021-00343-9
-
[103]
S. Carrara, A. Aliprandi, C.F. Hogan, L. De Cola, J. Am. Chem. Soc. 139(2017) 14605–14610. doi: 10.1021/jacs.7b07710
-
[104]
T. Gao, J. Zhang, R. Yan, et al., Inorg. Chem. 57(2018) 4310–4316. doi: 10.1021/acs.inorgchem.7b03093
-
[105]
M. Saremi, A. Amini, H. Heydari, Microchim. Acta 186(2019) 254. doi: 10.1007/s00604-019-3352-6
-
[106]
J. Liu, J. Zhang, Z. Tang, et al., Chem. Sci. 10(2019) 4497–4501. doi: 10.1039/C9SC00084D
-
[107]
H. Gao, N. Zhang, J. Pan, et al., ACS Appl. Mater. Inter. 12(2020) 54012–54019. doi: 10.1021/acsami.0c18197
-
[108]
Z.F. Ding, B.M. Quinn, S.K. Haram, et al., Science 296(2002) 1293–1297. doi: 10.1126/science.1069336
-
[109]
P. Li, J. Yu, K. Zhao, A. Deng, J. Li, Biosens. Bioelectron. 147(2020) 111790. doi: 10.1016/j.bios.2019.111790
-
[110]
L. Wu, J. Wang, J. Ren, W. Li, X. Qu, Chem. Commun. 49(2013) 5675–5677. doi: 10.1039/c3cc42637h
-
[111]
Y. Hu, Y. Chen, Q. Tang, H. Liu, New J. Chem. 45(2021) 13196. doi: 10.1039/D1NJ90099D
-
[112]
J. Liu, J. Zhang, Y. Zhou, et al., Anal. Chem. 93(2021) 10890–10897. doi: 10.1021/acs.analchem.1c01258
-
[113]
X. Tan, B. Zhang, G. Zou, J. Am. Chem. Soc. 139(2017) 8772–8776. doi: 10.1021/jacs.7b05073
-
[114]
H. Peng, Z. Huang, Y. Sheng, et al., Angew. Chem. Int. Ed. 58(2019) 11691–11694. doi: 10.1002/anie.201905007
-
[115]
Y. Nie, X. Tao, Y. Zhou, et al., Anal. Chem. 93(2021) 1120–1125. doi: 10.1021/acs.analchem.0c04165
-
[116]
Y. Zhou, Y. Chai, R. Yuan, Anal. Chem. 91(2019) 14618–14623. doi: 10.1021/acs.analchem.9b03736
-
[117]
J. Shi, Y. Zhang, P. Wang, Y. Nie, Q. Ma, Talanta 237(2022) 122969. doi: 10.1016/j.talanta.2021.122969
-
[118]
N. Wang, L. Chen, W. Chen, H. Ju, Anal. Chem. 93(2021) 5327–5333. doi: 10.1021/acs.analchem.1c00620
-
[119]
N. Wang, Y. Feng, Y. Wang, H. Ju, F. Yan, Anal. Chem. 90(2018) 7708–7714. doi: 10.1021/acs.analchem.8b01610
-
[120]
B. Babamiri, R. Hallaj, A. Salimi, Sens. Actuators B: Chem. 254(2018) 551–560. doi: 10.1016/j.snb.2017.07.016
-
[121]
L. Wang, X. Shi, Y. Zhang, et al., Electrochim. Acta 362(2020) 137107. doi: 10.1016/j.electacta.2020.137107
-
[122]
D. Jiang, M. Wei, X. Du, et al., Chem. Eng. J. 430(2022) 132771. doi: 10.1016/j.cej.2021.132771
-
[123]
X. Jiang, H. Wang, Y. Shen, N. Hu, W. Shi, Sens. Actuators B: Chem. 350(2022) 130891. doi: 10.1016/j.snb.2021.130891
-
[124]
Y. Wang, Y. Li, X. Zhuang, et al., Biosens. Bioelectron. 190(2021) 113371. doi: 10.1016/j.bios.2021.113371
-
[125]
L. Li, W. Zhao, J. Zhang, et al., J. Colloid Interface Sci. 608(2022) 1151–1161. doi: 10.1016/j.jcis.2021.10.106
-
[126]
Y. Duan, Y. Song, N. Fan, et al., Biosens. Bioelectron. 197(2022) 113784. doi: 10.1016/j.bios.2021.113784
-
[127]
H. Peng, Z. Huang, H. Deng, et al., Angew. Chem. Int. Ed. 59(2019) 9982–9985.
-
[128]
Y. Zhang, G. Xu, G. Lian, et al., Biosens. Bioelectron. 147(2020) 111789. doi: 10.1016/j.bios.2019.111789
-
[129]
C. Yan, L. Yang, L. Yao, et al., Anal. Chem. 92(2020) 14122–14129. doi: 10.1021/acs.analchem.0c03132
-
[130]
J. Ge, Y. Zhao, C. Li, G. Jie, Anal. Chem. 91(2019) 3546–3554. doi: 10.1021/acs.analchem.8b05362
-
[131]
Y. Xu, Y. Zhang, X. Sui, et al., Sens. Actuators B: Chem. 344(2021) 130266. doi: 10.1016/j.snb.2021.130266
-
[132]
Y. Liu, Y. Wei, Y. Cao, et al., Biosens. Bioelectron. 117(2018) 830–837. doi: 10.1016/j.bios.2018.07.008
-
[133]
Y. Zhou, J. Li, X. Fu, et al., ACS Appl. Mater. Interfaces 12(2020) 338–346. doi: 10.1021/acsami.9b19246
-
[134]
W. Huang, G. Hu, L. Yao, et al., Anal. Chem. 92(2020) 3380–3387. doi: 10.1021/acs.analchem.9b05444
-
[135]
Y. Yang, G.B. Hu, W.B. Liang, et al., Nanoscale 12(2020) 5932–5941. doi: 10.1039/C9NR10712F
-
[136]
X. Yang, Y. Yu, L. Peng, et al., Anal. Chem. 90(2018) 3995–4002. doi: 10.1021/acs.analchem.7b05137
-
[137]
S. Dou, C. Dong, Z. Hu, et al., Adv. Funct. Mater. 27(2017) 1702546. doi: 10.1002/adfm.201702546
-
[138]
G. Zhang, C. Cai, S. Cosnier, et al., Nanoscale 8(2016) 11649–11657. doi: 10.1039/C6NR01206J
-
[139]
H. Shao, J. Lu, Q. Zhang, et al., Sens. Actuators B: Chem. 268(2018) 39–46. doi: 10.1016/j.snb.2018.04.088
-
[140]
Q. Huang, F. Luo, C. Lin, et al., Biosens. Bioelectron. 189(2021) 113374. doi: 10.1016/j.bios.2021.113374
-
[141]
D. Bahari, B. Babamiri, K. Moradi, A. Salimi, R. Hallaj, Biosens. Bioelectron. 195(2022) 113657. doi: 10.1016/j.bios.2021.113657
-
[142]
G.B. Hu, C.Y. Xiong, W.B. Liang, et al., ACS Appl. Mater. Interfaces 10(2018) 15913–15919. doi: 10.1021/acsami.8b05038
-
[143]
W. Huang, G. Hu, W. Liang, et al., Anal. Chem. 93(2021) 6239–6245. doi: 10.1021/acs.analchem.1c00636
-
[144]
D. Feng, X. Tan, Y. Wu, et al., Biosens. Bioelectron. 129(2019) 100–106. doi: 10.1016/j.bios.2018.12.050
-
[145]
Z. Che, X. Wang, X. Ma, S.N. Ding, Coord. Chem. Rev. 446(2021) 214116. doi: 10.1016/j.ccr.2021.214116
-
[146]
X. Da, H. Liu, X. Zhou, W. Liu, X. Yang, Anal. Chem. 88(2016) 10191–10197. doi: 10.1021/acs.analchem.6b02772
-
[147]
D.H. D'Souza, L.A. Jaykus, J. Appl. Microbiol. 95(2003) 1343–1350. doi: 10.1046/j.1365-2672.2003.02106.x
-
[148]
N.F.N. Azam, S. Roy, S.A. Lim, M. Uddin Ahmed, Food Chem. 248(2018) 29–36. doi: 10.1016/j.foodchem.2017.12.046
-
[149]
J. Yang, Q. Xia, L. Guo, et al., Chem. Commun. 56(2020) 6692–6695. doi: 10.1039/C9CC09706F
-
[150]
Z. Fan, B. Yao, Y. Ding, et al., Chem. Eng. J. 427(2022) 131686. doi: 10.1016/j.cej.2021.131686
-
[151]
Y. Lei, J. Zhou, Y. Chai, Y. Zhou, R. Yuan, Anal. Chem. 90(2018) 12270–12277. doi: 10.1021/acs.analchem.8b03623
-
[152]
M. Zhao, L. Bai, W. Cheng, et al., Biosens. Bioelectron. 127(2019) 126–134. doi: 10.1016/j.bios.2018.12.009
-
[153]
S. Bi, S. Yue, S. Zhang, Chem. Soc. Rev. 46(2017) 4281–4298. doi: 10.1039/C7CS00055C
-
[154]
L. Wang, P. Liu, Z. Liu, et al., ACS Sens. 5(2020) 3584–3590. doi: 10.1021/acssensors.0c01864
-
[155]
J.F.C. Loo, A.H.P. Ho, A.P.F. Turner, W.C. Mak, Trends Biotechnol. 37(2019) 1104–1120. doi: 10.1016/j.tibtech.2019.03.009
-
[156]
S. Wang, N. Liu, L. Zheng, G. Cai, J. Lin, Lab Chip 20(2020) 2296–2305. doi: 10.1039/D0LC00290A
-
[157]
A. Ganguli, A. Ornob, H. Yu, et al., Biomed. Microdevices 19(2017) 73. doi: 10.1007/s10544-017-0209-9
-
[158]
K. Kadimisetty, S. Malla, J.F. Rusling, ACS Sens. 2(2017) 670–678. doi: 10.1021/acssensors.7b00118
-
[159]
K. Kadimisetty, S. Malla, K.S. Bhalerao, et al., Anal. Chem. 90(2018) 7569–7577. doi: 10.1021/acs.analchem.8b01198
-
[1]
-
Figure 2 The development of electrode arrays for high-throughput analysis. (a) SPE array. Reproduced with permission [38]. Copyright 2011, Elsevier. (b) C-BPE array. Reproduced with permission [39]. Copyright 2020, American Chemical Society. (c) ITO electrode array. Reproduced with permission [36]. Copyright 2018, Royal Chemical Society. (d) Array of ultramicro-BPEs. Reproduced with permission [44]. Copyright 2020, American Chemical Society. (e) Ultra-high-density gold microwell electrode array. Reproduced with permission [47]. Copyright 2021, Frontiers.
Figure 3 Diagrams and images of the excitation voltage generator for portable ECL sensing devices. (a) The electronic circuit powered by a rechargeable lithium-ion battery, and (b) the smartphone-controlled potentiostat: ⅰ. Diagram of the electronic circuit; ⅱ. Photo of the PCB. (a–i) Reproduced with permission [54]. Copyright 2011, Elsevier. (a–ii) Reproduced with permission [82]. Copyright 2017, Elsevier. (b) Reproduced with permission [59]. Copyright 2021, Elsevier.
Figure 4 Light shielding dark box. (a) Fabrication by a Form 1+ 3D printer using EP Epoxy Resin. Reproduced with permission [67]. Copyright 2020, American Chemical Society. (b) Design by LEGO Digital Designer software and assembled manually with LEGO bricks. Reproduced with permission [73]. Copyright 2018, American Chemical Society.
Figure 5 Portable ECL devices using different photoelectric converters. (a) PD. Reproduced with permission [75]. Copyright 2012, Elsevier. Reproduced with permission [77]. Copyright 2015, Elsevier. (b) PMT (H10722). Reproduced with permission [79]. Copyright 2022, Wiley. (c) SiPM. Reproduced with permission [72]. Copyright 2022, Elsevier. (d) CCD camera. Reproduced with permission [82]. Copyright 2017, Elsevier. (e) COMS camera-equipped smartphone. Reproduced with permission [56]. Copyright 2022, Elsevier.
Figure 7 (a) Language algorithms enhance ECL signals. Reproduced with permission [56]. Copyright 2022, Elsevier. (b) Artificial neural network is constructed on smartphone to realize ML. Reproduced with permission [56]. Copyright 2022, Elsevier. (c) Process of multimodal data collection and prediction process through ML. Reproduced with permission [98]. Copyright 2021, MPDI.
Figure 8 ECL signal tags based on ECL luminophores-encapsulated nanomaterials. (a) PEDOT-hosted AgNCs. Reproduced with permission [115]. Copyright 2021, American Chemical Society. (b) ATT-protected AuNCs. Reproduced with permission [127]. Copyright 2019, Wiley. (c) DNA nanoclews loaded with Ru(phen)32+. Reproduced with permission [128]. Copyright 2020, Elsevier.
Figure 9 MOF-based ECL luminophores. (a) 2D Ru-MOF nanosheets. Reproduced with permission [139]. Copyright 2018, Elsevier. (b) Ru@MOF@Ru-NCND@SmS2 QDs. Reproduced with permission [141]. Copyright 2022, Elsevier. (c) Ru-PCN-777. Reproduced with permission [142]. Copyright 2018, American Chemical Society.
Figure 10 Different nucleic acid amplification strategies. (a) Dual wavelength ratiometric ECL biosensor with target recycling by chain displacement reaction and bipedal DNA walker amplification strategies. Reproduced with permission [150]. Copyright 2022, Elsevier. (b) Testing of cytomegalovirus pp65 antibody via smart circular peptide-DNA nanomachine amplification and silver nanoflowers loaded with luminophores. Reproduced with permission [151]. Copyright 2018, American Chemical Society. (c) HCR and magnetic assisted enrichment. Reproduced with permission [131]. Copyright 2021, Elsevier. (d) Tripedal DNA Walker. Reproduced with permission [154]. Copyright 2020, American Chemical Society.
Figure 11 Automated portable ECL devices. (a) Overall schematic diagram. (b) 3D-printed microfluidic array and sandwich immunoassay strategy. (c) Physical picture of automation device and its touch operation page. (d) Side view of automation setup showing all the components. Reproduced with permission [159]. Copyright 2018, American Chemical Society.
-

 DownLoad:

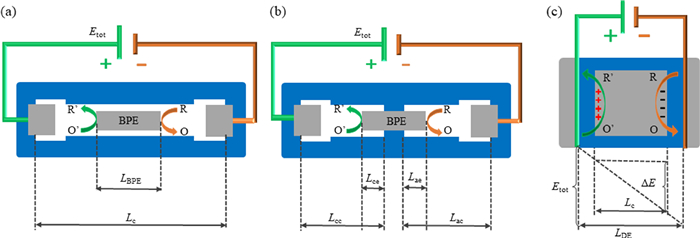
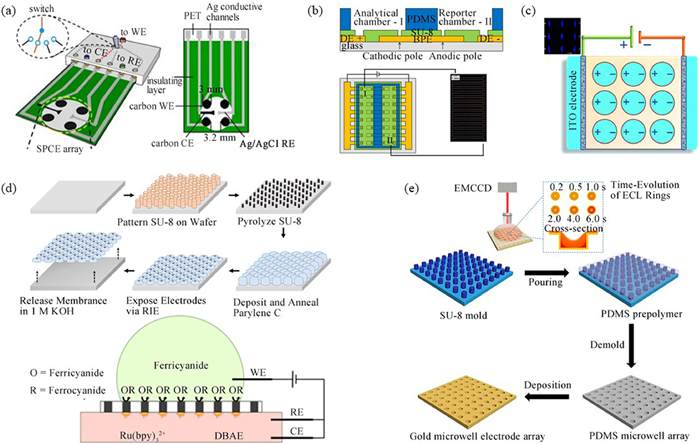
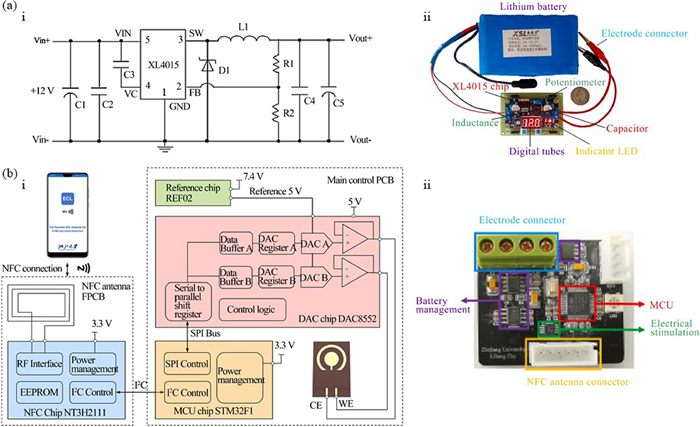
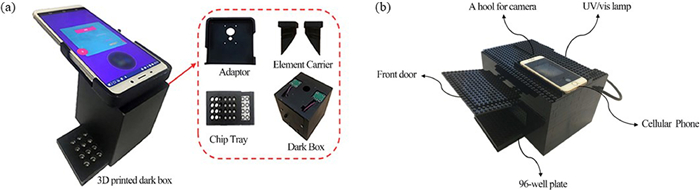
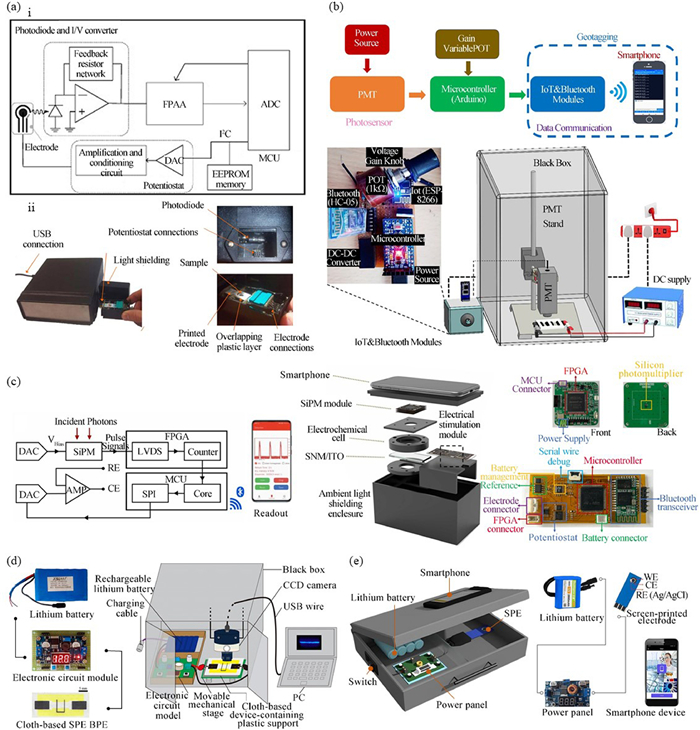
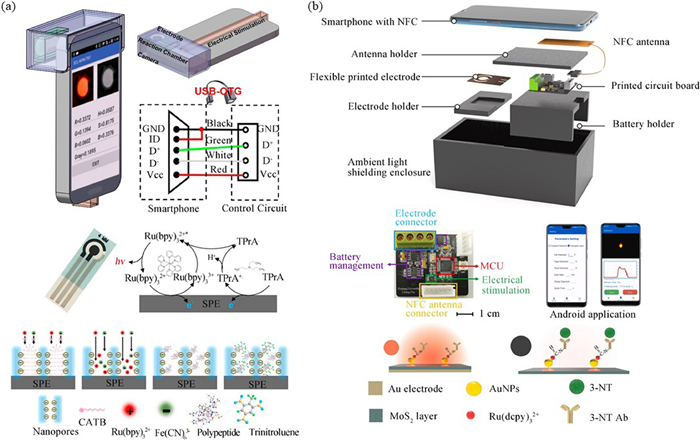
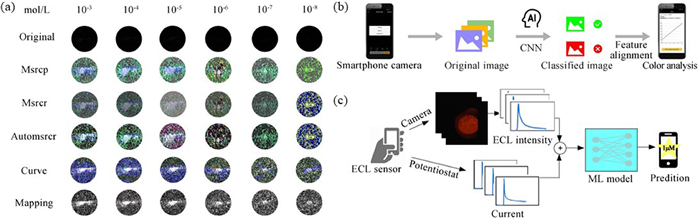
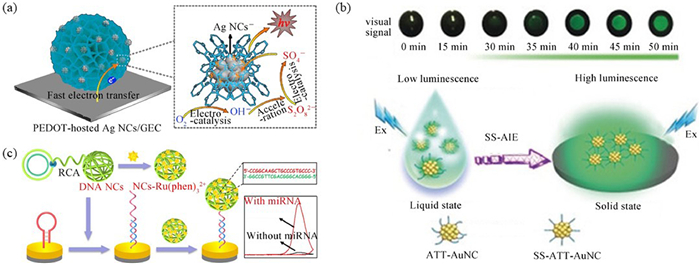
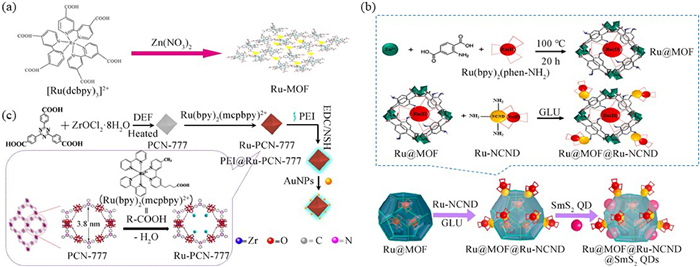
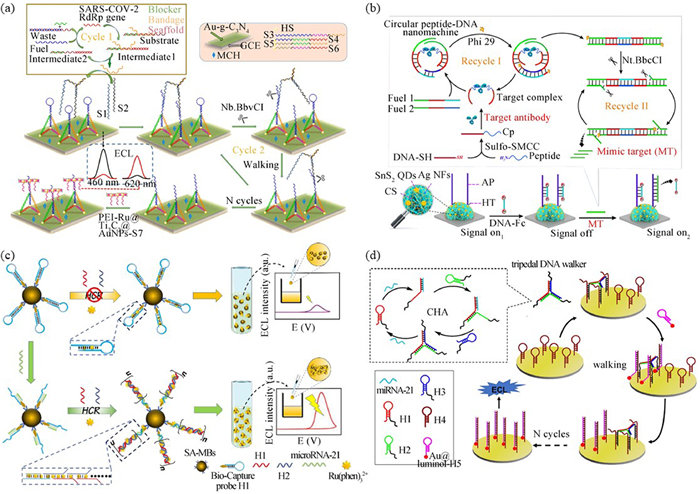
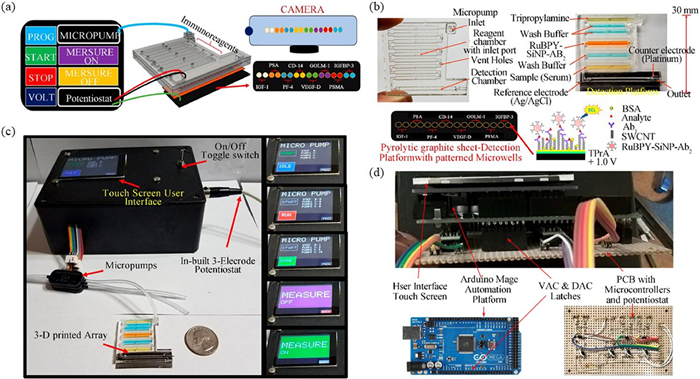

 下载:
下载:


 扫一扫看文章
计量
- PDF下载量: 13
- 文章访问数: 1431
- HTML全文浏览量: 64
