Received Date:
03 June 2022 Accepted Date:
26 July 2022 Revised Date:
14 July 2022 Available Online:
15 June 2023
Abstract:
Increasing the charging cut-off potential of lithium cobalt oxide (LiCoO2, LCO) can effectively improve the energy density of the lithium-ion batteries, which are the mainstream energy storage devices used in 3C electronic products. However, the continuous decomposition of the electrolyte and dissolution of Co from the electrode will occur at high-potential operation, which deteriorate the performances of LCO. Here, a cathode-electrolyte interface (CEI) layer containing MgF2 is constructed to enhance the electrochemical stability of LCO at 4.6 V (vs. Li+/Li). The Mg2+ added to the cathode gradually releases into the electrolyte during cycling, which forms a stable MgF2-rich protective layer. In addition, 1,1,2,2-tetrafluoroethyl-2,2,3,3-tetrafluoropropylether (TTE) is added to the electrolyte acting as a F source to increase the content of MgF2 in the CEI layer. The MgF2-rich CEI layer effectively suppresses the decomposition of electrolyte components and the dissolution of Co of LCO, which makes the Li||LiCoO2 (Li||LCO) cell cycled stably at 3~4.6 V (vs. Li+/Li) in 200 cycles with a retention of 83.9%.
In the field of consumer electronics, LCO occupies the most of the market among the optional energy storage devices [1–4] because of its convenient synthetic process, high compact density, high-potential plateau and excellent cycle stability [5–8]. In order to improve the energy density of the lithium-ion batteries, the cut-off charging potential of commercial LCO has been increased from 4.2 V to 4.5 V (vs. Li+/Li), and the corresponding specific capacity has been increased from 140 mAh/g to 185 mAh/g [9]. The specific capacity of LCO can be further increased to 220 mAh/g when the charging potential reaches 4.6 V (vs. Li+/Li), and then there will be continues decomposition of the electrolyte [10–12] and Co dissolution of LCO [13–15], which deteriorate the electrochemical performances of LCO.
In order to address these issues, surface modifications of cathode materials have been extensively conducted, such as coating electrode particles by alloy, ceramic, carbon [16–22] which improves the cycling stability of oxide electrodes at 4.6 V (vs. Li+/Li) significantly. However, the cumbersome produce processes hinder the commercial application of these surface modification methods, and CEI layer design is considered as more convenient and effective. Fluorinated solvents [23,24], high-concentration electrolytes [25–27], film-forming electrolyte additives [12,28–34] are the commonly used CEI layer designing-methods. Through these methods, the electrochemical stability of the interface between cathode and electrolyte is greatly improved and the cycle performance of LCO at high voltage is enhanced, especially the using of film-forming additives. These additives decompose into a surface coating during cycling, which in turn protect the LCO cathode. However, most of the additives are organic compounds, such as aromatic compounds [28], thiophene derivatives [30], VEC [35], which present poor cycle stability when battery operating at high-voltage.
Considering that polyvalent metallic fluoride has high electrochemical stability and the cathode material with MgF2 coating can work stably at 4.9 V (vs. Li+/Li) [36,37], we propose a MgF2 surface coating method via in situ electrochemical reaction in this work. ClO4− based salts present relative low solubility, good electrochemical stability at high potential and there are few reports mention that ClO4− or its decomposition products participate in building CEI [38,39], which make Mg(ClO4)2 (MCO) gradually released from porous electrodes and the anion is not involved in the forming of CEI on cathodes. Thus Mg(ClO4)2 was chosen as the source of Mg2+ in this work. During cycling, the added MCO is gradually released from cathode into electrolyte, and a favorable MgF2 coating is formed on the LCO cathode surface, which protects LCO cathode for its extremely high electrochemical stability. In addition, 1,1,2,2-tetrafluoroethyl-2,2,3,3-tetrafluoropropylether (TTE) can be decomposed before 3.5 V vs. Li+/Li to generate F-containing species [40], thus it is added as an F source in electrolyte to synergistically modified the electrochemical performance of LCO at 4.6 V (vs. Li+/Li).
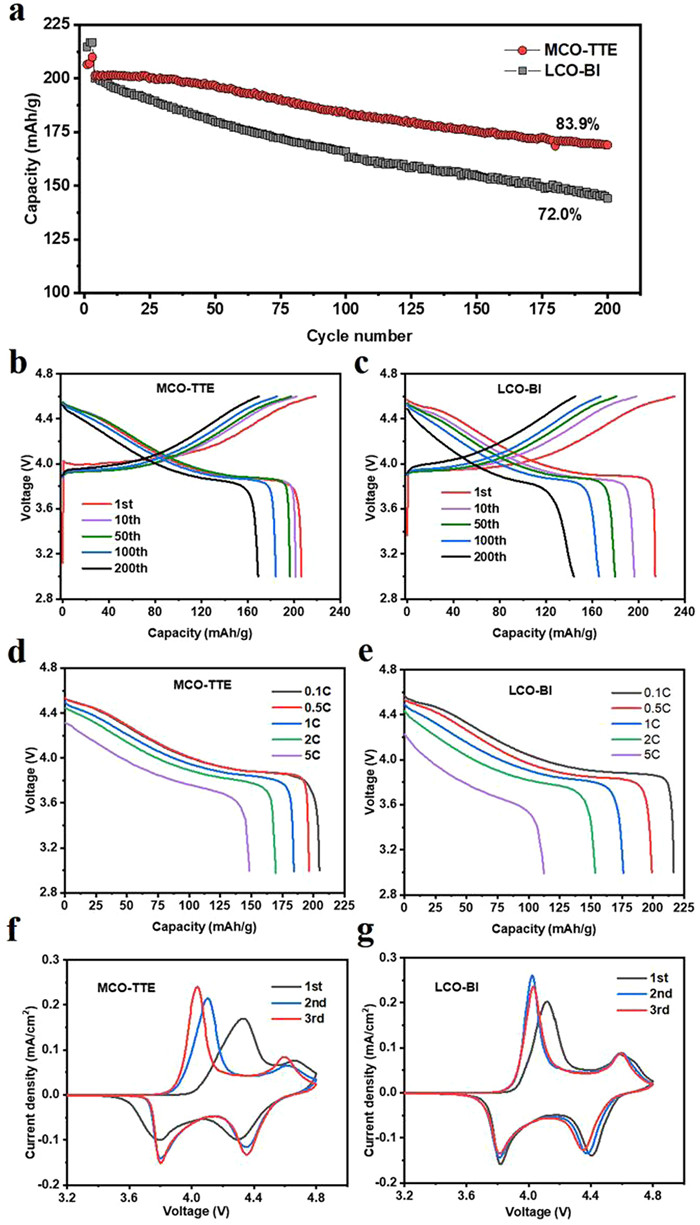
The baseline electrolyte (Bl) is obtained by dissolving 1 mol/L LiPF6 in EC/DMC/PC (10:45:45 by volume). And the optimized electrolyte is obtained by adding 10 vol% TTE to the baseline electrolyte, denoted as Bl + 10% TTE. The electrochemical performances of MCO-TTE (Li||LiCoO2 half-cell whose cathode is LiCoO2 (LCO) + 1% MCO and electrolyte is Bl + 10% TTE) and LCO-Bl (Li||LCoO2 half-cell whose cathode is LiCoO2 and electrolyte is Bl) are shown in Fig. 1. Obviously, MCO-TTE presents better cycle performance than LCO-Bl (Fig. 1a). In 200 cycles, the specific capacity of MCO-TTE is 169 mAh/g, retaining 83.9% of the initial capacity (201.4 mAh/g). By contrast, LCO-Bl shows a capacity of only 144 mAh/g in 200 cycles, 72% of the initial capacity of 200.1 mAh/g.
Figure 1
Figure 1.
(a) Cycle performances (activated with 0.1 C (1 C = 274 mA/g) for three cycles and then cycled with 0.5 C, (b, c) charging-discharging curves (3~4.6 V vs. Li+/Li), (d, e) discharge curves, and (f, g) CV curves (scan rate: 0.1 mV/s) of MCO-TTE (LCO + 1% MCO cathode and Bl + 10% TTE electrolyte) and LCO-Bl (LCO cathode and Bl electrolyte).
Also, MCO-TTE exhibits higher initial coulombic efficiency (94.4% vs. 92.8%) and average coulombic efficiency (99.5% vs. 99.2%), which means there are fewer side reactions in MCO-TTE sample than those in LCO-Bl. The charging-discharging curves shown in Figs. 1b and c confirm that MCO-TTE generates lower over-potential than LCO-Bl. The voltage polarization of MCO-TTE is relative larger in the first cycle, which should be attributed to the coulombic effect between ClO4− and Li+ hinders the transport of Li+ in the cathode [41]. In addition, MCO-TTE exhibits better rate performance than LCO-Bl, whose discharge capacity is 148.6 mAh/g at 5 C, much higher than 112.3 mAh/g of LCO-Bl (Figs. 1d and e). Furthermore, cyclic voltammetry (CV) test was carried to investigate the electrochemical reversibility of MCO-TTE and LCO-Bl. The result is shown in Figs. 1f and g. Compared with LCO-Bl, MCO-TTE shows greater voltage polarization in the first cycle only. And in the second and third cycle, the voltage polarization of the MCO-TTE decreases and the electrochemical reversibility increases. This phenomenon shows that the reversible capacity of the MCO-TTE increases with the progress of the cycling, which is consistent with the test results of the cycle performance (Fig. 1a). Furthermore, TTE is oxidized before 3.5 V (vs. Li+/Li) and forms fluorinated ether fragments [42], which result in the larger polarization and lower capacity than other samples as shown in cycle and CV tests (Figs. 1a, f and g). Then the cell's polarization decreases and the capacity increases in the following cycles, which should be related to the decomposing of the organic deposits. The products such as LiF and fluorocarbons which are stable at high potential make up the passivation layer on cathode [40,42]. The third CV curve of MCO-TTE, which is very similar as that of LCO-Bl, suggests the end of the surface layer forming process on LCO and presents a good capacity of the TTE added cell which is not lower than those of other samples.
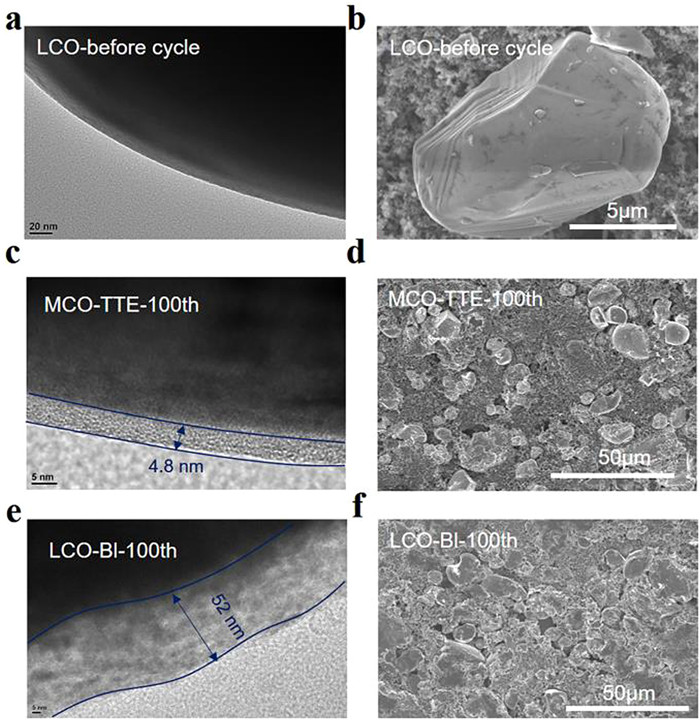
Fig. S1 (Supporting information) shows that Mg and Cl are evenly distributed on the surface of as-fabricated MCO-TTE, meaning Mg (ClO4)2 is evenly distributed on the porous electrode. Then the morphologies of the LCO electrodes after cycling in the potential range of 3.0~4.6 V (vs. Li+/Li) were characterized by transmission electron microscopy (TEM) and scanning electron microscopy (SEM), as shown in Fig. 2. The surfaces of LCO particles before cycling are clean and smooth (Figs. 2a and b, Fig. S2a in Supporting information). In 100 cycles, MCO-TTE sample shows a uniform interfacial layer with a thickness of about 4.8 nm on the LCO particles (Figs. 2c and d, Fig. S2b in Supporting information). As a contrast, there is an obvious sediment layer on LCO-Bl (Fig. S2c in Supporting information) which is ~52 nm (Fig. 2e) and much thicker than that of MCO-TTE. These mean the electrolyte cycled in LCO-Bl experienced a stronger oxidative decomposition than that in MCO-TTE.
Figure 2
Figure 2.
TEM and SEM images of LCO cathodes (a, b) before and after 100 cycles in (c, d) MCO-TTE and (e, f) LCO-Bl.
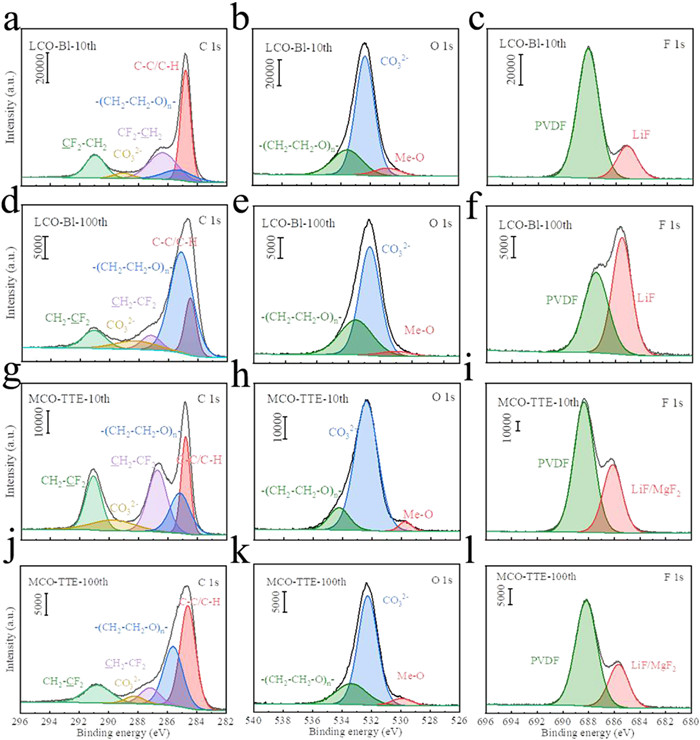
The components and structures of the cycled LCO cathode were analyzed by Fourier transform infrared spectroscopy (FTIR), X-ray photoelectron spectroscopy (XPS) and X-ray diffraction (XRD). FTIR spectra show that there are similar components on the surfaces of MCO-TTE and LCO-Bl electrodes (Fig. S3 in Supporting information). The peaks ~1285 and 1475 cm−1 should be related to the vibration of C—O and C—H, which come from the decomposition of the solvents. Considering the oxidative decomposition mechanism of TTE [40,42], these can be explained as the organic fragments of TTE are washed in preparation of samples for measurement. Fig. 3 is the XPS spectra of LCO cathode cycled in MCO-TTE and LCO-Bl for 10 and 100 cycles. After 10 cycles in LCO-Bl, the peaks of 288.5 and 285.8 eV in C 1s spectra paired with the peaks of 533.8 and 532.7 eV in O 1s spectra indicate a large amount of polyether carbon (-CH2CH2O-)n (C—O) and Li2CO3 (C=O) are formed on the LCO cathode [43,44]. The polyether carbon is derived from the ring-opening polymerization of EC [45], which indicates that the electrolyte solvent is decomposed on the surface of the cathode. A fitted peak of O 1s spectra at 529.8 eV is ascribed to Co-O of LCO cathode [46]. Besides, a peak at 685 eV can be detected in F 1s spectrum, which corresponds to LiF, the decomposition product of LiPF6 [47]. After 100 cycles in LCO-Bl, the content of polyether carbon on LCO cathode increases. It is worth noting that the LiF content greatly increases after 100 cycles in LCO-Bl, which indicates LiPF6 continually decomposes with the cycling of LCO-Bl. The interfacial compositions after cycling in MCO-TTE are similar to that in LCO-Bl, and the peak at 685 eV may also be MgF2 due to the similar binding energies of LiF and MgF2 [48,49]. After 100 cycles, the content of polyether carbon increases slightly. However, different from the results of cycling in LCO-Bl, the LiF/MgF2 content decreases cycling for 100 cycles in MCO-TTE, indicating that there is no continuous decomposition of LiPF6. The results show that the decomposition of solvents and lithium salt is suppressed in MCO-TTE, which may benefit from the formation of MgF2 at the interface between cathode and electrolyte. XRD pattern exhibit the similar results. Fig. S4 (Supporting information) shows there is no shifting of the LCO peaks can be detected in the XRD pattern, suggesting the structures of the LCO cathodes are not changed before and after cycling. However, there is a faint peak at 42.13° in the XRD pattern of cycled MCO-TTE, meaning the existing of MgF2.
Figure 3
Figure 3.
The C 1s, O 1s and F 1s XPS spectra of LCO cathode after (a–c) 10 and (d–f) 100 cycles in LCO-Bl. The C 1s, O 1s and F 1s XPS spectra of LCO cathode after (g–i) 10 and (j–l) 100 cycles in MCO-TTE.
To further confirm the existence of the MgF2 coating layer and explore the effect of TTE more precisely, energy dispersive spectroscopy (EDS) and XPS were carried to characterize the LCO cathode after cycling in MCO-TTE. As shown in Figs. S5a and b (Supporting information), the element F and Mg are uniformly distributed on the surface of LCO particles. And the peak of Mg 1s spectra locate in 1304.95 eV corresponding to MgF2 (Fig. S5c in Supporting information). In addition, the content of MgF2 cycled in MCO-TTE is higher than that cycled in MCO-Bl (Figs. S5c and d in Supporting information) whose cathode containing 1% MCO and electrolyte is Bl. These results indicate that TTE added to the electrolyte can increase the content of MgF2 in the CEI layer and TTE plays a synergistic effect with MCO to enhance electrochemical stability of the interface between LCO cathode and electrolyte.
Then, the Co loss of the cathode after cycling in different electrolytes was also investigated by XPS spectrum. As shown in Fig. S6 (Supporting information), the spectral peaks located at 797 eV and 782 eV correspond to Co 2p1/2 and Co 2p3/2 of LCO. And there are stronger Co signal peaks on the surface of the LCO cathode after cycling in LCO-Bl, even though the CEI layer cycled in LCO-Bl is thicker than that in MCO-TTE. These indicate that the LCO electrode cycled in LCO-Bl undergoes more severe side reactions with the electrolyte, resulting in the participation of Co in the CEI layer [43].
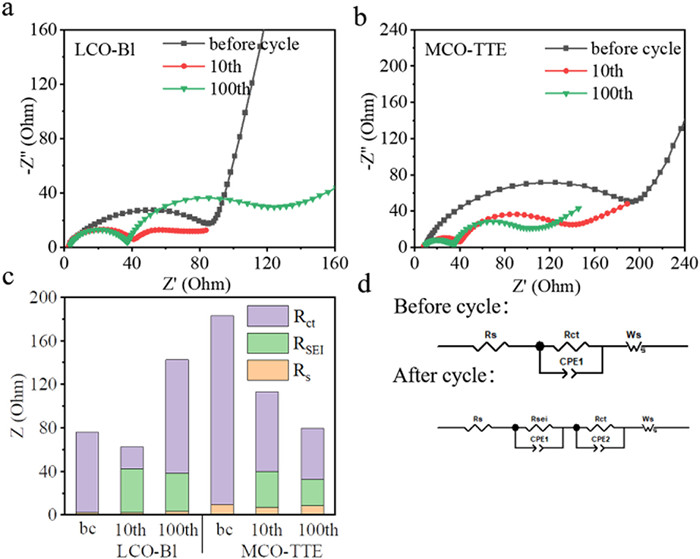
Electrochemical impedance spectroscopy (EIS) measurements of the Li||LCO cells before cycling and cycled for 10 and 100 cycles in MCO-TTE and LCO-Bl were carried out (Fig. 4). The first intersection of the Nyquist plots in Figs. 4a and b with the real axis is Rs, which is ohmic impedance of the half-cell; the semi-circle located at high and middle frequencies are related to the resistance of lithium-ion migration through electrode-electrolyte interphase (RSEI) and the interfacial charge transfer resistance (Rct) respectively; and the liner tail located at low frequency corresponds to the resistance of solid-state lithium-ion diffusion in the electrode materials, which is defined as Warburg impendence (Ws) [43,50–52]. MCO-TTE exhibits larger Rct than LCO-Bl before cycling, and the possible reason is that MCO is an insulator which hinders the transmission of electron. In the subsequent cycles, the RSEI of LCO-Bl has no obvious change, varies from 39.9 Ω (10 cycles) to 34.9 Ω (100 cycles), and the Rt dramatically increases from 20.3 Ω (10 cycles) to 104.3 Ω (100 cycles). The rapid increase of the resistance originates from the continuous decomposition of the electrolyte solvent and lithium salt [43], matching the TEM and XPS results. In comparison, the RSEI of MCO-TTE is almost unchanged, and the Rct even decreased slightly from 10 cycles to 100 cycles (Fig. 4c and Table S1 in Supporting information). The reason should be that the LiF content in the CEI layer decreases after cycling in MCO-TTE, which avoids the continuous increase of interfacial impedance caused by LiF with low ionic conductivity [53].
Figure 4
Figure 4.
Nyquist plots of the Li||LCO cells in (a) LCO-Bl and (b) MCO-TTE before and after 10 and 100 cycles. (c) Impedance fitting results. (d) The equivalent circuit models before (top) and after (bottom) cycle used for EIS spectra fitting.
Then the mechanism of MCO improving the electrochemical performance of Li||LCO cells is investigated. As shown in Fig. S7a (Supporting information), the cycle performance of Li||LCO cells after adding MCO to the electrolyte is different from that added to the cathode. The cycle performance of Li||LCO cell with Bl + 0.5% MCO as electrolyte (red line) is similar to other simples’ at the initial cycle but worse than the LCO + 1% MCO (blue line) or LCO + 2% MCO (green line) cathodes after activation. These is similar to LiODFB used as additive on layered oxide electrode [54] and should be related to the large overpotential of Bl + 0.5% MCO presented at the 70th cycle (Fig. S7b in Supporting information). Moreover, the capacity of the battery using LCO + 1% MCO (or LCO + 2% MCO) as the cathode gradually increased in the first 30 cycles of the cycle. Basing on these, it is speculated that the MCO added to the cathode may be gradually released into the electrolyte with the progress of the cycle. This guess has been confirmed by inductive coupled plasma emission spectrometer (ICP) test in Fig. S7c (Supporting information). The cathode chip containing 1% MCO was soaked in the Bl + 10% TTE electrolyte, and samples at different set time were taken for ICP testing. The concentration of Mg2+ increases linearly with the immersion time of the cathode chip, which confirms our conjecture that the MgF2-containing CEI layer formed by the slow release of Mg2+ from the LCO cathode to electrolyte improves the reversible capacity of the battery.
In addition, the Mg 1s XPS spectra in Figs. S5c and d suggest that TTE can work synergistically with Mg2+ to constructed MgF2-containing CEI layer. Basing on these, the mechanism of MCO and TTE is speculated as follow: MCO in the cathode gradually dissolves in the electrolyte with battery cycling, and combines with fluorine-containing substances in the battery such as LiPF6, PVDF or TTE to form MgF2. The MgF2-containing CEI layer inhibits the decomposition of the electrolyte and the loss of Co of LCO cathode, avoiding the increase of impedance, thus improving the electrochemical performance of the LCO at 4.6 V (vs. Li+/Li). There is no ClO4− or its decomposition product detected in the XRD, XPS and FTIR measurements of cycled cathodes, meaning ClO4− is not involved in the forming of CEI.
In order to understand the electrochemical stability of the electrolyte composition on the lithium anode, Li||Li symmetrical cells with different electrolytes were tested. As shown in Fig. S8 (Supporting information), the Li||Li symmetrical cell utilizing Bl+TTE+MCO electrolyte shows better cycle performance, whose polarization voltage is only 0.28 V under the cycling in 760 h, whereas the voltage polarization of Li||Li symmetrical cell using Bl electrolyte reaches 0.56 V in 640 h. These results suggest that the presence of Mg2+, ClO4− and TTE in electrolyte does not deteriorate the performance of lithium anode.
In this paper, we introduce a simple method to construct the MgF2 protective layer, which effectively improves the performances of LCO at 4.6 V (vs. Li+/Li). The Mg2+ added to the cathode is gradually released into the electrolyte, and MgF2 is formed on the surface of cathode in situ during the electrochemical process. In addition, the TTE added to the electrolyte can act as a F source and increase the content of MgF2 in the interfacial layer. The MgF2-containing CEI layer effectively suppresses the decomposition of electrolyte components, and reduces Co loss of LCO cathode. Benefiting from the synergistic effect of MCO and TTE, the capacity of Li||LCO cell remains 169 mAh/g in 200 cycles, and presents 148.6 mAh/g at 5 C, much better than those of the unmodified cell. The interface layer building strategy proposed in this paper provides a candidate technological path for the production of high voltage lithium-ion batteries, and may be expanded to the related energy storage devices such as all/semi-solid-state batteries.
Declaration of competing interest
The authors declare that they have no known competing financial interests or personal relationships that could have appeared to influence the work reported in this paper.
Acknowledgments
This work was supported by National Natural Science Foundation of China (Nos. 22075172 and 22075170) and the Opening Project of Key Laboratory of Optoelectronic Chemical Materials and Devices of Ministry of Education, Jianghan University (No. JDGD-202221).
Supplementary materials
Supplementary material associated with this article can be found, in the online version, at doi:10.1016/j.cclet.2022.07.054.
R. Scipioni, D. Isheim, S.A. Barnett, Appl. Mater. Today 20 (2020) 100748. doi: 10.1016/j.apmt.2020.100748
[51]
D. Takamatsu, Y. Koyama, Y. Orikasa, et al., Angew. Chem. Int. Ed. 51 (2012) 11597-11601. doi: 10.1002/anie.201203910
[52]
C. Tan, L. Cui, Y. Li, et al., ACS Appl. Mater. Interfaces 13 (2021) 18314-18323. doi: 10.1021/acsami.1c01979
[53]
J. Tan, J. Matz, P. Dong, et al., Adv. Energy Mater. 11 (2021) 2100046. doi: 10.1002/aenm.202100046
[54]
L. Zhang, Y. Ma, X. Cheng, et al., Solid State Ion. 263 (2014) 146-151. doi: 10.1016/j.ssi.2014.06.001
Figure 1
(a) Cycle performances (activated with 0.1 C (1 C = 274 mA/g) for three cycles and then cycled with 0.5 C, (b, c) charging-discharging curves (3~4.6 V vs. Li+/Li), (d, e) discharge curves, and (f, g) CV curves (scan rate: 0.1 mV/s) of MCO-TTE (LCO + 1% MCO cathode and Bl + 10% TTE electrolyte) and LCO-Bl (LCO cathode and Bl electrolyte).
Figure 3
The C 1s, O 1s and F 1s XPS spectra of LCO cathode after (a–c) 10 and (d–f) 100 cycles in LCO-Bl. The C 1s, O 1s and F 1s XPS spectra of LCO cathode after (g–i) 10 and (j–l) 100 cycles in MCO-TTE.
Figure 4
Nyquist plots of the Li||LCO cells in (a) LCO-Bl and (b) MCO-TTE before and after 10 and 100 cycles. (c) Impedance fitting results. (d) The equivalent circuit models before (top) and after (bottom) cycle used for EIS spectra fitting.

 DownLoad:

 下载:
下载:


