Citation:
Qilong Gao, Yixin Jiao, Andrea Sanson, Erjun Liang, Qiang Sun. Large negative thermal expansion in GdFe(CN)6 driven by unusual low-frequency modes[J]. Chinese Chemical Letters,
2023, 34(5): 107564.
doi:
10.1016/j.cclet.2022.05.078
Large negative thermal expansion in GdFe(CN)6 driven by unusual low-frequency modes
English
Large negative thermal expansion in GdFe(CN)6 driven by unusual low-frequency modes
Key Laboratory of Materials Physics of Ministry of Education, and School of Physics and Microelectronics, Zhengzhou University, Zhengzhou 450052, China
b.
Department of Physics and Astronomy, University of Padova, Padova I-35131, Italy
Received Date:
17 March 2022 Accepted Date:
24 May 2022 Revised Date:
10 April 2022 Available Online:
15 May 2023
Abstract:
Understanding the negative thermal expansion (NTE) mechanism is of great importance. In this work, we consider the new NTE compound GdFe(CN)6 (αv = −34.2×10⁻⁶ K-1) as a case study to investigate the NTE mechanism from the perspective of the lattice vibrational dynamics. The atomic mean-square displacements suggest that the NTE of GdFe(CN)6 comes from the strong tension effect induced by the transverse vibrations of the atomic –Fe–C≡N–Gd– linkages, with the largest contribution given by N atoms. Lattice dynamics calculations show that three low-frequency optical modes at about 50 cm-1 show the largest negative Grüneisen parameters thus providing the largest contribution to the NTE. The existence of these unusual low-frequency vibrational modes can be ascribed to the presence of GdN6 trigonal prisms in the framework structure of GdFe(CN)6.
Not all materials expand when heating, there also exists a handful of materials with different behavior, called negative thermal expansion (NTE) or zero thermal expansion (ZTE) materials. Due to their great interest in the realization of materials with controlled thermal expansion, useful in a multitude of technological applications, a lot of NTE materials were discovered in the past two decades [1-6]. Many mechanisms or models were proposed to explain NTE, such as low-frequency phonon vibrations and transverse vibrations [7−9], magneto-volume effect [10], ferroelectric effect [11,12], and charge transfer [13,14]. However, a detailed understanding of NTE mechanisms and related phenomena, as well as the extent to which they can be enumerated, is still limited. For example, many NTE mechanisms were proposed in ZrW2O8, the most popular NTE material, such as the transverse thermal expansion of bridge O atoms [15], rigid unit modes [16], frustrated soft modes [17], correlated rotations of ZrO6 octahedra [18], and tent model [19]. Understanding the dynamical mechanisms behind the NTE behavior provides the information to design new NTE compounds or even super NTE materials.
So far, the study of NTE materials with open-framework structure has received great attention, evidenced by Shi et al., who indicated that the published works about the NTE materials with open-framework structure occupie nearly 2/3 of the publications in the NTE materials field [3]. They often were classified as phonon-driven [20] or structural NTE materials [21]. Among these the cyanides, compared with the oxides and fluorides, have more structural flexibility because of the presence of cyanide ligand, which brings abundant low-frequency transverse modes to contribute to NTE [7]. Interesting NTE behaviors are often observed in cyanides [22]: 1-dimension NTE along the hexagonal c-direction in AgCN [23], 2-dimensions NTE in the a-b plane of Ni(CN)2 [24] and 3-dimensions NTE in cubic (Zn, Cd)(CN)2 [25] and in many Prussians blue analogues (PBAs), such as ZnPt(CN)6 [26], (Fe, Ga, Sc)(Fe, Co)(CN)6 [27-31], RECo(CN)6 [32] and AgB(CN)4 [33]. It should be noted that a lot of research about the NTE mechanism has been suggested based on the perspective of local structure and lattice dynamics calculations [23-34]. There is a general consensus that the same direction transverse thermal vibration of C and N atoms has the main contribution to NTE. Moreover, some NTE cyanides show an interesting negative linear compressibility (NLC) such as Ag3Co(CN)6 [35], In[Ag(CN)2]3 [36], KMnAg3(CN)6 [37] and Zn[Au(CN)2]2 [38]. Although the presence of low-frequency phonons has been widely accepted as NTE mechanism for cyanides, the vibrational modes that most contribute to NTE are different among the different cyanides, and not always the NTE comes from the transverse vibrations of C≡N group [39,40]. For example, low-frequency acoustic modes give a significant NTE contribution in (Zn, Cd)(CN)2, as observed by inelastic neutron scattering and theoretical calculation [41-43], while the NTE in ZnNi(CN)4 comes from the contribution of rigid-unit modes of NiC4 and ZnN4 units, but also from the distortion of the NiC4 units related to the vibrational mode with the larger negative Grüneisen parameter [44]. The NTE in some cyanides are enhanced by other factors such as argentophilic (Ag+···Ag+) interactions in Ag3Co(CN)6 [45] and spin crossover in [Fe(bpac)(Au(CN)2)2]·2EtOH [46]. Hence, exploring new NTE cyanides/PBAs and understanding their unusual vibrational dynamics will be beneficial to design new NTE compounds or, even better, materials with controlled thermal expansion.
In this work, for the first time, the large NTE in hexagonal GdFe(CN)6 has been observed by synchrotron X-ray diffraction (SXRD). The temperature dependence of the atomic mean-square displacements (MSDs) and of the Raman spectra have been determined to study the role of the transverse thermal vibrations of C and N atoms. The relationship between crystal structure and vibrational dynamics has been investigated by first-principles calculations in order to shed light on the occurrence of NTE. The NTE of GdFe(CN)6 can be related to the presence of unusual low-frequency modes of tri-prism GdN6.
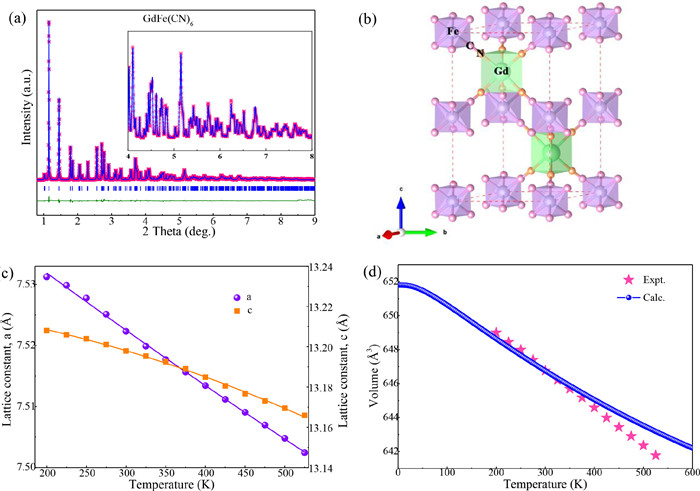
RE(Fe, Co)(CN)6 (RE = La−Lu, Y) have hexagonal symmetry, whose space group is P63/mmc. The element of Gd is located in the middle of lanthanides. It is very suited to select GdFe(CN)6 to investigate the role of REN6 tri-prism on the NTE behavior. The GdFe(CN)6 was prepared from GdFe(CN)6·4H2O on heating at 475 K, which has Cmcm space group and was prepared with Gd(NO3)3·xH2O and K3Fe(CN)6 (Figs. S1 and S2 in Supporting information). Fig. 1 shows the best-fitted results of the SXRD pattern of GdFe(CN)6 at 300 K. The resulting lattice constants are a = b = 7.52233(8) Å and c = 13.19790(16) Å at 300 K. The structure of GdFe(CN)6 is an open-framework with FeC6 octahedra and GdN6 tri-prism bridging by the cyanide ligands (Fig. 1b). Such geometry, highly unusual for f-block elements, may have a strong influence on the structural flexibility of −Gd−N≡C−Fe− linkage and, consequently, on the thermal expansion behavior.
Figure 1
Figure 1.
(a) Rietveld structure refinements of synchrotron XRD (APS, 11-ID-C, λ = 0.11730 Å) data of GdFe(CN)6 at room temperature. The inset shows the enlarged diffraction profile at high angle of 4°~8°. (b) Structure of GdFe(CN)6 with GdN6 trigonal prismatic (D3h) and FeC6 octahedra with CN cyanide linkages. Temperature dependence of (c) lattice constants and (d) DFT calculated lattice parameters of GdFe(CN)6 compared to experimental data. The DFT results have been shifted by values of 0.27801 Å to aid comparison of the thermal expansion. 0.27801 is the difference between calculation and experiment at 300 K.
Figs. 1c and d show the temperature dependence of the lattice constants and unit cell volume of GdFe(CN)6 (αa = −12.0×10⁻⁶ K-1, αc = −10.40×10⁻⁶ K-1, αv = −34.2×10⁻⁶ K-1, 200-525 K), determined by temperature-dependent SXRD. We have also obtained the temperature dependence of the unit cell volume for GdFe(CN)6 by first-principles calculations, as shown in Fig. 1d, whose result is in excellent agreement with the experimental data. This suggests that our DFT calculations are reliable to investigate the NTE mechanism in GdFe(CN)6. Compared with ZrW2O8 (αv = −26.1 × 10⁻⁶ K-1, 0.3-1050 K) [47] and ScF3 (αv = −12.3 × 10⁻⁶ K-1, 10-1010 K) [48], but also with other PBAs such as FeCo(CN)6 (αv = −4.2 × 10⁻⁶ K-1) [24] and TiCo(CN)6 (αv = −12.15 × 10⁻⁶ K-1) [49], the NTE magnitude of GdFe(CN)6 is larger. According to the concept of average atomic volume (AAV) proposed by Gao et al. [33,50], the AAV value of GdFe(CN)6 (23.1 Å3) is smaller than in LaFe(CN)6 (24.7 Å3) but larger than in LuFe(CN)6 (22 Å3). In agreement, the NTE of GdFe(CN)6 is located between that of LaFe(CN)6 (αv = −30 × 10-6 K-1) and that of LuFe(CN)6 (αv = −47.19 × 10⁻⁶ K-1).
The transverse thermal vibrations of bridge atoms are the key factor for NTE in most framework structure compounds [7,8]. In this work, the atomic mean-square displacements (MSDs) parallel (//) and perpendicular (⊥) of C and N atoms have been determined extracted by DFT calculations (Fig. S3a in Supporting information). Both components of the transverse vibrations of N and C atoms in –Gd−N≡C−Fe– linkage are reported. From this figure, it can be observed that the transverse vibrations of CN group are much larger than the longitudinal ones, and the transverse vibrations of N atoms are much larger than that of C atoms. The anisotropy of N and C atoms, calculated by the ratio γ = MSD⊥/MSD|| (Fig. S3b in Supporting information). These results indicate that the NTE of GdFe(CN)6 comes from the strong tension effect induced by the transverse vibrations in the atomic –Fe–C≡N–Gd– linkages, with the strongest contribution given by N atoms.
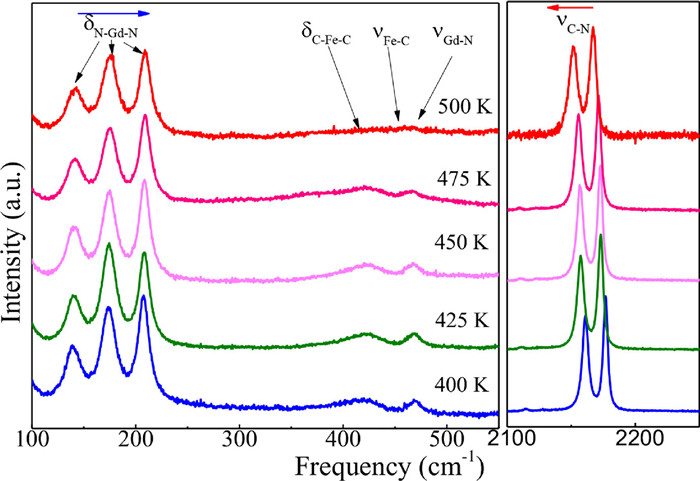
Further qualitative information on the lattice dynamics and NTE mechanism of GdFe(CN)6 can be obtained by Raman spectroscopy. Hence, temperature-dependent Raman spectra were collected with a Jobin-Yvon LabRAM HR Evolution Raman spectrometer with a laser wavelength of 633 nm. According to the Raman analysis of LnCo(CN)6 previously reported [32], the three lowest-frequency Raman peaks of GdFe(CN)6 shown in Fig. 2 can be assigned to Gd-N bending vibrations (δN-Gd-N), while the two Raman peaks around 2165 cm-1 are related to cyanide stretching modes (νC). Unfortunately, the C-Fe-C bending modes (δC-Fe-C) and the Fe-C and Gd-N stretching modes (νFe-C and νGd-N) at about 400-500 cm-1 cannot be clearly observed at high temperature due to their low intensity. Interestingly, the bending δN-Gd-N modes show a phonon hardening with temperature, while the νC stretching modes display a phonon softening (Fig. S4 in Supporting information). The frequency change with temperature has been estimated by the quantity and the results are reported in Table 1. One can clearly see that the bending modes δN-Gd-N have a large positive total anharmonicity. Similar behavior was observed in other NTE compounds such as CaZrF6 [51], ScCo(CN)6 [52] and TaVO5 [53].
Figure 2
Figure 2.
Temperature dependence of Raman spectra for GdFe(CN)6: the bending δN-Gd-N vibrational modes show a shift to higher frequencies with increasing temperature, while an opposite behavior is shown by the stretching νCN vibrational modes.
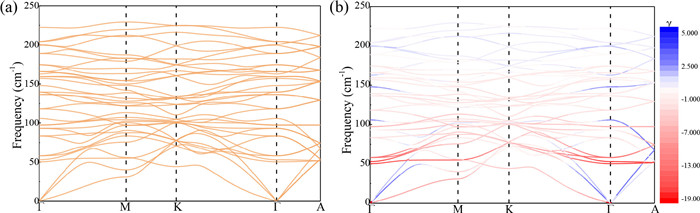
More quantitative information on the vibrational dynamics and NTE mechanism of GdFe(CN)6 can be extracted by first-principles calculations (see Supporting information for computational details). The phonon dispersion curves and the Grüneisen parameters of GdFe(CN)6 have been calculated in the whole frequency range 0–2400 cm-1 (Fig. S5 in Supporting information). Here, we focus our attention on the low-frequency part 0–250 cm-1, because that is of interest to the NTE (Fig. 3a). In particular, Fig. 3b shows the same dispersion curves colored according to the corresponding value of the individual Grüneisen parameters γ, so as to have an overview on which are the vibrational modes that most contribute to NTE [54]. It can be observed that the main contributions to the NTE come from the low-frequency optical modes at about 50 cm-1. Specifically, around the Γ-point of the Brillouin zone three optical modes (at about 50, 53 and 58 cm-1) have the largest negative Grüneisen parameters with γ ~ −15. At higher vibrational frequencies, the Grüneisen parameters gradually tend to become positive. In order to get further details on the NTE dynamics of GdFe(CN)6, the vibrational modes from high symmetry directions have been analyzed according to Fig. S6 (Supporting information). The bottom panel shows the contribution of each atom to the atomic square displacements u2 for each single vibrational mode, numbered along the abscissa. The top panel shows the corresponding vibrational frequency. It can be noted as the amplitude vibrations of N atoms are larger in the low-frequency range of 0−250 cm-1. In particular, as the contribution from the metal atoms is much weaker than the bridging N and C atoms.
Figure 3
Figure 3.
(a) Phonon dispersion curves of GdFe(CN)6 calculated in the low-frequency region below 250 cm-1. (b) The same dispersion curves have been colored according to the corresponding value of the Grüneisen.
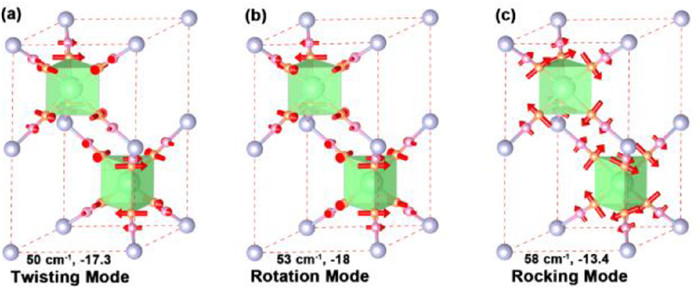
By focusing the attention on the three optical modes at the Γ-point with the largest negative Grüneisen parameters (those at about 50, 53 and 58 cm-1), Fig. 4 shows the eigenvectors of these vibrational modes. These three optical modes can be described as twisting, rotation mode and rocking modes, and are related to the distortion of the GdN6 and FeC6 polyhedra, especially due to the transverse motion of the N atoms. The mode at ~50 cm-1 displays a strong negative Grüneisen parameter of about −17.3, with transverse vibrations of N atoms. The N atoms above and below the GdN6 trigonal prism have an opposite direction of vibration, thus the GdN6 trigonal prism is twisted (Fig. 4a). The reverse vibrations of N atoms shorten the Gd–Fe distance, which in turn leads to NTE. The vibrational mode with a frequency of ~53 cm-1 has a negative Grüneisen parameter of about −18. Here the N atoms above and below the GdN6 trigonal prism are vibrating transversely and in the same direction, thus causing the rotation of the GdN6 trigonal prism and again the decrease of the Gd–Fe distance (Fig. 4b), contributing to the NTE. We call this mode of vibration the rotation mode. Finally, the third mode with frequency of about 58 cm-1 has a Grüneisen parameter of about −13.4. In this case, the N atoms at the vertices of the GdN6 trigonal column vibrate laterally and rotate in the same clockwise direction, thus causing the rock of the GdN6 trigonal column (Fig. 4c) and the reduction of the Gd–Fe distance, thus further contributing to the NTE of the system.
Figure 4
Figure 4.
The three prism vibrational modes with the largest negative Grüneisen parameter at Γ point of Brillouin zone, (a) twisting mode at 50 cm-1, (b) rotation mode at 53 cm-1, (c) rocking mode at 58 cm-1. The direction and size of arrows reflect the direction and amplitude of vibrations of N and C atoms.
Combined with the NTE oxides, MOF and fluorides, the NTE contribution for most framework structure materials was mainly from the transverse thermal vibrations of the bridging atoms or atomic clusters [3,4,7,55]. Interesting, due to the large difference in structure, the difference in structure often causes prominent NTE behavior with different mwchanism among different systems. So, investigating the role of structure on the NTE will give us insight to design and find new NTE materials.
In summary, large NTE (αv = −34.2 × 10⁻⁶ K-1, 200−525 K) has been found out in GdFe(CN)6. A detailed investigation of the lattice dynamics shows that the NTE driving force of GdFe(CN)6 lies in the presence of transverse vibrations of the C≡N group, with the greatest contribution of N atoms. Raman spectroscopy reveals a large anharmonicity for the δN-Gd-N bending modes, as similarly observed in other NTE systems. The three vibrational modes at the Γ-point with the largest negative Grüneisen parameters correspond to twisting, rotation and rocking mode of the GdN6 trigonal prism of GdFe(CN)6, and all are due to the different vibrations of N atoms.
Declaration of competing interest
The authors declare that they have no known competing financial interests or personal relationships that could have appeared to influence the work reported in this paper.
Acknowledgments
This work was supported by the National Natural Science Foundation of China (Nos. 22071221 and 21905252) and the Natural Science Foundation of Henan Province (No. 212300410086). Use of the Advanced Photon Source, an Office of Science User Facility operated for the U.S. Department of Energy (DOE) Office of Science by Argonne National Laboratory, was supported by the U.S. DOE under Contract No. DE-AC02-06CH11357. All calculations were supported by National Supercomputing Center in Zhengzhou.
Supplementary materials
Supplementary material associated with this article can be found, in the online version, at doi:10.1016/j.cclet.2022.05.078.
[1]
J. Chen, L. Hu, J. Deng, X. Xing, Chem. Soc. Rev. 44 (2004) 3522.
Figure 1
(a) Rietveld structure refinements of synchrotron XRD (APS, 11-ID-C, λ = 0.11730 Å) data of GdFe(CN)6 at room temperature. The inset shows the enlarged diffraction profile at high angle of 4°~8°. (b) Structure of GdFe(CN)6 with GdN6 trigonal prismatic (D3h) and FeC6 octahedra with CN cyanide linkages. Temperature dependence of (c) lattice constants and (d) DFT calculated lattice parameters of GdFe(CN)6 compared to experimental data. The DFT results have been shifted by values of 0.27801 Å to aid comparison of the thermal expansion. 0.27801 is the difference between calculation and experiment at 300 K.
Figure 2
Temperature dependence of Raman spectra for GdFe(CN)6: the bending δN-Gd-N vibrational modes show a shift to higher frequencies with increasing temperature, while an opposite behavior is shown by the stretching νCN vibrational modes.
Figure 3
(a) Phonon dispersion curves of GdFe(CN)6 calculated in the low-frequency region below 250 cm-1. (b) The same dispersion curves have been colored according to the corresponding value of the Grüneisen.
Figure 4
The three prism vibrational modes with the largest negative Grüneisen parameter at Γ point of Brillouin zone, (a) twisting mode at 50 cm-1, (b) rotation mode at 53 cm-1, (c) rocking mode at 58 cm-1. The direction and size of arrows reflect the direction and amplitude of vibrations of N and C atoms.

 DownLoad:


 下载:
下载:


