School of Materials Science & Engineering, Hunan Provincial Key Laboratory of Electronic Packaging and Advanced Functional Materials, Central South University, Changsha 410083, China
b.
Centre for Environment and Water Resources, College of Chemistry and Chemical Engineering, Central South University, Changsha 410083, China
c.
College of Chemistry and Chemical Engineering, Jishou University, Jishou 416000, China
d.
School of Physics and Electronics, Hunan University, Changsha 410083, China
Received Date:
18 March 2022 Accepted Date:
07 May 2022 Revised Date:
28 April 2022 Available Online:
15 February 2023
Abstract:
Aqueous rechargeable Zn//MnO2 batteries have been considered as the promising candidate for future energy storage system due to their economic and environmental merits. However, the high-performance Zn//MnO2 batteries are plagued by poor sluggish reaction kinetics and capacity degradation due to the strong electrostatic interactions and complicated reaction process. Herein, the synergistic effect of atom defects engineering and phase transformation mechanism is confirmed as the effective strategy to enhance ion/charge transfer kinetics and structural stability. Defects gradient controlling and electrochemically induced phase transformation from spinel to layered structure render the aqueous Zn//λ-MnO2 system delivers a high discharge capacity of 285 mAh/g and capacity retention of 81% after 500 cycles.
Searching for alternative clean energy is becoming a global imperative because of the dwindling supplies and global warming threats [1-4]. Unfortunately, renewable energy sources always call for an upswell in advanced energy storage techniques [5-7]. The past decades have witnessed that battery systems are competitive energy storage devices for their long life-span, low cost and controllable power and energy density [8-11]. Aqueous rechargeable zinc battery offers intriguing promise due to its advantageous stability, innocuity and abundance of Zn metal [12-14]. Especially, the Zn//MnO2 battery systems are widely studied because of the high theoretical capacity and discharge plateau as well as eco-friendly nature of MnO2 [15-18]. Nonetheless, the strong electrostatic interaction between Zn2+ and MnO6 framework leads to sluggish reaction kinetics [3,19,20]. Besides, the severe dissolution and irreversible phase transition of MnO2 further result in rapid capacity fading [21-23]. Defect engineering has been proved as an especially issues-oriented solution to overcome many intrinsic limitations of active materials by tunning the electronic and crystal properties [24-26]. Introducing atom defects into the crystal structure of MnO2 can not only construct more active sites, but also enhance the ion/charge transfer kinetics [27]. Furthermore, in order to mitigate the severely destroyed MnO2 structure because of complex side reactions, a self-tailoring process in realizing stable charge carriers' storage provokes researchers to seek intelligent MnO2 materials.
Herein, we synthesized LiMn2O4 using a high-temperature solid-state reaction method at 850 ℃ under air condition. The oxygen defects (Od) are generated at this high-temperature condition, meanwhile, the contents of oxygen deficiencies can be controlled through adjusting the different calcination time. Thereafter, oxygen-defected λ-MnO2 containing various concentrations of Od were obtained upon lithium removal by subsequent acid leaching. The LiMn2O4 and λ-MnO2 products with different calcination times are abridged as LiMn2O4/λ-MnO2-T (T = 12, 24, 36 h). Systematic electrochemical tests prove that the λ-MnO2-24 performs faster reaction kinetics than that of λ-MnO2-12 and λ-MnO2-36. Furthermore, characterizations on structural evolution reveal that a phase transition from spinel (order) to layered (disorder) structure occurs. This new phase dominated the following Zn2+ insertion/extraction processes and enhanced cycling stability by self-adjusting volume changes. Attributed to the oxygen defects engineering and phase transition mechanism, the λ-MnO2-24 electrode delivered an improved electrochemical performance as cathode in aqueous zinc batteries.
In a typical procedure, LiMn2O4 was prepared via the high-temperature solid-state reaction: A stoichiometric mixture of Li2CO3 (1 mmol, 73.9 mg) and Mn2O3 (2 mmol, 316.4 mg) was grounded and heated at 850 ℃ for 12, 24 and 36 h in air condition with a ramping rate of 5 ℃/min. The conversion from LiMn2O4 to λ-MnO2 was followed by the acid (a dilute H2SO4 solution, 0.1 mol/L) leaching treatment for 18 h.
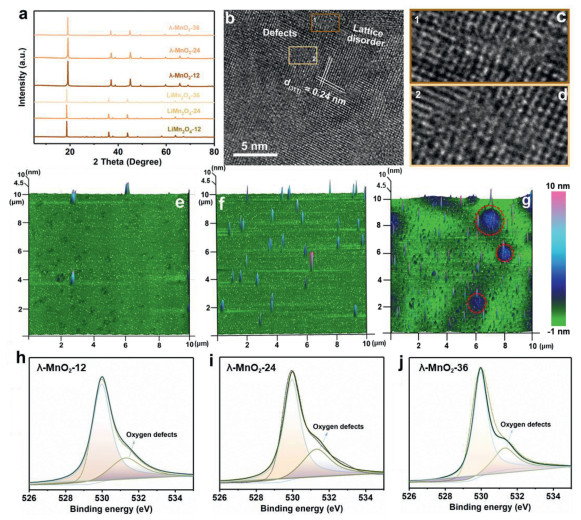
LiMn2O4 possesses a spinel structure in which Mn3+ and Mn4+ occupy the octahedral B sites and Li+ locates in the tetrahedral A sites (Fig. S1a in Supporting information). The morphology of the obtained LiMn2O4 is shown in Fig. S1b (Supporting information). The λ-MnO2-T is obtained after the Li+ removal from LiMn2O4 and the crystal structure is shown in Fig. S2a (Supporting information). X-ray diffraction (XRD) patterns (Fig. 1a) reveal that there is a significant difference in lattice parameters between LiMn2O4 (JCPDS No. 35-0782) and λ-MnO2 (JCPDS No. 42-1169). Compared with LiMn2O4, a remarkably lattice strain appears in λ-MnO2 due to the increase of oxidation state of Mn and pulverization of single crystals [28,29]. Meanwhile, all the λ-MnO2 possess rough surfaces with micro-cracks morphology, as shown in Figs. S2b-d (Supporting information). Structural features and surface topographies are characterized by HR-TEM (high resolution transmission electron microscopy) and AFM (atomic force microscopy). Taking the λ-MnO2-24 as an example (Figs. 1b-d), the lattice distance of 0.24 nm corresponds to the (311) plane of λ-MnO2. And there are many ambiguous atomic columns and disordered lattice fringes could be observed in the crystal planes, which are caused by rich atom defects. Furthermore, the AFM images with 10 µm × 10 µm area scan show totally different surface morphologies among them (Figs. 1e-g). Obviously, λ-MnO2-12 shows a quite flat and homogeneous surface with several protrusion spots, and λ-MnO2-24 delivers a much more uneven surface with ups and downs. Unfortunately, λ-MnO2-36 displays an almost damaged structure as marked in these red circles due to the excessively long high-temperature reaction time.
Figure 1
Figure 1.
(a) XRD patterns of LiMn2O4-T and λ-MnO2-T. (b) HR-TEM images of λ-MnO2-24 sample. (c, d) HR-TEM images marked in (b). (e-g) 3D AFM images of the λ-MnO2-T samples with 10 µm × 10 µm area scan. (h-j) High-resolution O 1s XPS results of λ-MnO2-T.
More information about atom defects in λ-MnO2 is obtained through X-ray photoelectron spectroscopy (XPS) technology. High resolution O 1s, Mn 3s and Mn 2p spectra of λ-MnO2-T are illustrated. As shown in Figs. 1h-j, all the three fitted results reveal that the co-existence of the lattice oxygen (530.0 eV) and oxygen species beside the defects (531.3 eV) in λ-MnO2-T [30,31]. Notably, the fitted peak areas of oxygen species adjacent to defects are different, which increases from λ-MnO2-12 to λ-MnO2-24, and λ-MnO2-36 is between them. It indicates that the λ-MnO2-24 sample may carry the highest concentration of oxygen defects than that in λ-MnO2-12 and λ-MnO2-36. Similar results can be found in Mn 3s spectra. Fig. S3b (Supporting information) shows that the λ-MnO2-24 possesses an energy separation of 5.08 eV, which is higher than those in λ-MnO2-12 (4.74) and λ-MnO2-36 (4.82) (Figs. S3a and c in Supporting information), demonstrating the lowest average valence of Mn caused by the rich oxygen defects [32,33]. The Mn 2p spectra (Figs. S3d-f in Supporting information) further confirms the ratio of Mn4+ in λ-MnO2 decrease with the calcination time increasing from 12 h to 36 h, but λ-MnO2-24 has the lowest value. The calculated Mn valence of λ-MnO2-12, λ-MnO2-24 and λ-MnO2-36 are 3.48, 3.38, 3.42, respectively. Overall, XPS results demonstrate that λ-MnO2-24 shows the lowest valence state of Mn, indicating the highest content of oxygen defects in it.
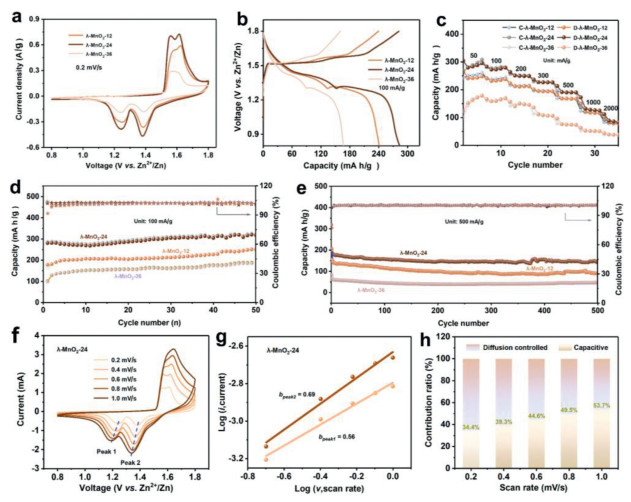
Applications of defect engineering in λ-MnO2-T cathode is investigated in aqueous Zn battery. Cyclic voltammetry (CV) tests are conducted to understand the effect of Od on electrochemical behavior. As shown in Fig. 2a, CV curves show that all the λ-MnO2-T electrodes possess two pairs of cathodic/anodic peaks, suggesting that the concentration of oxygen defect has almost no influence on their electrochemical reaction mechanism. However, the extremely higher redox current response of λ-MnO2-24 electrode than that of the other two electrodes demonstrate the critical role of Od concentration on the electrochemical activity. This phenomenon is corroborated by galvanostatic charge/discharge (GCD) measurements as well (Figs. 2b and c). The λ-MnO2-24 electrode presents longer discharge plateau, smaller polarization potential (103 and 278 mV) and higher discharge capacity (285 mAh/g) than those of λ-MnO2-12 (117 and 291 mV, 241 mAh/g) and λ-MnO2-36 (115 and 310 mV, 167 mAh/g), revealing enhanced reaction activity and increased active sites. The bond strength of Mn-O bonds would be enhanced after Od introduction, nonetheless, it would lead to structural collapse and affect thermodynamic stability beyond the upper limit of the content. Definitely surely, the cycling stability of λ-MnO2-T electrodes is closely related to Od contents. As illustrated in Figs. 2d and e and Fig. S4 (Supporting information), the discharge capacities of λ-MnO2-T (T = 12, 24 and 36) are 250.2, 317.4 and 184.5 mAh/g at 100 mA/g after 50 cycles, 89.6, 146.1 and 47.3 mAh/g at 500 mA/g after 500 cycles, 64.4, 154.1 and 36.8 mAh/g at 1000 mA/g after 1900 cycles. Cycling performance further proves λ-MnO2-24 electrode performs the highest capacity retention, which is consistent with CV and GCD results. A comprehensive performance comparison of different cathodes in aqueous Zn batteries is summarized in Table S1 (Supporting information), which verifies the advance of λ-MnO2-24 electrode. Electrochemical impedance spectroscopy (EIS) is further carried out to elucidate the electronic conductivity property of λ-MnO2-T. The Nyquist plots are shown in Fig. S5 (Supporting information), which presents that both the equivalent series resistance and the charge-transfer resistance of λ-MnO2-24 (2.88 Ω, 322.2 Ω) are lower than those of λ-MnO2-12 (3.38 Ω, 1757 Ω) and λ-MnO2-36 (4.78 Ω, 844 Ω), verifying the moderate Od concentration and proper structure of λ-MnO2-24 may contribute to fast electron transfer kinetic.
Figure 2
Figure 2.
Comparisons of electrochemical behaviors of λ-MnO2-T electrodes. (a) CV curves at 0.2 mV/s. (b) GCD profiles at 100 mA/g and (c) rate performance at different current densities. (d, e) Cycling stability at 100 and 500 mA/g. (f) CV curves of λ-MnO2-24 electrode at different scan rates, the corresponding plots of log(peak current) vs. log(scan rate) at the redox peaks (g) and (h) the calculated capacitive contributions at different scan rates.
In order to investigate the reaction dynamic properties of λ-MnO2-T electrodes, sweep voltammetry (from 0.2 mV/s to 1.0 mV/s) technology is applied (Figs. 2f-h). It is well known that the relationship between CV current and scan rate obey the power law [34,35]:
i=avb
(1)
where a is a constant, b is interrelated with the storage mechanism, i and v refer to current and scan rate, respectively. In general, the b value is in the range of 0.5-1.0, when it is close to 0.5, the system is mainly controlled by ion diffusion process, while the pseudocapacitive energy storage mechanism controls the electrochemical process when it is close to 1.0 [36,37]. As for the λ-MnO2-24 electrode, the b-value calculated by the slopes of the redox peaks of peak 1 and peak 2 are 0.56 and 0.69. It demonstrates a synergistic mechanism including both the diffusion-controlled and capacitive-controlled process. Furthermore, the capacity can be differentiated into capacitive-controlled contribution and diffusion-controlled contribution according to the equation [38]:
i=k1v+k2v1/2
(2)
where i refers to current response, k1v represents capacitive contribution, and k2v1/2 represents ion-diffusion contribution. As a result, 34.4%, 39.3%, 44.6%, 49.5% and 53.7% of the whole capacity at 0.2, 0.4, 0.6, 0.8 and 1.0 mV/s are capacitive-controlled in λ-MnO2-24 electrode, indicating the ion diffusion-controlled mechanism dominates the energy storage process. The same results also can be observed in λ-MnO2-12 and λ-MnO2-36 electrodes (Fig. S6 in Supporting information), the b-values of peak 1 and 2 are 0.66, 0.54 and 0.54, 0.40 for λ-MnO2-12 and λ-MnO2-36 electrodes, the percentage of capacitive contribution at 1.0 mV/s are 51.9% and 29.4%, respectively. The higher b-value and more capacitive contribution in λ-MnO2-24 than those in λ-MnO2-12 and λ-MnO2-36 electrodes demonstrate the faster ion/electron transfer kinetic, suggesting the positive effect of an appreciate defective structure.
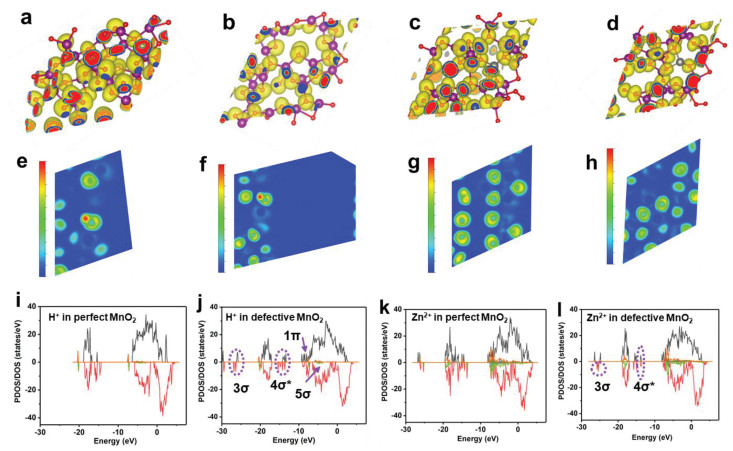
Galvanostatic intermittent titration technique (GITT) is used to investigate the charge carriers' diffusion kinetic. As is shown in Fig. S7 (Supporting information), all the diffusion efficiency curves display the similar shape. Because of the narrow diffusion channels in λ-MnO2 and the strong Coulombic interaction between MnO2 host and charge carriers, the D-values are in the magnitude of 10–12-10–16 cm2/s during the first discharging. It is noted that the D-values increase to the range of 10–11-10–14 cm2/s during the subsequently charging/discharging process, which is associated to a phase transition process with the morphological change from closely packed (ordered) to porous (disordered). It will be discussed in detail in the following section. Additionally, the average D-values of λ-MnO2-24 electrode is always higher than those of λ-MnO2-12 and λ-MnO2-36 samples. This result is well consistent with the above electrochemical performances, elucidating an appreciate concentration of Od is critical to the comprehensive performance. The positive effect of Od in λ-MnO2 is supported by density functional theory (DFT) calculations, herein, we take the (111) plane as an example. Charge density results (Figs. 3a and c) reveal that there is a uniform charge distribution state in perfect λ-MnO2. After the introduction of Od, charge deficiency generates and charge density changes, as shown in the charge density difference maps (Figs. 3b and d, Fig. S8 in Supporting information), which results in electrons accumulation and makes adsorption energy decreased [39]. Comparable results could also be obtained from electron localization function maps (ELF, Figs. 3e-h). As for the perfect structure, the charge densities among H, O, Zn and Mn are low and corresponding interactions are weak. But they increase in defective structure, leading to enhanced interactions among H+, Zn2+ and MnO2. In order to understand bonding properties better, (partial) density of states ((P)DOS, Figs. 3i-l) of inserted H+/Zn2+ in perfect and defective MnO2 were calculated. Compared with perfect MnO2 crystal, significantly different bonds (e.g., 1π, 3σ, 4σ*, 5σ) and bonding intensity after H+/Zn2+ insertion in defective MnO2 appear. Here we propose both H+/Zn2+ insertion mechanism. Even though a phase change mechanism is proved in this work, it is to be noted that the defect engineering is an effective strategy towards high-performance aqueous Zn batteries. Besides, weather the generated new phase of ZnMn3O7 is defective or not, it is hard to be confirmed due to its amorphous structure.
Figure 3
Figure 3.
(a-d) Charge densities, (e-h) electron localization function (ELF, the value of ELF ranges from 0 to 1, a value of 1 (red area) means that the electron is completely localized, and a value of 0 (blue area) may mean that the electron is completely delocalized). (a, e) Perfect MnO2 and (b, f) defective MnO2 with H+ insertion. (c, g) Perfect MnO2 and (d, h) defective MnO2 with Zn2+ insertion; The P(DOS) curves of H+ inserted in perfect (i) and defective (j) MnO2; P(DOS) of Zn2+ inserted in perfect (k) and defective (l) MnO2.
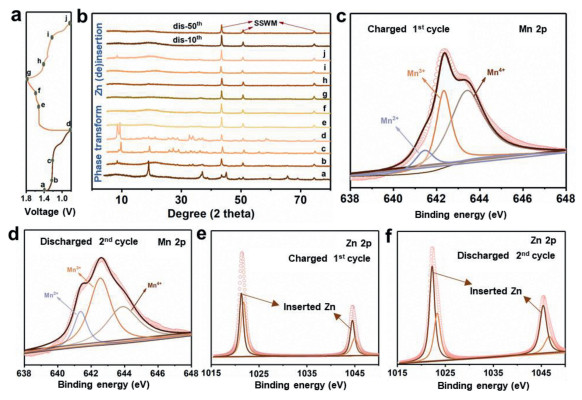
In addition to the defect effect on electrochemical performance, the structural evolution effect cannot be ignored, thus, the concrete reaction mechanism should be elucidated. The first two successive charging/discharging profiles are shown in Fig. 4a, a flat discharge plateau at about 1.22 V can be seen during the first discharging, indicating a two-phase reaction is involved in this process. However, the obvious two discharge plateaus in the following discharging process suggest a totally different mechanism [40]. Ex-situ X-ray diffraction (XRD, Fig. 4b) patterns are firstly used to analyze the phase evolution during charging/discharging. Impressively, there no Zn-inserted products are observed but the Zn4SO4(OH)6·xH2O dominates the mainly strong signals during the initial discharging. As is known, Zn4SO4(OH)6·xH2O possesses a layered structure composed of Zn(OH)2 sheets with ZnSO4 and H2O molecules filling into the interlayer spaces. It is no doubt that the ZnSO4 and H2O come from the aqueous electrolyte media, but how the OH− participates into the precipitation of Zn4SO4(OH)6·xH2O in a weak acidic environment? Considering that the pH increases (from ~4.0 to 4.6) as discharge proceeds (Fig. S9 in Supporting information), water electrolysis should be responsible for OH− generation. In order to reach a neutral charge system, the H+ have to move towards MnO2 electrode forming HxMnO2. Meanwhile, the electrochemical reduction of MnO2 occurs accompanied with generating Mn3+ at the same time, which is unstable and prone to undergo a disproportionation, leading to the dissolution of Mn2+ and pH increases. Besides, some amorphous areas appear on the MnO2 surface after discharging due to the H+ insertion and expansion of unit cell (Figs. S10a and b in Supporting information).
Figure 4
Figure 4.
(a) GCD curves at 50 mA/g for the initial cycle and the discharging profile at the 2nd cycle. (b) The corresponding ex-situ XRD patterns at different charging/discharging states. (c-f) High-resolution Mn 2p and Zn 2p XPS results at the first charged and the second discharged state.
The galvanostatic charging profile with two charge plateaus and XRD patterns with broad peaks signify the totally different reaction process and phase transformation in the following charging process. In order to investigate the reaction process in detail, more evidences on phase evolution are supported by scanning electron microscopy (SEM), HR-TEM and XPS technologies since the amorphous new product is hardly determined through XRD analysis.
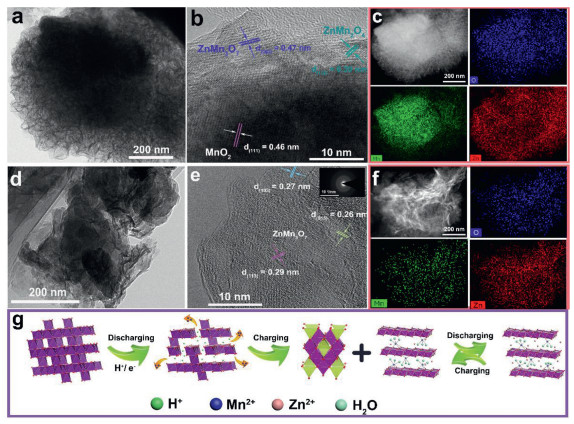
As shown in Fig. 4c, all the Mn2+, Mn3+ and Mn4+ exist in the fully charged electrode with Mn4+ occupying the highest proportion, which suggests that the MnO2 is remained and other Mn-based products appear as well. Notice that the inserted Zn2+ (centered at 1021.3/1044.5 eV) is detected in Zn 2p spectra, which is different with that (centered at 1021.8/1045.0 eV) in Zn4SO4(OH)6·xH2O (Fig. 4e). It demonstrates that the Zn-insertion reaction takes place during charging process, which contradicts with the previous reports. TEM and SEM is further used to characterize the Zn-inserted product. Fig. 5a and Figs. S10c and d (Supporting information) reveal that a highly porous nanostructure decorates the MnO2 surface, confirming that the MnO2 is kept in bulk electrode while Mn-based compounds generates on the outer surface, which is consistent with XPS result. Combining with HR-TEM and EDX mapping images (Figs. 5b and c), we proved these connected amorphous porous products are the composites of ZnMn2O4 and ZnMn3O7. The formation of ZnxMnO2 in Zn//MnO2 system may be thermodynamically favorable in discharging, but they generated in charging would be likely via the redox reaction between dissolved Mn2+ and Zn2+ in aqueous media. Despite their thermodynamic stability, however, the presence of ZnMn2O4 is unwelcome for aqueous Zn//MnO2 battery due to its inactive property for Zn2+ insertion. Even though some works claim that the utilization and cycling performance of MnO2 electrode would improve through introducing appropriate concentration of Mn2+ into electrolyte by changing the dissolution equilibrium of Mn2+, the real role of Mn2+ is still needed to be further explored.
Figure 5
Figure 5.
TEM, HR-TEM and EDX mappings of λ-MnO2-24 electrode after first charging (a-c) and (d-f) the second discharging. (g) Illustration of the electrochemical reaction process.
XRD pattern of the electrode after the 2nd, 10th and 50th discharging is the same with that after initial charging excluding some characteristic signals assigned to Zn4SO4(OH)6·xH2O. High-resolution Mn 2p and Zn 2p XPS spectra (Figs. 4d and f) show a chemical reduction of Mn and Zn insertion phenomenon after the second discharging. Especially, the fitted peak area of Zn 2p spectra belonging to Zn-insertion peak increases compared with that in the first charging state, indicating a Zn-insertion mechanism upon the following cycle. In addition, it is possible that the H+ may insert into the electrode because of the increased pH value of the electrolyte during discharging. Impressively, the morphology of MnO2 electrode evolved into totally disordered porous structure (Figs. 5d-f, Figs. S10e and f in Supporting information), furthermore, it is preserved even after 10 and 50 cycles (Figs. S10g and h in Supporting information). Together with HR-TEM and EDX mapping images, this product is determined as ZnMn3O7 but without ZnMn2O4 being detected. Despite the observations of the representative interlayer spacings from HR-TEM, the selected area electron diffraction (SAED) ring enclosed its low crystal feature. It is also the reason that there is no obvious peak attenuation of ZnMn3O7, disproportionation products or shrink/expand of interlay spacing upon subsequent charging/discharging cycles. Based on the above discussions, the overall reaction mechanism in aqueous ZnSO4 solution can be illustrated as the following (Fig. 5g): Upon initial discharging, H+ moves towards MnO2 cathode with Mn2+ dissolving into electrolyte from the surface of λ-MnO2, leading to the pH increase and the Zn4SO4(OH)6·xH2O precipitation. Upon the following charging, Zn4SO4(OH)6·xH2O dissolve into electrolyte and Mn2+ is re-doxed to layered ZnMn3O7 and little amount of spinel ZnMn2O4 on the electrode surface. Zn2+ insert/extract into/from disordered and layered ZnMn3O7 reversibly during the following electrochemical cycles with a totally different morphology, which helps to achieve a long-term cycling performance. It is to be noted that there is a reversible generation and dissolution of Zn4SO4(OH)6·xH2O in all the discharging and charging processes. However, in this work it may be not good for the battery performance because of its poor electrical conductivity and non-activity, even though some reported works confirmed its participation in electrochemical reactions [41,42].
In conclusion, λ-MnO2 samples with different Od concentrations are obtained through the high-temperature solid reaction. Systematic electrochemical tests reveal that λ-MnO2-24 electrode performs the best because of the appreciate amount of oxygen defects. Electrochemical studies with XRD, XPS, SEM and TEM allow us to discover the phase transition mechanism (from spinel λ-MnO2 to layered ZnMn3O7) induced by electrochemical reactions. The synergistic chemical and electrochemical strategy enables enhanced dynamic kinetics and cycling stability of λ-MnO2. Unluckily, developing high-performance Zn//MnO2 batteries and a deep understanding on the mechanism through advanced characterization techniques are still in need.
Declaration of competing interest
The authors declare no conflict of interest.
Acknowledgments
This work was supported by the National Natural Science Foundation of China (Nos. 52172263, 51932011), the Hunan Outstanding Youth Talents (No. 2021JJ10064), the Program of Youth Talent Support for Hunan Province (No. 2020RC3011), the Innovation-Driven Project of Central South University (No. 2020CX024), and the Fundamental Research Funds for the Central Universities of Central South University (No. 202321024). And we are grateful for resources from the High-Performance Computing Center of Central South University.
Supplementary materials
Supplementary material associated with this article can be found, in the online version, at doi:10.1016/j.cclet.2022.05.007.
Figure 1
(a) XRD patterns of LiMn2O4-T and λ-MnO2-T. (b) HR-TEM images of λ-MnO2-24 sample. (c, d) HR-TEM images marked in (b). (e-g) 3D AFM images of the λ-MnO2-T samples with 10 µm × 10 µm area scan. (h-j) High-resolution O 1s XPS results of λ-MnO2-T.
Figure 2
Comparisons of electrochemical behaviors of λ-MnO2-T electrodes. (a) CV curves at 0.2 mV/s. (b) GCD profiles at 100 mA/g and (c) rate performance at different current densities. (d, e) Cycling stability at 100 and 500 mA/g. (f) CV curves of λ-MnO2-24 electrode at different scan rates, the corresponding plots of log(peak current) vs. log(scan rate) at the redox peaks (g) and (h) the calculated capacitive contributions at different scan rates.
Figure 3
(a-d) Charge densities, (e-h) electron localization function (ELF, the value of ELF ranges from 0 to 1, a value of 1 (red area) means that the electron is completely localized, and a value of 0 (blue area) may mean that the electron is completely delocalized). (a, e) Perfect MnO2 and (b, f) defective MnO2 with H+ insertion. (c, g) Perfect MnO2 and (d, h) defective MnO2 with Zn2+ insertion; The P(DOS) curves of H+ inserted in perfect (i) and defective (j) MnO2; P(DOS) of Zn2+ inserted in perfect (k) and defective (l) MnO2.
Figure 4
(a) GCD curves at 50 mA/g for the initial cycle and the discharging profile at the 2nd cycle. (b) The corresponding ex-situ XRD patterns at different charging/discharging states. (c-f) High-resolution Mn 2p and Zn 2p XPS results at the first charged and the second discharged state.
Figure 5
TEM, HR-TEM and EDX mappings of λ-MnO2-24 electrode after first charging (a-c) and (d-f) the second discharging. (g) Illustration of the electrochemical reaction process.

 DownLoad:

 下载:
下载:


