Figure 1.
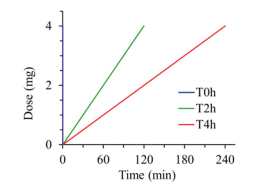
Protocol for delivering ciprofloxacin to the rat lungs with diverse rates but the same drug dose (20 mg/kg). T0h-blue, T2h-red and T4h-green indicate instillation time within 2 min, 2 h and 4 h, respectively.
Evaluating the pharmacokinetics of intrapulmonary administered ciprofloxacin solution for respiratory infections using in vivo and in silico PBPK rat model studies
Changzhi Shi , Jelisaveta Ignjatović , Junwei Wang , Yi Guo , Li Zhang , Sandra Cvijić , Dongmei Cun , Mingshi Yang

Chronic lung infections are a major threat for patients, which are vitally severe with high morbidity and mortality [1–3]. Currently antibiotic management is the primary means to treat infectious diseases including respiratory infections. Most antibiotics are given via systemic administration such as injection and oral administration [4]. However, systemic administration of antibiotics, such as ciprofloxacin (CIP), often could not provide high antibacterial concentration in the epithelial lining fluid (ELF), causing ineffective or limited therapeutic outcomes [5,6]. Furthermore, undesired low concentration of antibiotics in the ELF, where bacteria mainly exist, can increase the risk of resistant bacteria selection [7,8]. Latterly, direct aerosolization of antibiotics to the lung was introduced as an alternative to the systemic administration with an intention to achieve high pulmonary local concentration, as well as reduced systemic side effect. Although the advantages of inhaled medicines have been well documented, the success in the development of inhaled antibiotics has been marginal, because the development of inhaled antibiotics could encounter many challenges. For instance, consideration must be given to the specific patient population, selection of infectious agents, delivery of large drug doses by inhalation, poor coherence of patients to the devices, and the patient compliance. [9,10]. Often the concentrations of inhaled antibiotics in the lung decline rapidly [11–13]. For example, the systemic exposure and pulmonary exposure showed no discrepancy after intratracheal bolus of CIP due to high lung epithelial permeability [14]. In order to lower the permeation rate of CIP to maintain a high concentration of CIP in ELF, researchers attached metal cations (i.e., Ca2+, Cu2+, Al3+, Mg2+) to CIP to form complex. In a Calu-3 cell model, their study demonstrated that the epithelial apparent permeability of CIP could be reduced. The higher the complex affinity, the lower the CIP apparent permeability [15,16]. Their subsequent study also showed that this modification of CIP could lead to a significant improvement of the CIP concentration in the ELF post intratracheal administration in a rat model [17]. The long-term application of the metal ions raises some safety concern though. Some other innovative formulations have also been attempted with an intention to extend the exposure of CIP in the lung post pulmonary administration. For example, CIP was encapsulated in liposomal formulations to provide CIP with prolonged in vitro drug release [18–20]. In other reports, the practically insoluble zwitterionic form of CIP was formulated into dry powders for inhalation [21,22]. Presumably, these formulations would render CIP controlled-release profiles in the lung and exert an extended pulmonary exposure [23,24]. However, up to date, few studies have been performed to verify these formulation strategies to enhance pulmonary exposure of inhaled antibiotics in vivo.
In this study, we used CIP as a model drug, which was delivered to the rat lungs via intratracheal instillation to mimic different dissolution rates (fast, medium, and slow) of CIP in the lung. Subsequently, the concentration-time profiles of CIP in the ELF and in the plasma were plotted, respectively to verify the relationship of controlled-release formulations and pulmonary exposure. Additionally, a CIP-specific in silico PBPK model was constructed and verified based on the in vivo data, and further exploited to identify the key factors that influence the absorption and disposition of CIP following different drug exposure rates to the lungs.
Ciprofloxacin hydrochloride, supplied as a dried fine powder, was reconstituted in 0.9% NaCl to prepare solution (10 mg/mL, ciprofloxacin) for administration. Male Sprague-Dawley rats (200-220 g, SPF) were supplied by Liaoning Changsheng Biotechnology Co., Ltd. (China), animal health was certified by China Medical University (SYXK Liao 20180009). All procedures were conducted under the guidelines of experimental animal center of Shenyang Pharmaceutical University and approved by the local Animal Ethics Committee (SYPUIACUCC 2020081272). The targeted dose of ciprofloxacin was 20 mg per kg body weight (4 mg/200 g, ciprofloxacin). These rats were divided into four groups (Ⅳ, T0h, T2h, T4h) and anaesthetized with inhaled ether narcosis. The intravenous bolus injection of ciprofloxacin solution (1 mL, 4 mg/mL) for Ⅳ group was performed via tail vein. The pulmonary groups (T0h, T2h, T4h) were respectively treated with intratracheal instillation of ciprofloxacin solution (0.4 mL, 10 mg/mL) using a highly precise pump (Longer Precision Pump Co., Ltd., Hebei, China) via a polyethylene catheter, and the tip of the catheter was introduced into the rat's trachea with visualization of a laryngoscope, to perform the intratracheal administrations with variable instillation duration, i.e. 0 h, 2 h and 4 h, respectively (Fig. 1), via flow rate settings of the micro-perfusion pump. Animals underwent necropsy immediately at predetermined time points (0.25, 0.5, 1, 2, 4 and 6 h) post dosing for bronchoalveolar lavage (BAL) and blood sampling. The chest cavity of rats was opened, pre-warmed saline was injected into the airways via a polyethylene microtube. BAL sample was immediately collected by aspiration, then centrifuged at 13800 g for 5 min to remove cell debris, transferred the supernatant into a new labeled vial. After that, blood samples were collected by intracardiac puncture (into micro-vacutainer) and centrifuged (13800 g, 5 min) to collect plasma. The lung was freshly harvested and divided into proximal, middle and distal portions, then homogenized with saline. Finally, samples were flash frozen and stored at -20 ℃ until analysis.
These samples were prepared by a protein precipitation method [25,26], as the following steps: An internal reference standard levofloxacin (0.5 µg/mL) was vortex-mixed with aliquots of 200 µL serum or 200 µL BAL. Methanol and perchloric acid solution (5% w/v) were added into the above-prepared samples and vortexed to precipitate the water-soluble proteins, along with centrifugation (13800 g, 10 min) to obtain the supernatant. The supernatant was filtered and then 20 µL aliquot was analyzed by the HPLC. HPLC method was carried out by Hitachi chromatographic system (Hitachi High Technologies Corporation, Tokyo, Japan) equipped with a 5410 UV-detector and Chromaster software. The HPLC analysis was performed using a BDS Hypersil C18 column (5 µm, 250 mm × 4.6 mm ID, Thermo Fisher Scientific, USA) at 30 ℃ and detection wavelength was 297 nm. The mobile phase was composed of methanol, acetonitrile and water mixture supplemented with 0.01 mol/L phosphoric acid and 0.5 mol/L tetrabutylammonium bromide (30:30:430:10, v/v/v/v). Isocratic elution of samples was conducted for 10 min at a flow rate of 1.0 mL/min with a retention time (5.8 min). The calibration curve was constructed by linear regression of the peak areas over the concentration range of approximately 0.2-160 µg/mL (R2 > 0.999). The precision and accuracy of inter-day and intra-day precision were less than 5% for 3 quality control concentrations (10 µg/mL, 50 µg/mL, 150 µg/mL), and the limit of detection and limit of quantitation were 40 ng/ml and 200 ng/mL, respectively. For ELF concentration (Con-ELF), it was estimated from the bronchial alveolar lavage fluid concentrations (Con-BAL) with equation (Eq. 1), where the U was a dilution factor calculated by the urea concentration ratio of plasma with BAL [14].
|
|
(1) |
Commercial software GastroPlusTM (version 9.8.1003, Simulations Plus, Inc. USA) was used as the in silico modeling tool. An additional Pulmonary Compartmental Absorption & Transit (PCATTM) module in the GastroPlusTM was used to estimate drug absorption and disposition following intratracheal administration of the tested formulations. PCATTM model was linked with Advanced Compartmental Absorption and Transit (ACATTM) model of the gastrointestinal (GI) tract to predict the absorption of the swallowed drug fraction, and they were coupled with Physiologically Based Pharmacokinetic (PBPK) model to simulate drug distribution through different tissues/organs. The selected PBPK model used GastroPlusTM default physiology parameters for rat with mean body weight of 0.2 kg. All tissues/organs were treated as perfusion-limitted. Tissue/plasma partition coefficients (Kp) were calculated using the Lukacova (modified Rodgers-Single) equation, where unbound fraction in tissue (fut) was calculated using S+ v9.5 equation. The input parameters for GastroPlusTM simulations (Table 1) were taken from literature, in silico estimated or experimentally determined [27–31].
PKPlusTM module in GastroPlusTM software was used to estimate CIP pharmacokinetic parameters (noncompartmental analysis, NCA) based on the in vivo obtained plasma concentration-time data following intravenous drug administration to rats. The clearance value (CL) used for the simulations was optimized to best describe the drug elimination phase. Moreover, in order to match the volume of distribution (Vss) calculated from the in vivo data, the software calculated Kp values for all organs were multiplied by factor 2.1. Experimentally obtained drug deposition data in rats' lungs (Table S1 in Supporting information) were used as inputs for the simulations. CIP pulmonary absorption rate constant was optimized to match the in vivo data. The predictive power of the designed model was tested by comparing the simulation outcomes with the in vivo data. The percent prediction error (PE%) values between the in vivo observed and in silico predicted PK parameters (Cmax, tmax, AUC0-inf, AUC0-6h) were calculated using equation (Eq. 2). Parameter sensitivity analysis (PSA) was used to assess the influence of the selected input parameters (drug permeability and pulmonary absorption rate constant in thoracic, bronchiolar and alveolar regions) on the predicted pharmacokinetic parameters (Cmax, tmax and AUC0-6h), that describe the rate and extent of CIP absorption.
|
|
(2) |
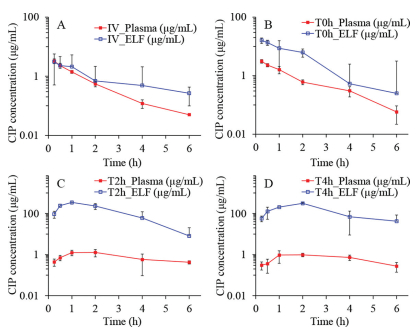
The obtained semi-log concentration-time pharmacokinetic profiles are illustrated in Fig. 2, and the NCA results for the pharmacokinetic parameters corresponding to the plasma and ELF concentrations are shown in Table 2.
 DownLoad:
CSV
DownLoad:
CSV

|
As shown, the Cmax, tmax, and MRT of Ⅳ and T0h groups in the plasma samples are very similar. This can be attributed to the high permeability of CIP molecule and the short distance between the air and the blood in the lung. In contrast, the Cmax of T2h and T4h groups in the plasma samples are much lower than that of the Ⅳ group. This suggests that a slow instillation of CIP to the lung could retard and extend its systemic exposure. However, the overall difference of CIP in the plasma exposure (area under curves, AUC0-t) for all groups are quite smaller than that of ELF exposure. This suggests that the systemic bioavailability of CIP post pulmonary administration would not be influenced by the alteration of the rates of the dissolution or release from the formulations. This may be attributed to the excellent tissue permeability of CIP that resulted in fast infusion into systemic circulation regardless of the delivery routes, with less elimination to untargeted organs [13]. After 6 h, no CIP was detected in plasma for all groups, suggesting CIP is being eliminated quickly from the circulation system.
As observed from the ELF concentration-time profiles of the Ⅳ and T0h group, the concentrations of CIP in the ELF declined rapidly post administration (Figs. 2A and B). This may be attributed to a combined effect of pulmonary elimination and systemic clearance. In contrast, the ELF concentration-time profiles of the T2h and T4h groups exhibited two distinct phases, i.e., an increase in CIP at an initial phase followed by a sharp decline of CIP concentration in the ELF (Figs. 2C and D). The initial increase phase of the CIP concentration-time profiles of T2h and T4h groups can be attributed to the continuous delivery of CIP into the lung. The same volume of CIP solutions was instilled to the lung with different infusion rates. The fast infusion rate might have resulted in a rapid spreading of CIP solutions into the deep airways and wider lung distribution in the lungs as compared to CIP administered with slow infusion rate.
Although the permeation of CIP to the blood is rapid, the instillation rate of CIP might control the permeation rate of CIP through the epithelium. In another words, the drug was accumulated in the ELF due to the continuous instillation of the CIP solutions to the lung.
Following this initial phase, a decline of CIP in the ELF can be observed. It should be noted that other clearance pathway such as mucociliary clearance and lymphatic circulation may have also contributed to the overall elimination process. Notably, the mean lung concentrations exhibited significant decline in the elimination phase for the groups T2h and T4h along with end-instillation and showed similar blood elimination as the groups Ⅳ and T0h. This indicates that the blood elimination behavior of CIP post pulmonary administration does not change with respect to group Ⅳ.
According to the data shown in Table 2, the highest overall exposure of CIP in the lungs was observed for the group T4h, which is followed by the T2h group. The overall lung exposure of the Ⅳ and T0h group are very low though. In contrast, interestingly, the systemic exposure of CIP from the four groups were similar. It suggests that the pulmonary exposure of CIP could be improved by slowing the instillation rate of CIP to the ELF. In addition, the findings of this study also suggest that slowing the instillation rate of CIP to the ELF could increase lung target effects of CIP (Table S2 in Supporting information). It implies that the efficacy of controlled-release CIP formulations may be improved by pulmonary administration.
To justify the selection of the input pharmacokinetic inputs, the resultant elimination half-life (t1/2), calculated based on the selected Vss and CL, was compared with the in vivo values. The model calculated t1/2 fitted into the range of the calculated values (Table S3 in Supporting information). This value also complied with the range of 0.7-1.7 h reported in different literature sources for ciprofloxacin t1/2 in rats [22,31–33].
The simulated CIP plasma concentration-time profiles following administration of intravenous bolus in rats, together with the in vivo observed values was represented in Fig. 3A. It can be observed that the simulated profile matched the in vivo values well. The only discrepancy concerns the predicted Cmax (460.91 µg/mL) which was notably higher in comparison to the in vivo value (3.28 µg/mL), but this can be explained by the late first sampling time in the in vivo study (the first sample was taken after 15 min, which means that the real Cmax value was missed). Figs. 3B-D show the predicted CIP plasma profiles following intratracheal administration of the drug solution with different instillation rates. For the fast IT instillation rate (T0h), the predicted plasma concentration-time profile matched well the shape of the in vivo observed profile (Fig. 3B).
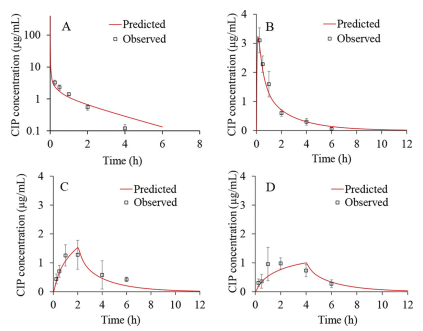
In addition, Table 3 demonstrates that the predicted Cmax, AUC0-inf and AUC0-6h closely resemble the observed ones. This was confirmed by the calculated PE, which was lower than 10%. Only the predicted tmax (0.12 h) diverged from the mean in vivo observed value (0.25 h) but since the first sampling time was 15 min, the real tmax may have been missed, indicating that the simulated value may be a reasonable estimate. In the case of moderate CIP IT instillation rate (T2h), the predicted plasma profile also resembled the shape of the mean in vivo observed profile (Fig. 3C).
DownLoad:
CSV

|
All the predicted pharmacokinetic parameters fitted into the range of individually observed values, except AUC0-inf which was slightly below the observed range (Table 3). The prediction results for CIP slow IT instillation rate of 4 h partly deviated from the mean in vivo plasma profile (Fig. 3D). Namely, according to the simulations, it can be expected that the maximum drug concentration in plasma will be achieved in 4 h, i.e., when the IT instillation of CIP solution is finished. But, according to the in vivo data, tmax was achieved earlier (at 2.00 h), which can be subject to the influx/efflux transepithelial transport [10–12], 19,21]. As for the other pharmacokinetic parameters (Cmax, AUC0-inf and AUC0-6h), the model predicted these values well, as demonstrated by the PE values less than 10% (Table 3).The predicted drug exposure in the whole lung tissue (not ELF), expressed as AUC0-6h, did not show large differences depending on the CIP solution instillation rate (AUC0-6h = 466.73 µg h/mL for T0h, AUC0-6h = 421.88 µg h/mL for T2h, and AUC0-6h = 407.73 µg h/mL for T4h). These data do not fully comply with the in vivo results showing that the drug exposure in ELF for T2h and T4h groups is notably higher than for T0h group. Such discrepancies might be explained by the fact that the in vivo values refer to the drug concentrations in ELF, while the simulated values represent CIP concentrations in the whole lungs. However, there was a notable difference between the predicted AUC0-6h value for total lung concentration-time curve following intravenous administration (AUC0-6h = 66.88 µg h/mL) in comparison to the three intratracheal administration scenarios, which complies with the in vivo results.
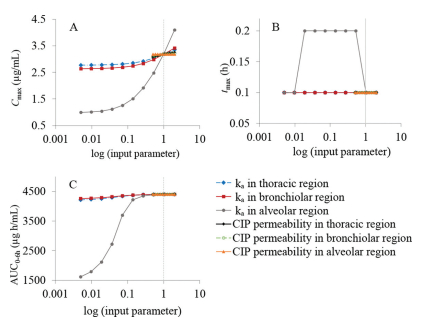
The generated CIP-specific model was also used to test several input parameters for their influence on the rate and extent of CIP absorption following intratracheal administration in rats. According to the PSA results, pulmonary absorption rate constant in alveolar region was identified as the key parameter with the highest effect on the predicted Cmax, tmax and AUC0-6h following CIP IT instillation (Fig. 4). The absorption rate constants in thoracic and bronchiolar regions showed minimal effect on Cmax and AUC0-6h values. Also, CIP permeability through different lung regions did not affect any of the predicted pharmacokinetic parameters.
This study demonstrates that an extended exposure of ciprofloxacin (model fluoroquinolone) in the lung can be achieved via a controlled-release strategy in an intratracheal installation model in rats. A whole body PBPK model, established through iterative comparison between the predicted and observed results revealed that pulmonary absorption rate in alveolar region has a strong ability to extend lung exposure of ciprofloxacin. The absorption rate is usually a net result of drug, formulation and physiological properties, thus inhaled medicines for lung infection are worth being developed if considering both controlled-release formulation potential and decreased lung tissue permeability (e.g., due to the thick covering bacterial biofilm in the airways). Furthermore, this study suggests that combination of intratracheal installation model and in silico PBPK model is a useful approach to identify the key limiting factors that influence the in vivo disposition of inhaled drugs.
The authors declare that they have no known competing financial interests or personal relationships that could have appeared to influence the work reported in this paper.
This work was financially supported by the Liaoning Pan Deng Xue Zhe Scholar (No. XLYC2002061), the National Natural Science Foundation of China (No. 81573380), and the Overseas Expertise Introduction Project for Discipline Innovation ("111 Project") (No. D20029). D.Cun acknowledges financial support from the Guiding Project for Science and Technology of Liaoning Province (No. 2019-ZD-0448), and Ministry of Education Chunhui Program (2020). The authors acknowledge support from Ministry of Education Science and Technological Development, Republic of Serbia (No. 451-03-9/2021-14/200161).
Supplementary material associated with this article can be found, in the online version, at doi:10.1016/j.cclet.2022.04.061.
Q. Zhou, S.S.Y. Leung, P. Tang, et al., Adv. Drug Deliv. Rev. 85 (2015) 83–99. doi: 10.1016/j.addr.2014.10.022
J.K. Mukker, R.S.P. Singh, H. Derendorf, Adv. Drug Deliv. Rev. 85 (2015) 57–64. doi: 10.1016/j.addr.2015.03.002
Y. Guo, H. Bera, C. Shi, et al., Acta Pharm. Sin. B 11 (2021) 2565–2584. doi: 10.1016/j.apsb.2021.05.015
P.C. Sharma, A. Jain, S. Jain, et al., J. Enzyme Inhib. Med. Chem. 25 (2010) 577–589. doi: 10.3109/14756360903373350
N. Günday Türeli, A. Torge, J. Juntke, et al., Eur. J. Pharm. Biopharm. 117 (2017) 363–371. doi: 10.1016/j.ejpb.2017.04.032
X. Zheng, Q. Cao, Q. Cao, et al., Chin. Chem. Lett. 31 (2020) 413–417. doi: 10.1016/j.cclet.2019.07.063
D. Cipolla, J. Blanchard, I. Gonda, Pharmaceutics 8 (2016) 1–31. doi: 10.3390/pharmaceutics8010001
E. Gullberg, S. Cao, O.G. Berg, et al., PLoS Pathog. 7 (2011) 1–10.
E. Wenzler, D.R. Fraidenburg, T. Scardina, et al., Clin. Microbiol. Rev. 29 (2016) 581–632. doi: 10.1128/CMR.00101-15
T. Karampitsakos, O. Papaioannou, M. Kaponi, et al., Pulm. Pharmacol. Ther. 60 (2020) 101885. doi: 10.1016/j.pupt.2019.101885
J. Brillault, W.V. De Castro, W. Couet, Antimicrob. Agents Chemother. 54 (2010) 543–545. doi: 10.1128/AAC.00733-09
H.X. Ong, D. Traini, M. Bebawy, et al., Antimicrob. Agents Chemother. 57 (2013) 2535–2540. doi: 10.1128/AAC.00306-13
J.E. Hastedt, P. Bäckman, A.R. Clark, et al., AAPS Open 2 (2016) 1–20. doi: 10.1186/s41120-015-0002-x
A.V.L. Gontijo, J. Brillault, N. Grégoire, et al., Antimicrob. Agents Chemother. 58 (2014) 3942–3949. doi: 10.1128/AAC.02818-14
J. Brillault, F. Tewes, W. Couet, et al., Eur. J. Pharm. Sci. 97 (2017) 92–98. doi: 10.1016/j.ejps.2016.11.011
F. Tewes, J. Brillault, B. Lamy, et al., Mol. Pharm. 13 (2016) 100–112. doi: 10.1021/acs.molpharmaceut.5b00543
B. Lamy, F. Tewes, D.R. Serrano, et al., J. Control. Release 271 (2018) 118–126. doi: 10.1016/j.jconrel.2017.12.021
S. Yu, S. Wang, P. Zou, et al., Int. J. Pharm. 575 (2020) 118915. doi: 10.1016/j.ijpharm.2019.118915
G. Chai, H. Park, S. Yu, et al., Int. J. Pharm. 569 (2019) 118616. doi: 10.1016/j.ijpharm.2019.118616
I. Khatib, D. Khanal, J. Ruan, et al., Int. J. Pharm. 566 (2019) 641–651. doi: 10.1016/j.ijpharm.2019.05.068
J. Weers, Pulm. Ther. 5 (2019) 127–150. doi: 10.1007/s41030-019-00104-6
P.J. McShane, J.G. Weers, T.E. Tarara, et al., Pulm. Pharmacol. Ther. 50 (2018) 72–79. doi: 10.1016/j.pupt.2018.03.005
Q. Wang, L. Ge, L. Wang, et al., Chin. Chem. Lett. 32 (2021) 1071–1076. doi: 10.1016/j.cclet.2020.03.062
J. Du, J. Guo, D. Kang, et al., Chin. Chem. Lett. 31 (2020) 1695–1708. doi: 10.1016/j.cclet.2020.03.028
U. Neckel, C. Joukhadar, M. Frossard, et al., Anal. Chim. Acta 463 (2002) 199–206. doi: 10.1016/S0003-2670(02)00429-4
S. Watabe, Y. Yokoyama, K. Nakazawa, et al., J. Chromatogr. B: Anal. Technol. Biomed. Life Sci. 878 (2010) 1555–1561. doi: 10.1016/j.jchromb.2010.04.012
S. Hansmann, Y. Miyaji, J. Dressman, Eur. J. Pharm. Biopharm. 122 (2018) 186–196. doi: 10.1016/j.ejpb.2017.10.019
J.F. Schlender, D. Teutonico, K. Coboeken, et al., Clin. Pharmacokinet. 57 (2018) 1613–1634. doi: 10.1007/s40262-018-0661-6
M.E. Olivera, R.H. Manzo, H.E. Junginger, et al., J. Pharm. Sci. 100 (2011) 22–33. doi: 10.1002/jps.22259
M. Rodríguez-Ibáñez, G. Sánchez-Castaño, M. Montalar-Montero, et al., Int. J. Pharm. 307 (2006) 33–41. doi: 10.1016/j.ijpharm.2005.09.014
M.H. Park, S.H. Shin, J.J. Byeon, et al., Korean J. Physiol. Pharmacol. 21 (2017) 107–115. doi: 10.4196/kjpp.2017.21.1.107
S. Li, Y. Yu, X. Bian, et al., Arch. Toxicol. 95 (2021) 1683–1701. doi: 10.1007/s00204-021-03023-1
B. Nouaille-Degorce, C. Veau, S. Dautrey, et al., Antimicrob. Agents Chemother. 42 (1998) 289–292.

Figure 1 Protocol for delivering ciprofloxacin to the rat lungs with diverse rates but the same drug dose (20 mg/kg). T0h-blue, T2h-red and T4h-green indicate instillation time within 2 min, 2 h and 4 h, respectively.

Figure 2 Observed time-concentration profiles of CIP in plasma and lung ELF post dosing. (A) Ⅳ, injection; (B) T0h, instillation: fast rate; (C) T2h, instillation: middle rate; (D) T4h, instillation: slow rate (n = 4, Mean ± SD).

Figure 3 Predicted and observed CIP plasma concentration-time profiles following 4 mg intravenous bolus administration (A), fast IT instillation (B), moderate IT instillation (C) and slow IT instillation (D) of 4 mg strength infusion solution.

Figure 4 PSA results for the influence of drug permeability and absorption rate constants in thoracic/bronchiolar/alveolar regions on the predicted Cmax (A), tmax (B), and AUC0-6h (C) for fast IT instillation of CIP solution; vertical dotted lines represent the initial input values. Data for the other groups comply with these results.
Table 2. Pharmacokinetic parameters of the plasma and ELF concentrations post administration by PKPlus TM.
|
|
 下载: 导出CSV
Table 3. Predicted and observed pharmacokinetic parameters for CIP IT instillation (fast/moderate/slow).
|
|
下载: 导出CSV

 扫一扫看文章

扫一扫关注我们
