Citation:
Fangfang Chang, Panpan Su, Utsab Guharoy, Runping Ye, Yanfu Ma, Huajun Zheng, Yi Jia, Jian Liu. Edge-enriched N, S co-doped hierarchical porous carbon for oxygen reduction reaction[J]. Chinese Chemical Letters,
2023, 34(2): 107462.
doi:
10.1016/j.cclet.2022.04.060
Edge-enriched N, S co-doped hierarchical porous carbon for oxygen reduction reaction
English
Edge-enriched N, S co-doped hierarchical porous carbon for oxygen reduction reaction
State Key Laboratory of Catalysis, Dalian Institute of Chemical Physics, Chinese Academy of Sciences, Dalian 116023, China
b.
University of Chinese Academy of Sciences, Beijing 100049, China
c.
Department of Applied Chemistry and Zhejiang Carbon Neutral Innovation Institute, Zhejiang University of Technology, Hangzhou 310032, China
d.
DICP-Surrey Joint Centre for Future Materials, Department of Chemical and Process Engineering, University of Surrey, Guildford, Surrey GU2 7XH, United Kingdom
* Corresponding author. ** Corresponding author at: State Key Laboratory of Catalysis
jianliu@dicp.ac.cn (J. Liu). 1 These authors contributed equally to this work.
Received Date:
26 November 2021 Accepted Date:
24 April 2022 Revised Date:
16 March 2022 Available Online:
15 February 2023
Abstract:
The development of carbon materials with high electrochemical performance for next-generation energy device is emerging, especially N, S co-doped carbon materials have sparked intensive attention. However, the exploration of N, S co-doped carbon with well-defined active sites and hierarchical porous structures are still limited. In this study, we prepared a series of edge-enriched N, S co-doped carbon materials through pyrolysis of thiourea (TU) encapsulated in zeolitic imidazolate frameworks (TU@ZIF) composites, which delivered very good oxygen reduction reaction (ORR) performance in alkaline medium with onset potential of 0.94 V vs. reversible hydrogen electrode (RHE), good stability and methanol tolerance. Density functional theory (DFT) calculations suggested that carbon atoms adjacent to N and S are probable active sites for ORR intermediates in edge-enriched N, S co-doped carbon materials because higher electron density can enhance O2 adsorption, lower formation barriers of intermediates, improving the ORR performance comparing to intact N, S co-doped carbon materials. This study might provide a new pathway for improving ORR activity by the integration engineering of edge sites, and electronic structure of heteroatom doped carbon electrocatalysts.
Oxygen reduction reaction (ORR) with sluggish kinetics limits the efficiency of various next-generation energy device, such as rechargeable metal-air batteries, fuel cells [1,2]. At present, the platinum (Pt)-based materials are prototypical ORR catalysts. However, the high cost and scarcity of Pt hinders its large-scale deployment, and motivates the development of high-activity ORR catalysts based on inexpensive materials [3,4].
In recent years, research has focused upon the development of ORR catalysts with inexpensive materials such as granulated metal-based catalysts (Fe3C, Co9S8, etc.) [5,6], single-atom catalysts (Fe-N-C, Co-N-C, Mn-N-C, etc.) [7,8] and carbon-based metal-free electrocatalysts) [9]. Carbon-based materials have emerged as promising alternatives for Pt-based ORR catalysts, due to their outstanding properties of good stability and tunable activity [10]. Unfortunately, the pristine carbon with sp2 conjugated structure is catalytically inert for electrocatalytic reaction [11]. Many strategies have been proposed to boost the electrocatalytic ORR activity of carbon-based materials. Among them, heteroatoms (B, N, S, etc.) doping induced electronic asymmetry in carbon-based catalysts has been demonstrated as a good strategy to promote ORR activity [12,13]. Furthermore, co-doping of N and S with different atomic radius and electronegativity can alter the electronic distribution of the adjacent carbon atoms to a great degree to realize high ORR activity. Liang et al. have reported that the co-doping of S and N in graphene resulted in asymmetrical spin and charge density on the adjacent carbon atoms, which in turn increase O2 interaction resulting in enhanced ORR [14]. Zhao and Xia stated that the synergistic effect between N and S occurred within a distance shorter than 7.5 Å, which stabilized the adsorbates and accelerated the kinetics of ORR [15]. Alternatively, the electronic density of states in carbon matrix was demonstrated to be strongly enhanced at the edges compared with the pristine graphene [16]. Recently, it was reported that edge-hosted Fe-N4 sites via porosity engineering delivered superior ORR activity [17-19], high selectivity for CO2 electroreduction to CO [20]. Compared to the non-edge-hosted Fe-N4, the structure of edge-hosted Fe-N4 decrease the overall ORR barriers and improve the intrinsic activity of catalysts. In addition, the edge induced by pore also can modulate the electron state in Fe-NS system and show excellent oxygen reduction catalytic activity [21]. Thus, decorating N and S atoms with precise configuration into the edge sites of carbon architecture is essential for optimizing the catalytic performance as well as exploring the origin of enhanced intrinsic activity from atomic level. However, the compositional diversity and structural complexity of N, S co-doped carbon materials make it a considerable challenge.
Besides the enhancement of intrinsic activity via heteroatom doping, the pore structure with sufficient availability to the active sites is another crucial design principle to enhance the performance of carbon-based catalysts. Compared to micropore, the mesopore is more favorable for mass transport [22,23]. Through appropriate porosity has been produced by several templates such as silica or surfactants [24,25], the tedious procedure of removing templates, which is an energy-consuming process, hampers the application of these mesoporous N, S co-doped carbon materials [26,27]. Considering the intrinsic activity and availability for active sites, it is highly desirable to prepare hierarchical porous carbon with N, S co-doped edge sites by a facile approach.
Herein, we report the synthesis of edge-enriched N, S co-doped hierarchical porous carbon materials by pyrolysis of the composites of thiourea (TU) encapsulated in zeolitic imidazolate framework-8 (ZIF-8). The obtained edge-enriched N, S co-doped carbon materials can be used directly without further purification. During the pyrolysis process, the encapsulated thiourea molecules are not only as the sulfur precursor, but also can simultaneously create pores and edge-sites within the carbon skeleton. The resulting pores play a vital role in not only increasing the intrinsic activity of carbon atom site by creating the edge site with increasing electron density, but also improving reactant transfer to the active sites. Therefore, the obtained edge-enriched N, S co-doped carbon catalysts exhibit remarkable catalytic activity for ORR. This work will provide the underlying insight into the pore influence for ORR activity and guidance for designing highly active carbon-based electrocatalysts through edge-site engineering at atomic level.
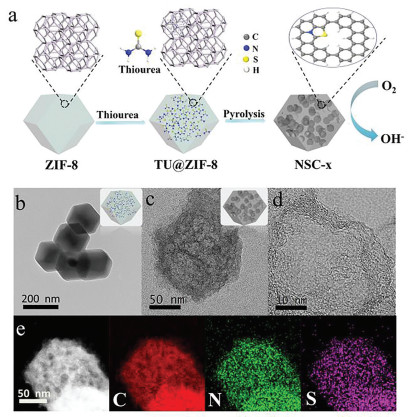
Fig. 1a illustrates the synthetic steps of edge-enriched N, S co-doped hierarchical porous carbon. In this approach, thiourea molecules were first impregnated into the pore of ZIF-8 to form TU@ZIF-8 nanocomposites. Subsequently, the nanocomposites were carbonized in N2 atmosphere at 1000 ℃ for 2 h, and then the edge-enriched N, S co-doped hierarchical porous carbon was obtained and denoted as NSC-x (x means the mass of TU added). The prepared ZIF-8 exhibited a typical rhombic dodecahedron with an average particle size of 200 nm (Fig. S1a in Supporting information), X-ray diffraction (XRD) pattern showed that the synthesized ZIF-8 showed a similar crystal structure to the ones reported previously (Fig. S2 in Supporting information) [19]. As per our expectation, the morphology and crystal structure of TU@ZIF-8 nanocomposites were well remained (Fig. 1b and Fig. S2). According to N2 adsorption/desorption analysis, TU@ZIF-8 exhibited a reduced surface area and pore volume compared with ZIF-8 (Fig. S3 and Table S1 in Supporting information), which confirmed the successful encapsulation of thiourea molecules into the pores of ZIF. Using urea as the impregnation precursor instead of thiourea, the prepared urea@ZIF-8 showed similar features to TU@ZIF-8 (Figs. S1b, S3 and Table S1 in Supporting information), indicating urea molecules were also encapsulated in the structure of ZIF-8.
Figure 1
Figure 1.
(a) Schematic illustration of the synthetic process of NSC-x catalysts. (b) TEM image of TU@ZIF-8 composite. (c, d) TEM images of NSC-10. (e) HRTEM images of NSC-10 and the corresponding elemental mapping images for C, N and S elements.
The morphologies of prepared NSC-x were explored via scanning electron microscopy (SEM) and transmission electron microscopy (TEM). Fig. S4 (Supporting information) displays the morphologies evolution for NSC-x by changing the TU amount. Obviously, with a low TU addition of 7 mg, individual hole arises in NSC-7, resulting in the geometrically promoted new active sites along the holes. With the amount of TU increasing to 10 mg, more mesoporous structures were created (Fig. S5c in Supporting information) in NSC-10, which shows a polyhedron morphology with lumpy surface (Fig. S5d in Supporting information). Further increasing the amount of TU to 15 mg, large amounts of pores maybe fused into large hollow structure. In addition, the nitrogen doped porous carbon (NC) was prepared as control sample by carbonizing ZIF-8 directly, which inherits the polyhedron morphology of the precursors (Figs. S5a and b in Supporting information). Meanwhile, the nitrogen doped porous hollow carbon (HNC) was prepared by carbonizing urea@ZIF-8 under identical conditions as NSC-10 (Figs. S5e and f in Supporting information).
The abundant mesoporous structures of NSC-10 were clearly observed in the TEM image, as shown in Fig. 1c. And the abundant graphene layer also can be seen around the pore (Fig. 1d). High-angle annular dark field scanning TEM (HAADF-STEM) and the corresponding elemental mapping show that C, N and S elements are homogeneously dispersed over the entire carbon framework, confirming the S doping (Fig. 1e).
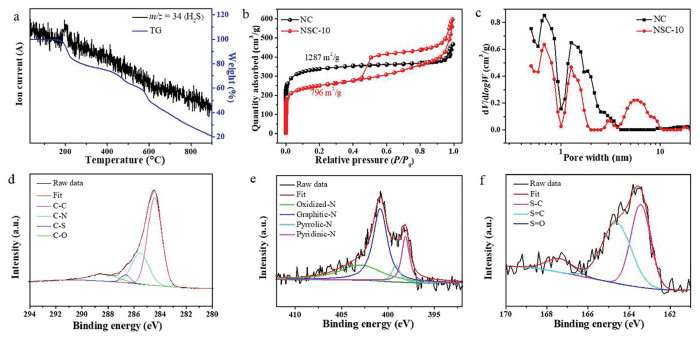
Thermogravimetry tests were conducted to analyze the pyrolysis behaviors of thiourea, ZIF-8 and TU@ZIF-8 under N2 atmosphere. Thiourea was rapidly decomposed below 300 ℃. In contrast, ZIF-8 maintained stable with low weight loss until the temperature was above 500 ℃. TU@ZIF-8 exhibited a dramatically endothermic peak at around 200 ℃, which can be ascribed to the decomposition of impregnated thiourea (Fig. S6a in Supporting information). H2S ion fragments have been detected by a mass analyzer (Fig. 2a). In order to investigate the function of thiourea, TU@ZIF-350 was prepared when TU@ZIF-8 was carbonized at 350 ℃. The TU@ZIF-350 nanocomposites had the similar crystal structure as ZIF-8 (Fig. S7 in Supporting information). However, the formation of mesopores could be observed for TU@ZIF-350 (Fig. S8a in Supporting information). Because the thermal decomposition temperature of thiourea is lower than that of ZIF-8, the thiourea within ZIF-8 firstly started to decompose and generate plentiful gases. The trapped gases created substantial internal stresses and strains, leading to the formation of mesoporous architecture, thus producing more edge-sites in carbon matrix [28]. Therefore, thiourea can be used as a pore-forming agent for not only hierarchical pore creation but also edge-site engineering. In addition, the released gases also could be employed as an efficient S-doping agent, which can tune the electron structure due to the larger atomic radius of S than C and N atom [29]. Furthermore, the S atoms are preferred to replace the carbon atoms when co-doped with N [30]. Thus, the S atoms show a high synergetic effect with N atoms, which has been validated to optimize the ORR performance [14]. The urea@ZIF-8 exhibited similar pyrolysis behavior to TU@ZIF-8 (Figs. S6b and S8b in Supporting information). The structure difference of NSC-10 and HNC maybe contributed to that thiourea molecules would disperse inside the whole structure uniformly, while urea molecules accumulated in the cavity of ZIF with the existence of hydrogen bonds between urea molecules.
Figure 2
Figure 2.
(a) TG curve of TU@ZIF-8 (blue) and the mass signal of H2S ion fragment (black). (b) N2 adsorption/desorption isotherms for NC and NSC-10. (c) The pore size distributions for NC and NSC-10. (d) C 1s high-resolution XPS spectrum of NSC-10. (e) S 2p high-resolution XPS spectrum of NSC-10. (f) N 1s high-resolution XPS spectrum of NSC-10.
In the XRD patterns of NC, HNC and NSC-10, these carbons displayed two broad diffraction peaks at around 23° and 44°, which are indexed to the carbon crystal face of (002) and (101), respectively (Fig. S9 in Supporting information) [31]. In the Raman spectra, the carbons exhibited the typical D band (disordered/defect carbon) and G band (graphitic carbon) located at 1353 cm−1 and 1590 cm−1, respectively (Fig. S10 in Supporting information) [32]. The ratio of peak intensity corresponding to D band and G band (ID/IG) for NSC-10 and NC were almost the same around 0.9, implying that the formation of mesopore does not induce more defects [20]. This observation was consistent with the previous reports that defective degree is not enhanced even if creating pores on the carbon followed by high-temperature treatment [33].
The N2 adsorption/desorption was carried out to measure the pore structure and specific surface area of the carbon materials and the feature parameters of these prepared carbon materials were summarized in Table S2 (Supporting information). As demonstrated in Fig. 2b, the N2 adsorption/desorption isotherm of NC was type-Ⅰ, a typical characteristic of microporous structure, whereas NSC-10 exhibited type-Ⅳ N2 adsorption/desorption isotherm with typical H3 hysteresis loop, confirming the presence of mesoporous structure. In addition, the corresponding pore size distribution indicated that the NSC-10 possesses ultra-micropore, micropore and mesopore with the distribution around 0.7, 1.4 and 6 nm, respectively, further confirming the hierarchical pore structure of the NSC-10. For NC, only micropores with diameters of 0.7 and 1.4 nm were observed (Fig. 2c). The surface area of NSC-10 was 796 m2/g substantially lower than that of NC (1287 m2/g), while the pore volume of NSC-10 was 0.92 cm3/g larger than that of NC (0.71 cm3/g). The results of other carbon materials (HNC, NSC-7 and NSC-15) were shown in Fig. S11 (Supporting information).
Surface chemical compositions were further determined by X-ray photoelectron spectroscopy (XPS). The survey spectrum confirmed C, O, N and S elements existed in NSC-10 (Fig. S12a in Supporting information). The spectrum of C 1s for NSC-10 could be deconvoluted into four peaks. The C 1s binding energies (BEs) of C—C, C—N, C—S and C—O was 284.4 eV, 285.5 eV, 286.6 eV and 288.2 eV, respectively (Fig. 2d) [34]. In contrast, only the C 1s BEs of C—C, C—N and C—O species could be found for NC (Fig. S13a in Supporting information). The S 2p BEs at 163.4, 164.6 and 167.3 eV of NSC-10 could be assigned to S—C, S=C and S=O, respectively (Fig. 2e) [13]. All the above results confirmed that S atoms were successfully doped into the carbon structure of NSC-10. Meanwhile, the N species of NSC-10 was deconvoluted into four peaks, including pyridinic-N (398.2 eV), pyrrolic-N (400.0 eV), graphitic-N (400.8 eV), and oxidized-N (404.4 eV), respectively (Fig. 2f), similarly to those of NC (Fig. S13b in Supporting information) [35]. The content of N was 3.06% for NSC-10 and 3.78% for NC, while the content of graphitic N decreased from 1.78% for NC to 1.45% for NSC-10, indicating that more edge sites were incorporated into the carbon structure of NSC-10 (Fig. S12b in Supporting information). These edge sites can effectively modulate the electron structure, then further improving the intrinsic activity of active sites.
As shown in Table S3 (Supporting information), the oxygen content for NSC-10 (8.19%) was significantly reduced in comparison to that for NC (11.7%), which can be explained by the reactions between NH3 and oxygen groups in the carbon framework, resulting in the formation of C—N bond [36]. All these results indicate that the activation of NH3 and H2S not only increases the mesoporous of NC, but also significantly restructures the active sites, both of which are critical for enhancing ORR performance.
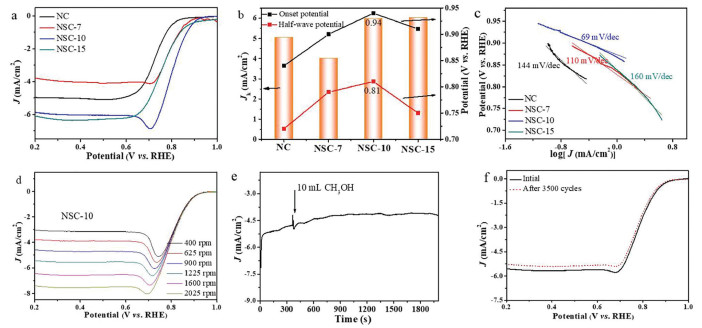
Cyclic voltammetry (CV) measurements in O2 or N2-saturated 0.1 mol/L KOH solution were used to evaluate the electrocatalytic activity of NSC-10. No redox-peak was observed in the N2-saturated solution, while an apparent oxygen reduction peak emerged in the O2-saturated solution, suggesting an efficient electrocatalytic activity for ORR (Fig. S14 in Supporting information). Linear sweep voltammetry (LSV) measurements were further employed to examine the electrocatalytic activity of NSC-x (Fig. 3a) and control samples (NC and HNC) (Fig. S15 in Supporting information). Remarkably, the NSC-10 exhibited the most positive onset potential (Eonset) and E1/2 than the other samples. The Eonset and E1/2 derived from LSV curves are also showed in Fig. 3b, and summarized in Table S4 (Supporting information). NSC-10 showed excellent activity with an onset potential and a half-wave potential of 0.94 V and 0.81 V, respectively, which were more positive than that of NC (0.84 and 0.72 V), NSC-7 (0.9 and 0.79 V) and NSC-15 (0.91 and 0.75 V). The NSC-10 exhibited more excellent performance even compared with other carbon materials (Table S5 in Supporting information). It also exhibited good activity in acidic solution toward ORR (Fig. S17 in Supporting information). We adopt the kinetic limiting current (Jk) from the Koutecky-Levich (K-L) plots at 0.8 V to verify the potential application of NSC-x as an ORR catalyst. Calculated Jk at 0.8 V potential (NC: Jk-0.8 = 0.55 mA/cm2; NSC-7: Jk-0.8 = 3.2 mA/cm2; NSC-10: Jk-0.8 = 8.33 mA/cm2; NSC-15: Jk-0.8 = 2.52 mA/cm2) revealed that NSC-10 was an efficient ORR catalyst. Because the Jk of NSC-10 was higher than other samples, we think that the enhanced ORR performance is derived from the intrinsic activity of edge-enriched N, S co-doped carbon materials [37]. Furthermore, the Tafel slope of NSC-10 (69 mV/dec) was much smaller than that of NC (144 mV/dec), NSC-7 (110 mV/dec) and NSC-15 (160 mV/dec), which demonstrated the fast reaction kinetics of NSC-10 (Fig. 3c). This could be a result of abundant pore structure in NSC-10 providing more active, highly exposed and approachable catalytic sites to participate in ORR. The electrocatalytic kinetics of NSC-10 samples were examined by LSV measurements at different rotating speeds (from 400 to 2025 rpm). As demonstrated in Fig. 3d, the onset potential retained the same while the current densities were increased with the rotating speed, suggesting the process of ORR on NSC-10 was kinetics-controlled [38]. The corresponding K-L plots suggested first-order kinetic toward the concentration of O2 in the electrolyte during the ORR [39,40].
Figure 3
Figure 3.
(a) LSV curves of different carbon materials in O2-saturated 0.1 mol/L KOH with a scan rate of 10 mV/s, extracting background N2 current. (b) Comparison of onset potential, half-wave potential and Jk for different catalysts. (c) Corresponding Tafel plots obtained from the LSV curves. (d) LSV curves of NSC-10 at different rotating rates from 400 rpm to 2025 rpm at a scan rate of 10 mV/s. (e) The chronoamperometric curve of NSC-10 by adding 10 mL methanol after about 400 s. (f) LSV curves of NSC-10 before and after 3500 successive cycles at a rotation rate of 1600 rpm.
The rotating ring-disk electrode (RRDE) study further verified the high selectivity of NSC-10 catalyst towards the 4 e− reduction of oxygen. NSC-10 catalyze ORR reaction with a HO2− yield below 10% and electron transfer number per oxygen molecule (n) of 3.8–4.0 at 0.3–0.7 V, both of which suggested that the ORR process was close to 4 e− process (Fig. S16 in Supporting information). Resistance of NSC-10 to methanol poisoning was also measured. As shown in Fig. 3e, the current density suffers no obvious change with the presence of methanol in the electrolyte, indicating that the NSC-10 was tough to the toxic reagent of methanol [41]. As the most active electrocatalyst, NSC-10 was subjected to the accelerated CV test for 3500 cycles to evaluate its stability. There was a negligible decrease of 0.27 mA/cm2 for diffusion-limited current (Fig. 3f), suggesting excellent durability of the NSC-10 catalyst. Overall, the excellent ORR performance was synergistically improved by the superior activity and facilitated accessibility to interior active sites, which make edge-enriched N, S co-doped carbon materials promising candidates for the next-generation energy system.
NC catalyst with Zn present (0.89% from ICP-OES) showed poor ORR activity, which reveals that trace Zn had slight influence on activity. Therefore, we think the trace Zn makes little contribution to activity, which could be ignored.
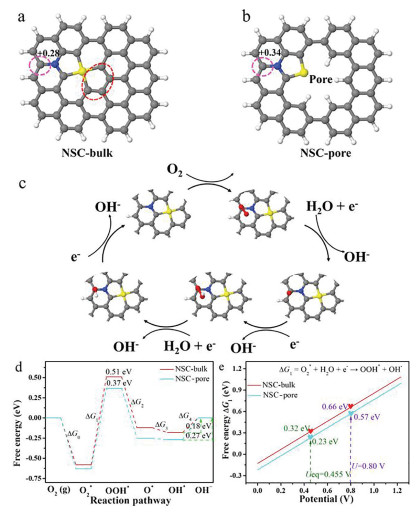
To explore the nature of the high ORR activity of NSC-10, we further performed density functional theory (DFT) calculations to understand the pore edge effect on the intrinsic ORR activity of NSC-10. The detailed computational methods are shown in Table S6-S9 (Supporting information). Three types of representative N, S co-doped graphene models (NSC-bulk, NSC-pore and NSC-edge) are considered. The NSC-pore model was formed by removing 4 carbon atoms from the NSC-bulk (shown with a red dotted circle in Fig. 4a) and thereafter the pore edges were passivated with hydrogen (Fig. 4b). In addition, Figs. 4a and b showed that the most active sites for the ORR on NSC-bulk and NSC-pore, which are located on the nearby carbon atoms of the graphene layer of the considered models. The detailed discussion about possible active sites on the model of NSC-bulk and NSC-pore were shown in Figs. S19 and S20 (Supporting information). Furthermore, Bader charge analysis indicates that these carbon sites on NSC-bulk and NSC-pore possess a positive charge of +0.28 and +0.34, respectively [42]. A higher positive charge on NS-pore leads to effective chemical activation of O2 [14]. Three configurations of NSC-edge model are calculated, according to the relative location of N and S atoms (graphitic (g-NS), pyridinic (py-NS) and oxide NS (O—NS)). The detail calculations were presented carefully in Fig. S18 (Supporting information).
Figure 4
Figure 4.
(a, b) The models for NS-bulk and NS-edge. The gray, blue, white and yellow represents carbon, nitrogen, hydrogen and sulfur atoms, respectively. (c) Proposed reaction pathway on NS-pore. (d) The free energy profiles of active sites on NS-bulk, NS-pore and NS-edge are drawn at equilibrium potential (0.455 V) corresponding to an alkaline media with pH 13. (e) Free energy of ∆G1 reaction steps as a function of electrode potential.
The considered ORR mechanism for an alkaline electrolyte comprises of 4e− reduction process, as shown in Fig. 4c. Fig. 4d shows that the formation of O2* → OOH* is the rate-determining step (RDS) of ORR on NSC-bulk and NSC-pore. The formation barrier of OOH* on NSC -bulk site is 0.51 eV, while the introduction of pore edge in graphene lowers the formation barrier of OOH* to 0.37 eV, which indicated that the presence of pore edge favors the formation of OOH* species. Interestingly, the desorption of OH* intermediate (∆G4) is calculated to be relatively easier on NSC-bulk than that on NSC-pore. Therefore, the above free energy analysis shows that ORR reaction steps (∆G1 & ∆G4) play a key role in determining the ORR activity on both the considered models. To deeply understand the effect of electrode potential on the ∆G1 and ∆G4 reaction steps, free energy plots for the mentioned reaction steps during the electrode potential of 0 − 1.23 V are shown in Fig. 4e and Fig. S21 (Supporting information). Fig. 4e showcases the formation of OOH* (∆G1) to be endothermic at equilibrium potential (Ueq = 0.455 V) on NSC- bulk and NSC-pore models which becomes strongly endogenic at onset potential (0.80 V vs. RHE). However, the endogenic nature of the ∆G1 reaction step on the NSC-pore is comparatively lower of 0.23 eV & 0.57 eV at electrode potentials (0.455 and 0.80 V), respectively, compared to NSC-bulk. Additionally, the desorption of OH* → OH− (∆G4), is endothermic at both equilibrium and onset potentials with easier OH desorption witnessed on NSC-bulk. It is worth to mention that the ∆G4 value is lower than ∆G1, thus, NSC-pore with lower ∆G4 value shows higher ORR activity. These values also suggest the pore edge has a positive effect on ORR, and this agreed well with the experimental results, revealing the origin of the high activity of edge-enriched N, S co-doped carbon. Overall, a faster O2 activation accompanied with a lower OOH* formation barrier showcases the positive nature of a porous NS doped graphene catalyst surface for ORR. Although some literature reported that mesopores are beneficial for the formation of H2O2 [43], in our system, 4 e− process is thermodynamically dominant, which results in high selectivity for H2O product.
In summary, edge-enriched N, S co-doped carbon electrocatalysts have been designed and synthesized through the pyrolysis of TU@ZIF nanocomposites. The decomposition of thiourea molecules during pyrolysis has simultaneously achieved doping sulfur into the carbon framework, and generating abundant pores together with edge sites in the carbon based electrocatalysts. The prepared NSC-10 exhibited excellent ORR activity in alkaline electrolyte. Theoretical calculations demonstrated that induced edge sites can enhance the intrinsic activity by increasing the charge density of carbon atom adjacent to N and S in N, S co-doped carbon materials, which enhance the O2 absorption and lower the formation barrier of intermediate species (OOH*). This work might provide an alternative approach for design of N, S co-doped carbon electrocatalyst with well-defined active sites and understanding the active sites for electrochemical conversion.
Declaration of competing interest
The authors declare no conflict of interest.
Acknowledgments
This work was supported financially by the National Natural Science Foundation of China (No. 21905271), Liaoning Natural Science Foundation (No. 20180510029), the Dalian National Laboratory for Clean Energy (DNL), DNL Cooperation Fund, Chinese Academy of Sciences (No. DNL180402).
Supplementary materials
Supplementary material associated with this article can be found, in the online version, at doi:10.1016/j.cclet.2022.04.060.
J. Park, Y. Nabae, T. Hayakawa, M.A. Kakimoto, ACS Catal. 4(2014) 3749–3754. doi: 10.1021/cs5008206
Figure 1
(a) Schematic illustration of the synthetic process of NSC-x catalysts. (b) TEM image of TU@ZIF-8 composite. (c, d) TEM images of NSC-10. (e) HRTEM images of NSC-10 and the corresponding elemental mapping images for C, N and S elements.
Figure 2
(a) TG curve of TU@ZIF-8 (blue) and the mass signal of H2S ion fragment (black). (b) N2 adsorption/desorption isotherms for NC and NSC-10. (c) The pore size distributions for NC and NSC-10. (d) C 1s high-resolution XPS spectrum of NSC-10. (e) S 2p high-resolution XPS spectrum of NSC-10. (f) N 1s high-resolution XPS spectrum of NSC-10.
Figure 3
(a) LSV curves of different carbon materials in O2-saturated 0.1 mol/L KOH with a scan rate of 10 mV/s, extracting background N2 current. (b) Comparison of onset potential, half-wave potential and Jk for different catalysts. (c) Corresponding Tafel plots obtained from the LSV curves. (d) LSV curves of NSC-10 at different rotating rates from 400 rpm to 2025 rpm at a scan rate of 10 mV/s. (e) The chronoamperometric curve of NSC-10 by adding 10 mL methanol after about 400 s. (f) LSV curves of NSC-10 before and after 3500 successive cycles at a rotation rate of 1600 rpm.
Figure 4
(a, b) The models for NS-bulk and NS-edge. The gray, blue, white and yellow represents carbon, nitrogen, hydrogen and sulfur atoms, respectively. (c) Proposed reaction pathway on NS-pore. (d) The free energy profiles of active sites on NS-bulk, NS-pore and NS-edge are drawn at equilibrium potential (0.455 V) corresponding to an alkaline media with pH 13. (e) Free energy of ∆G1 reaction steps as a function of electrode potential.

 DownLoad:

 下载:
下载:


