Scheme 1.
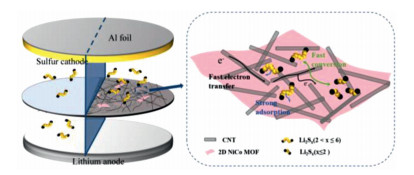
Schematic diagram of the 2D NiCo MOF/CNT interlayer in lithium–sulfur batteries.
Ultrathin two-dimensional bimetal NiCo-based MOF nanosheets as ultralight interlayer in lithium-sulfur batteries
Pingli Feng , Wenshuo Hou , Zhe Bai , Yu Bai , Kening Sun , Zhenhua Wang

Nowadays, as the demand for energy in portable electronic devices and electric vehicles continues to increase, there is an urgent need to develop high-energy-density energy storage devices [1-4]. Traditional lithium-ion batteries have achieved great success, but their theoretical capacity is limited. Therefore, it is necessary to develop alternative energy storage systems with high energy density and safety advantages. Due to the high theoretical specific capacity (1675 mAh/g) and high theoretical energy density (2600 Wh/kg), as well as the rich natural reserves and low cost of sulfur, lithium-sulfur (Li-S) batteries have become one of the promising next-generation high-energy storage systems [5-8]. However, the cathode active material sulfur and the discharge product (Li2S2/Li2S) have poor conductivity. LIPSs are easily dissolved in the electrolyte and cause the "shuttle effect". During the cycle, the cathode volume expands severely (~80%). The above-mentioned problems lead to low utilization rate of active materials, fast capacity decay, low coulombic efficiency, and corrosion of lithium anodes of lithium-sulfur batteries, etc., which hinder the commercial development of Li-S batteries [9-13].
Compared with conventional battery systems such as lithium-ion batteries, Li-S batteries have an ultra-high theoretical specific energy density. Inserting a barrier layer between the cathode and the separator to intercept the diffused polysulfide has proven to be an effective way to effectively improve the electrochemical performance of lithium-sulfur batteries [14, 15]. However, considering that the additional interlayer in the system inevitably increases the weight and weakens the energy density advantage of the battery, it is very important to develop an effective but lightweight interlayer [16]. Benefiting from various structures and abundant active sites, MOFs have aroused great interest in many research fields, such as gas storage and separation, sensing, luminescence, catalysis, and energy conversion [17-22]. Tang et al. suggest that the coupling effect between Ni and Co metals is crucial for tuning the electrocatalytic activity [39]. MOFs and their derivatives have been used in Li-S batteries, but their performance still can be improved [23-26]. Promising strategies have been applied to the design of multifunctional MOFs, including for crystal structure modulation, size/morphology and composition control [27-29]. As we all know, the dimensionality of a material largely determines its basic properties. Due to the characteristics of high specific surface area and relatively high surface energy, two-dimensional (2D) materials have been developed with unique physical and chemical properties, which cannot be achieved by their bulk counterparts [30-32]. Among them, the ultra-thin 2D MOF with nanometer thickness has a number of exposed and accessible active sites and improved conductivity, promotes electron transfer, allows rapid mass transfer, and ensures close contact between the catalyst and the electrolyte [33, 34]. Among them, the application of 2D materials such as graphene, BP, MXene and MoS2 in lithium-sulfur batteries have also received extensive attention. In addition, it has been confirmed that the intrinsic activity is enhanced due to the coordination environment of the active site of the multi-metal MOF is uniquely changed by the synergistic effect of mixed metals. It exhibits stronger catalytic activity than single metal MOF [35, 36]. Meng et al. also proved the Ni-MOF is more effective in catalyzing the reduction of long-chain polysulfides, while Co-MOF benefits the Li2S deposition kinetics [37].
In this work, we have prepared a series of ultrathin two-dimensional metal organic frameworks (2D Ni MOF, 2D Co MOF and 2D NiCo MOF) through a facile solution reaction route. As expected for two-dimensional materials, 2D MOFs with a thickness of a few nanometers are very light. It can not only provide rapid mass transfer and charge transfer, but also improve catalytic performance due to the abundant, exposed and accessible active sites. At the same time, in terms of composition and structure, two-dimensional bimetal NiCo-based MOF (denoted as 2D NiCo MOF) combines many more advantages. Due to the synergistic effect of mixed metals and the unique coordination environment around the active site, the intrinsic activity of each site is enhanced [38]. The mixed MOF and carbon nanotubes (CNT) are coated on the Celgard 2500 by a simple vacuum filtration method. CNT builds a conductive network to enhance electronic conductivity while preventing the migration of polysulfides as a physical barrier (Scheme 1). The Li-S battery with 2D NiCo MOF/CNT interlayer of about 1 mg/cm2 exhibited a high initial discharge capacity of 1132.7 mAh/g at 0.5 C and presents great cycle stability.
The 2D NiCo MOF nanosheets are prepared by a simple sonochemical synthesis (Fig. S1 in Supporting information). The XRD patterns of the 2D MOFs shown in Fig. S2a (Supporting information) are similar to the previously reported results [39]. All diffraction patterns have a main peak around 2θ = 8.9°, corresponding to the (200) plane of the MOF crystal. In order to further understand the structure of the 2D MOFs, the typical layered structure of MOFs is shown in Fig. S1. Both Ni and Co atoms are octahedrally coordinated by six O atoms, and these pseudo-octahedrons are along the (200) crystal plane. The [010]/[001] direction is further edge/corner connected, forming a two-dimensional bimetallic layer separated by BDC molecules [40]. The structure of 2D Ni MOF or 2D Co MOF is the similar as that of the 2D NiCo MOF, except that the single Ni or Co as coordination center (Fig. S2 in Supporting information). Due to the partially terminated BDC coordinate bonding with the surface metal atoms, the ultrathin structure of the 2D MOFs is expected to produce coordinated unsaturated metal sites on the exposed surface [34]. In the Raman spectrum (Fig. S3b in Supporting information), the same peaks appear in the three 2D MOFs. The four peaks at 1610, 1413, 1176 and 1135 cm−1 on the right belong to the in-plane vibration mode of the aromatic ring, while the three on the left are associated with the peaks of the BDC ligand [41].
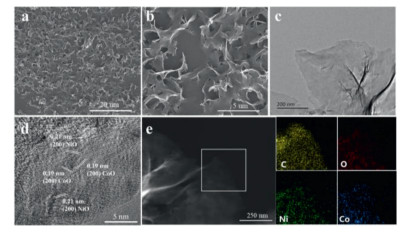
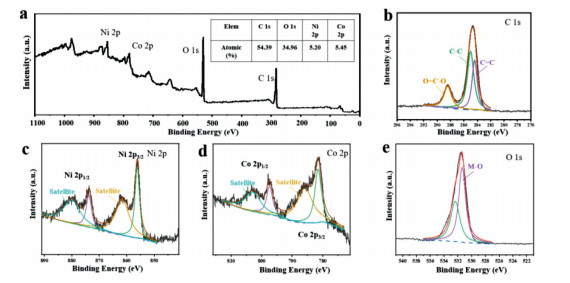
SEM and TEM images revealed the two-dimensional ultrathin nanosheet morphology of 2D MOFs, in which the flexible nanosheets at the edges curl spontaneously when dried (Figs. 1a-c, Fig. S4 in Supporting information). The high-resolution TEM (HRTEM) image shows clear lattice fringes (Fig. 1d, Figs. S4c and f), where the (200) crystal plane of NiO and CoO have a lattice spacing of 0.21 nm and 0.19 nm, respectively. These two lattice fringes can be observed simultaneously in 2D NiCo MOF. The composition analysis by energy dispersive spectroscopy (EDS) (Fig. 1e) confirms that the 2D NiCo MOF are composed of C, O, Ni and Co without other constituent impurities. The element mapping on the nanosheets shows uniform distribution of these elements throughout the entire 2D NiCo MOF surfaces. The EDS of single-metal 2D Ni MOF and 2D Co MOF are shown in Figs. S4 and S5 (Supporting information), which also show that C, O and metal elements are evenly distributed on the nanosheets. The chemical composition and oxidation state of 2D MOFs were studied by XPS. The XPS measurement spectrum of the single-metal 2D Ni MOF (Fig. S7a in Supporting information) shows the presence of C, O and Ni with 55.81:33.50:10.69 for atomic content ratio. The high-resolution Ni 2p spectrum (Fig. S7b in Supporting information) shows two main peaks located at 856.3 eV and 874.0 eV, deconvoluted into Ni 2p3/2 and Ni 2p1/2, respectively. Two corresponding satellite peaks located at 861.4 and 879.6 eV. The XPS of the single-metal 2D Co MOF (Fig. S7c in Supporting information) shows the presence of C, O and Co elements with 58.19:31.92:9.89 for atomic content ratio. Similarly, the Co 2p spectrum (Fig. S7d in Supporting information) shows two main peaks deconvoluted into Co 2p3/2 (781.4 eV) and Co 2p1/2 (797.3 eV). There are other two peaks belong to the corresponding satellite peaks located at 785.9 and 803.0 eV. The XPS of the bimetallic 2D NiCo MOF (Fig. 2a) shows that the four elements Ni, Co, C and O are present at the same time with 54.39:34.96:5.20:5.45 for atomic content ratio. The Co 2p spectrum also shows two main peaks (Fig. 2d). In addition, compared to the Ni MOF, the Ni 2p peaks of bimetallic 2D NiCo MOF (Fig. 2c) are shifted by around 0.4 eV in the direction of lower binding energy. This is because the electronegativity of Ni2+ (9.60) is higher than that of Co2+ (9.10), which causes part of the charge transfer from Co to the Ni center through the ligand in the bimetallic 2D NiCo MOFs, resulting in a greater electron density in the Ni center. This kind of mixed metal synergy and the unique coordination environment around the active site will enhance the intrinsic activity of each site and improve the catalytic performance [35]. For the C 1s spectrum (Fig. 2b), the three peaks at 284.4, 285.0, and 288.4 eV are assigned to C=C, C-C and O=C-O, respectively. Finally, the O 1s spectrum (Fig. 2e) can be deconvoluted into two peaks located at 531.4 and 532.4 eV, which are attributed to M-O of pseudo-octahedrons and oxygen components on terephthalate linkers, respectively. N2 adsorption-desorption isotherms are used to study the porosity of 2D MOFs (Fig. S8 in Supporting information). The measured Brunauer-Emmett-Teller (BET) specific surface areas of 2D NiCo MOF, 2D Ni MOF and 2D Co MOF are 49.66, 42.24 and 22.79 m2/g, respectively. It shows that NiCo bimetallic can enlarge the specific surface areas by changing the interlayer spacing of MOF as a kind of heteroatom doping. In addition, the Barrett-Joyner-Halenda (BJH) pore size distribution shows that the average pore diameters of 2D NiCo MOF, 2D Ni MOF and 2D Co MOF are 8.4, 7.1 and 6.7 nm, respectively. These micro-mesopores can effectively provide a certain degree of physical confinement for LiPSs, which will improve cycle stability and electrochemical performance.
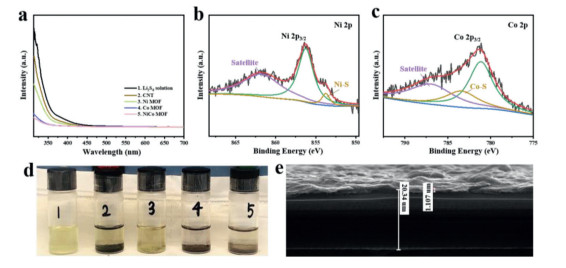
In order to further demonstrate the adsorption abilities of different 2D MOFs. It can be seen that the Li2S6 electrolyte with 2D NiCo MOF has the lightest color, followed by 2D Co MOF (Fig. 3). The color of the electrolyte with 2D Ni MOF is lighter than that of CNT, but it is still deeper than the other two counterparts. The similar trend can be found in the ultraviolet/visible absorption spectra of Li2S6 electrolyte (Fig. 3a). The 2D NiCo MOF presents the weakest absorption peak, which means that almost no Li2S6 remains in the electrolyte. This is due to the stronger chemisorption between bimetal 2D NiCo MOF and polysulfide. The X-ray photoelectron spectroscopy (XPS) was used to show how 2D NiCo MOF interacts with LiPSs. After interacting with Li2S6, 2D NiCo MOF-Li2S6 not only presents the peaks of C, O, Ni, Co, but also the peaks of S (Fig. S9 in Supporting information). Ni 2p and Co 2p still retain the main peaks and satellite peaks corresponding to Ni 2p3/2 and Co 2p3/2. At the same time, two additional peaks are deconvoluted into Ni-S and Co-S bonds at 853.7 eV and 783.4 eV, respectively (Figs. 3b and c). Moreover, the strength of the Co-S bond is significantly stronger than that of the Ni-S bond, reflecting a stronger interaction between the Co site and Li2S6 than that of the Ni site under the same conditions. In order to simulate the real environment in a Li-S battery, the permeation experiments were conducted in a visual H-shaped glass device (Fig. S10 in Supporting information). The ultrathin 2D MOFs/CNT interlayer (Fig. 3e and Fig. S12 in Supporting information) was loaded onto the Celgard 2500 separator by vacuum filtration. The polysulfide permeates to the right under the effect of the concentration difference with the passage of time. The electrolyte with 2D NiCo MOF/CNT interlayer has nearly no change after 6 h with hardly no shuttling of LIPSs. While the CNT interlayer starts changing to yellow after 1 h and then turns much deeper after 6 h, shows the most diffusion amount. The diffusion amount of the 2D Co MOF/CNT is slightly more than that of the 2D NiCo MOF, and the color of the 2D Ni MOF/CNT is deeper than the other two counterparts (Fig. 3d). This phenomenon is consistent with the results of the previous adsorption experiment, indicating that the 2D MOFs/CNT interlayer can effectively block the shuttle of polysulfides under ultrathin condition. The above results indicate 2D Co MOF has a stronger barrier to polysulfides than 2D Ni MOF under the same conditions due to the stronger Co-S bond. At the same time, 2D NiCo MOF has a larger specific surface and exposes more accessible active sites. It can provide a stronger adsorption for LiPSs by forming more Co-S bonds and Ni-S bonds.
The excellent adsorption performance of LiPSs can not only effectively inhibit the shuttle effect, but also facilitate the rapid liquid-liquid conversion (Li2S8 ↔ Li2S6 ↔ Li2S4) and liquid-solid conversion (Li2S4 ↔ Li2S) in Li-S chemistry [42-44]. The cyclic voltammetry (CV) of Li2S6 symmetric battery was measured to gain insight of the oxidation–reduction kinetics in liquid-liquid conversion. As shown in Fig. 4a, the CV curve of a symmetrical battery without Li2S6 provides very small capacitance current, while all Li2S6 symmetrical batteries exhibit a clear current response. This indicates that the double-layer capacitor has almost no contribution to the total current and current response, and the current response is only due to the redox reaction of Li2S6. 2D NiCo MOF/CNT presents the largest redox current among the four CV curves, indicating that 2D NiCo MOF/CNT can effectively enhance the redox kinetics to achieve the liquid-liquid conversion of LiPSs. For single-metal MOF, the redox current of 2D Ni MOF/CNT is higher than that of 2D Co MOF/CNT, indicating that 2D Ni MOF/CNT catalyzes the liquid phase conversion of long-chain polysulfides to short-chain polysulfides more strongly than 2D Co MOF/CNT. As supported by the Li2S nucleation experiment, MOFs can also enhance the redox kinetics of LiPSs liquid-solid conversion (Figs. 4b-e). Specifically, the precipitation capacity of Li2S on CNT, 2D Ni MOF/CNT, 2D Co MOF/CNT and 2D NiCo MOF/CNT is 124.64, 197.66, 158.74 and 245.11 mAh/gs, respectively. In addition, the current peak appearance time of 2D NiCo MOF/CNT (3250.2 s) is close to that of 2D Ni MOF/CNT (3180.5 s). Both of them are much shorter than that of 2D Co MOF/CNT (5891.3 s). This result confirms the 2D Ni MOF/CNT has a stronger catalytic activity than 2D Co MOF/CNT between the single-metal MOFs, which is also consistent with the CV result. The CNT shows the latest current peak (9594.6 s). The high capacity of Li2S precipitation and the short time of the current peak indicate that 2D NiCo MOF/CNT can effectively promote the conversion from Li2S4 to Li2S and induce uniform deposition of Li2S on the surface of the cathode. These results confirm that 2D NiCo MOF/CNT has a strong catalytic effect on both the liquid-liquid and liquid-solid conversion of LiPSs, enhancing the oxidation–reduction kinetics. This can be attributed to the 2D NiCo MOF/CNT exposing a large number of accessible active sites and the synergistic effect of mixed metals.
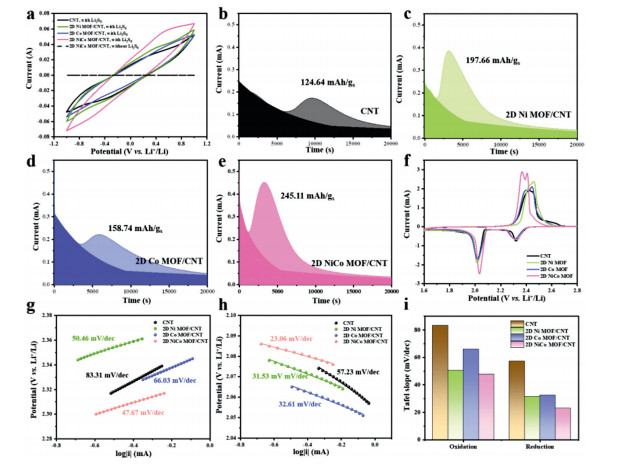
CV was performed to study the redox kinetics in the Li-S battery (Fig. 4f). The two reduction peaks located around 2.28 V and 2.01 V represent the continuous reduction process from S8 to Li2Sx (4 ≤ x ≤ 6) and Li2Sx (4 ≤ x ≤ 6) to Li2S/Li2S2, respectively. The oxidation peak around 2.42 V and 2.44 V represents the oxidation process from Li2S/Li2S2 to Li2Sx and S8 [45]. 2D NiCo MOF/CNT has the highest reduction and oxidation current peak, and the current peak of single-metal Ni MOF/CNT is higher than that of Co MOF/CNT. At the same time, the oxidation peak of 2D NiCo MOF/CNT shifts to a low potential and the reduction peak shifts to a high potential, leading to the smallest polarization overpotential compared with others. The Tafel plots of the oxidation (2.36 V) peak and the reduction (2.03 V) peak in the CV curve were calculated to compare the catalytic of 2D MOFs. During the oxidation process, the fitting slopes of CNT, 2D Ni MOF/CNT, 2D Co MOF/CNT and 2D NiCo MOF/CNT were 83.31, 50.46, 66.03 and 47.67 mV/dec, respectively (Fig. 4g). During the reduction process, the fitting slopes of CNT, 2D Ni MOF/CNT, 2D Co MOF/CNT, and 2D NiCo MOF/CNT were 57.23, 31.53, 32.61 and 23.06 mV/dec, respectively (Fig. 4h). The redox slopes of 2D MOFs/CNT are all smaller than that of CNT. In addition, 2D NiCo MOF/CNT has the lowest oxidation and reduction slopes, indicating its strongest catalytic activity for the rapid redox conversion between LiPSs and Li2S in Li-S batteries (Fig. 4i). These results indicate that 2D MOFs/CNT can effectively catalyze the rapid conversion of polysulfides. Moreover, this catalytic effect has been further amplified in 2D NiCo MOF/CNT due to the larger specific surface area of the two-dimensional structure and the synergistic effect of mixed metals.
In order to further prove the positive role of 2D MOFs/CNT as the interlayer in Li-S battery, CNT, 2D Ni MOF/CNT, 2D Co MOF/CNT and 2D NiCo MOF/CNT were vacuum filtered onto Celgard 2500, separately. The SEM shows that the 2D MOFs are uniformly dispersed in CNTs on the surfaces of these interlayers (Fig. S11 in Supporting information). It providing large specific surface and a large number of exposed active sites for chemical adsorption of polysulfides. At the same time, the micro-mesoporous structure of 2D MOFs can also effectively block polysulfides physically. Moreover, evenly dispersed CNT creates a cross-linked conductive network for the interlayer to ensure the rapid transfer of electrons during the electrochemical reaction. The cross-sectional SEM image shows that the interlayer is in close contact with the separator through vacuum filtering (Fig. S12 in Supporting information), thus ensuring their stability during the charge-discharge cycle. According to measurement, the thickness of the coating layer is only around 1 µm with 0.08–0.12 mg/cm2 mass loading. The MOF of the two-dimensional nanosheet structure can fully meet the characteristics of light weight and thin enough. It will not weaken the advantage of the energy density of the Li-S battery and provide a new idea for the selection of interlayer materials.
The rate performance of the battery using the 2D NiCo MOF/CNT interlayer is significantly improved due to the accelerated electrochemical reaction. The discharge capacities of 2D NiCo MOF/CNT at 0.2, 0.5, 1, 2 and 3 C are 1170.6, 920.6, 805.6, 731.4 and 691.7 mAh/g, respectively (Fig. 5a). When the current density decreases back to 0.2 C, a reversible capacity of 941.1 mAh/g can be restored, showing excellent capacity recovery ability. Moreover, the discharge platform of 2D NiCo MOF/CNT is still stable at about 2.0 V at 3 C, due to the large specific surface brought by the two-dimensional structure and a large number of exposed active sites, which enhances the interaction of substances and the synergistic catalytic ability of mixed metals. 2D Ni MOF/CNT and 2D Co MOF/CNT exhibit lower capacity than 2D NiCo MOF/CNT at all current densities, while CNT has the lowest capacity (561.6 mAh/g at 3 C). Fig. 5b and Fig. S12 show the details of the polarization and charge-discharge curves of cells with different interlayers at all current densities. Comparing the two single-metal MOF, the polarization voltage of 2D Ni MOF/CNT is lower than that of 2D Co MOF/CNT when current density greater than 0.2 C. It is attributed to the higher catalytic activity of 2D Ni MOF/CNT. The polarization of 2D bimetal NiCo MOF/CNT is the smallest at all current densities. Especially, it is only 0.366 V at 3 C, which is much lower than CNT (0.622 V). This excellent rate performance and low polarization can be attributed to the large number of active sites exposed by the unique two-dimensional structure of 2D NiCo MOF/CNT and the synergistic effect of mixed metals, which accelerates the redox kinetics.
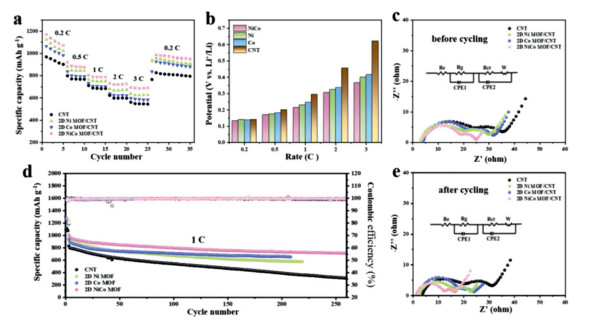
Long cycle performance tests were carried out at 0.5 C (Fig. S14 in Supporting information) and 1 C (Fig. 5d) to verify the excellent cycle stability of 2D NiCo MOF/CNT. The initial discharge capacity of cell with CNT, 2D Ni MOF/CNT, 2D Co MOF/CNT, and 2D NiCo MOF/CNT can reach 868.5, 1010.4, 1002.6 and 1132.7 mAh/g at 0.5 C, respectively. It also remains 432.3, 530.8, 523, and 709.1 mAh/g after 300 cycles. After 200 cycles of 1 C, the discharge capacity remains 394.3, 587.8, 663.1, and 736.5 mAh/g, respectively. Interestingly, the capacity of 2D Co MOF/CNT is gradually higher than that of 2D Ni MOF/CNT after 48 cycles at 1 C, which may be attributed to the stronger interaction between 2D Co MOF and polysulfides, leading to better cycling stability. It was notable that a fixed volume of electrolyte (10 µL) was used for a sulfur loading of 1.2 mg/cm2, indicating that cells with 2D MOF/CNT are operated under lean electrolyte conditions (E/S = 7.35 µL/mgs2) (Fig. S17 in Supporting information). It is worth noting that the ultra-thin and light 2D MOFs/CNT interlayer also shows good compatibility with the high-load sulfur battery (Fig. S18 in Supporting information). When the cathode sulfur loading is 2.5, 4.1 and 5.3 mg/cm2, the Li-S battery with 2D NiCo MOF/CNT interlayer can still achieve 969.9, 897.2 and 784 mAh/g. The high specific capacity of 729.6, 602.8 and 487.8 mAh/g can be maintained after 200 cycles. Fig. S17 shows the charge and discharge curves of different sulfur loading at 10, 20, 50, 100 and 200 cycles. Above result shows 2D NiCo MOF/CNT still has excellent electrochemical performance under severe conditions. It is worth noting that when the sulfur load is 5.2 mg/cm2, the specific capacity gradually increases during the first 22 cycles. It reaches a high specific capacity of 895.1 mAh/g at the 22nd cycle, and then begins to decay. This is attributable to the redistribution and utilization of sulfur during the charge-discharge cycle under high sulfur loading, indicating that 2D NiCo MOF/CNT can induce uniform deposition.
The AC impedance spectra was explored to prove the excellent kinetics of LiPSs conversion in 2D MOFs/CNT before and after the cycling (Figs. 5c and e). The fitted resistance parameters of Rct and Rg are summarized in Table S1 (Supporting information). Due to the different combinations of interfacial resistances and capacitances, all batteries exhibit two semicircles from high to middle frequency [46]. The Rg before cycling is the interface impedance caused by the interface contact of the interlayer. The increase of Rg was attributed to the formation of the Li2S/Li2S2 insulating layer after cycling. It is worth noting that the 2D NiCo MOF/CNT showed the lowest Rg after cycling, which can be attributed to the enhanced conversion from Li2S/Li2S2 to S8. The lowest Rct of 2D NiCo MOF/CNT before and after cycling indicates the fastest charge transfer between electrode and electrolyte. The combination of 2D NiCo MOF and CNT can effectively capture and reuse the soluble LIPSs, exhibiting the lowest Rg and reducing Rct during cycling. Due to the inhibition migration and the enhanced reuse of the LIPSs trapped in the coating, the cell with a 2D NiCo MOF/CNT interlayer exhibits better cycle performance than others. In addition, disassemble the battery after cycling to observe the surface morphology of the lithium anode (Fig. S20 in Supporting information). The lithium anode surface of the cell with 2D NiCo MOF/CNT interlayer is smoother, indicating the lowest degree of corrosion. This result can be attributed to the effective blocking of polysulfide shuttling and the acceleration of the electrochemical conversion of LiPSs by the 2D NiCo MOF/CNT interlayer, which reduces the reaction of polysulfides with lithium anode and plays a role in anode protection.
In summary, two-dimensional MOF nanosheets with super lightweight, large specific surface and more active sites can be obtained through simple sonochemical synthesis methods. Moreover, the activity of the active sites of the bimetal MOF are enhanced, benefiting from the synergistic effect of mixed metals. The interlayer obtained by mixing 2D MOFs and CNT can effectively block the shuttle of polysulfides and improve the conversion of polysulfides. The cell with a 2D NiCo MOF/CNT interlayer exhibits strongest cycling stability and lowest capacity decay rate. It is worth mentioning that this ultra-thin (~1 µm) and ultra-light (~0.1 mg/cm2) interlayer will not weaken the advantages of the high energy density of Li-S batteries. This research enriches the choice of materials and provides a new strategy for the development of effective and lightweight interlayer for Li-S batteries.
The authors report no declarations of interest.
This work was financially supported by the National Natural Science Foundation of China (No. 22179007). We also thank Analysis & Testing Center, Beijing Institute of Technology for providing XRD equipment.
Supplementary material associated with this article can be found, in the online version, at doi:
D. Tian, X. Song, M. Wang, et al., Adv. Energy Mater. 9 (2019) 1901940. doi: 10.1002/aenm.201901940
F. Hu, H. Peng, T. Zhang, et al., J. Energy Chem. 58 (2021) 115–123. doi: 10.1016/j.jechem.2020.09.032
S. Qi, H. Wang, J. He, et al., Sci. Bull. 66 (2021) 685–693. doi: 10.1016/j.scib.2020.09.018
Y.W. Song, J.L. Qin, C.X. Zhao, et al., J. Energy Chem. 64 (2022) 568–573. doi: 10.1016/j.jechem.2021.05.023
X. Wu, N. Liu, B. Guan, et al., Adv. Sci. 6 (2019) 1900958. doi: 10.1002/advs.201900958
B. Guan, Y. Zhang, L. Fan, et al., ACS Nano 13 (2019) 6742–6750. doi: 10.1021/acsnano.9b01329
R. Sun, Y. Bai, M. Luo, et al., ACS Nano 15 (2021) 739–750. doi: 10.1021/acsnano.0c07038
G. Ye, M. Zhao, L.P. Hou, et al., J. Energy Chem. 66 (2022) 24–29. doi: 10.1016/j.jechem.2021.07.010
M. Zhao, B.Q. Li, H.J. Peng, et al., Angew. Chem. Int. Ed. 59 (2020) 12636–12652. doi: 10.1002/anie.201909339
D.M. Zhu, T. Long, B. Xu, et al., J. Energy Chem. 57 (2021) 41–60. doi: 10.1016/j.jechem.2020.08.039
M. Zhao, X. Chen, X.Y. Li, B.Q. Li, J.Q. Huang, Adv. Mater. 33 (2021) e2007298. doi: 10.1002/adma.202007298
M. Zhao, X.Y. Li, X. Chen, et al., eScience 1 (2021) 44–52. doi: 10.1016/j.esci.2021.08.001
Y. Feng, H. Liu, Q. Lu, et al., J. Power Sources 520 (2022) 230885. doi: 10.1016/j.jpowsour.2021.230885
L. Fan, M. Li, X. Li, et al., Joule 3 (2019) 361–386. doi: 10.1016/j.joule.2019.01.003
C.X. Zhao, X.Y. Li, M. Zhao, et al., J. Am. Chem. Soc. 143 (2021) 19865–19872. doi: 10.1021/jacs.1c09107
J.Q. Huang, Q. Zhang, F. Wei, Energy Storage Mater. 1 (2015) 127–145. doi: 10.1016/j.ensm.2015.09.008
A. Indra, T. Song, U. Paik, Adv. Mater. 30 (2018) 1705146. doi: 10.1002/adma.201705146
D. Feng, T. Lei, M.R. Lukatskaya, et al., Nature Energy 3 (2018) 30–36. doi: 10.1038/s41560-017-0044-5
G. Lan, K. Ni, R. Xu, et al., Angew. Chem. Int. Ed. 56 (2017) 12102–12106. doi: 10.1002/anie.201704828
T. Rodenas, I. Luz, G. Prieto, et al., Nature Mater. 14 (2015) 48–55. doi: 10.1038/nmat4113
C. Ma, Y. Mo, L. Liu, Y. Yu, A. Chen, Chin. Chem. Lett. 32 (2021) 1485–1490. doi: 10.1016/j.cclet.2020.08.041
C. Wang, X. Li, W. Yang, Y. Xu, H. Pang, Chin. Chem. Lett. 32 (2021) 2909–2913. doi: 10.1016/j.cclet.2021.04.017
K. Xiao, J. Wang, Z. Chen, et al., Small 15 (2019) e1901454. doi: 10.1002/smll.201901454
Q. Wang, H. Zhao, B. Li, et al., Chin. Chem. Lett. 32 (2021) 1157–1160. doi: 10.1016/j.cclet.2020.09.022
J. Li, C. Jiao, J. Zhu, et al., J. Energy Chem. 57 (2021) 469–476. doi: 10.1016/j.jechem.2020.03.024
Q. Wang, H. Zhao, B. Li, et al., Chin. Chem. Lett. 32 (2021) 1157–1160. doi: 10.1016/j.cclet.2020.09.022
W. Zhang, X. Jiang, X. Wang, et al., Angew. Chem. Int. Ed. 56 (2017) 8435–8440. doi: 10.1002/anie.201701252
M. Zhao, Y. Wang, Q. Ma, et al., Adv. Mater. 27 (2015) 7372–7378. doi: 10.1002/adma.201503648
L. Wang, Z. Wei, M. Mao, et al., Energy Storage Mater. 16 (2019) 434–454. doi: 10.1016/j.ensm.2018.06.027
J. Wang, N. Li, Y. Xu, H. Pang, Chemistry (Easton) 26 (2020) 6402–6422.
Z. Bao, C. Lu, X. Cao, et al., Chin. Chem. Lett. 32 (2021) 2648–2658. doi: 10.1016/j.cclet.2021.02.012
X.Y. Li, S. Feng, M. Zhao, et al., Angew. Chem. Int. Ed. 61 (2022) e202114671.
J.S. Qin, D.Y. Du, W. Guan, et al., J. Am. Chem. Soc. 137 (2015) 7169–7177. doi: 10.1021/jacs.5b02688
Z. Fang, B. Bueken, D.E. De Vos, R.A. Fischer, Angew. Chem. Int. Ed. 54 (2015) 7234–7254. doi: 10.1002/anie.201411540
Q. Qian, Y. Li, Y. Liu, L. Yu, G. Zhang, Adv. Mater. 31 (2019) e1901139. doi: 10.1002/adma.201901139
F.L. Li, P. Wang, X. Huang, et al., Angew. Chem. Int. Ed. 58 (2019) 7051–7056. doi: 10.1002/anie.201902588
R. Meng, Q. Du, N. Zhong, et al., Adv. Energy Mater. 11 (2021) 2102819. doi: 10.1002/aenm.202102819
J. Jin, Y. Zheng, S.Z. Huang, et al., J. Mater. Chem. A 7 (2019) 783–790. doi: 10.1039/C8TA09327J
S. Zhao, Y. Wang, J. Dong, et al., Nature Energy 1 (2016) 16184. doi: 10.1038/nenergy.2016.184
K. Rui, G. Zhao, Y. Chen, et al., Adv. Funct. Mater. 28 (2018) 1803291. doi: 10.1002/adfm.201803291
S. He, X. Zhou, Z. Li, et al., ACS Appl. Mater. Interfaces 9 (2017) 26907–26914. doi: 10.1021/acsami.7b07843
M. Wang, L. Fan, X. Wu, et al., J. Mater. Chem. A 7 (2019) 15302–15308. doi: 10.1039/C9TA03361K
B. Guan, L. Fan, X. Wu, et al., J. Mater. Chem. A 6 (2018) 24045–24049. doi: 10.1039/C8TA09301F
L. Peng, Z. Wei, C. Wan, et al., Nature Catal. 3 (2020) 762–770. doi: 10.1038/s41929-020-0498-x
F. Liu, G. Sun, H.B. Wu, et al., Nat. Commun. 11 (2020) 5215. doi: 10.1038/s41467-020-19070-8
H.J. Peng, G. Zhang, X. Chen, et al., Angew. Chem. Int. Ed. 55 (2016) 12990–12995. doi: 10.1002/anie.201605676

Scheme 1 Schematic diagram of the 2D NiCo MOF/CNT interlayer in lithium–sulfur batteries.

Figure 1 (a, b) SEM, (c) TEM and (d) HRTEM image of 2D NiCo MOF, respectively. (e) HAADF image and corresponding EDS mappings of 2D NiCo MOF.

Figure 2 XPS spectra of 2D NiCo MOF. (a) Survey spectrum, (b) C 1s, (c) Ni 2p, (d) Co 2p and (e) O 1s. The inserted table summarizes the atomic ratio of elements.

Figure 3 (a) Ultraviolet/visible absorption spectra of the Li2S6 electrolyte before and after contact with CNT and 2D MOFs. (b) Ni 2p and (c) Co 2p spectrums of 2D NiCo MOF after adsorption of Li2S6 solution. (d) Graphs of Li2S6 solutions with different absorbers. (e) Cross-section SEM images of 2D NiCo MOF/CNT interlayer.

Figure 4 CV curves of (a) Li2S6-symmetric cells employing CNT and 2D MOFs/CNT as electrodes at 100 mV/s. Fitting of current vs. time curve for potentiostatic discharge at 2.10 V on (b) CNT, (c) 2D Ni MOF/CNT, (d) 2D Co MOF/CNT and (e) 2D NiCo MOF/CNT. (f) CV curves of the cells with different interlayers at a scan rate of 0.1 mV/s. Tafel plots calculated from the (g) oxidation peak at 2.36 V and (h) reduction peak at 2.03 V in (f). (i) Tafel slopes derived from (g) and (h).

 扫一扫看文章

扫一扫关注我们
 DownLoad:
 下载:
下载:
