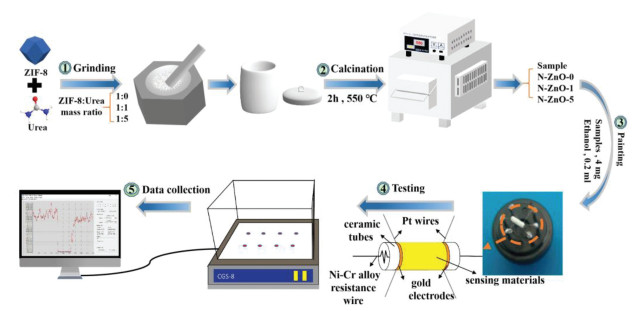
Figure 1.
Schematic illustration of the experimental procedure.
Enhanced ethanol sensing performance of N-doped ZnO derived from ZIF-8
Huifen Fu , Ziyue Feng , Shan-Shan Liu , Peng Wang , Chen Zhao , Chong-Chen Wang

The resistance-type gas sensor is considered to be an effective, portable and low-cost tool to realize the real-time detection of toxic or dangerous gas. ZnO as a n-type semiconductor is one of the most studied gas-sensing material due to its low-cost, nontoxic, good response, easy regulatability of structure, etc. [1]. It is reported that many strategies like morphology regulating, doping, noble metal modification, constructing heterojunctions and so forth can be used to regulate the structure of ZnO to improve its gas-sensing performance [2, 3]. Among the modification strategies, doping is considered as an effective method to optimize the electron structure of ZnO [4]. Nonmetal-doping has more obvious advantages like low-cost and environmentally friendly with respect to metal-doping [5]. The introduction of nonmetal into ZnO caused the lattice distortion, leading to the generation of more defects and enhanced gas-sensing performance [5]. It was reported that N-doping might reduce the band gap of ZnO [6], in which the electron can be more easily captured by molecular O2 to form superficial reactive oxygen species for boosted gas-sensing activity. However, the effect of N-doping on the gas-sensing performance was rarely reported [7].
Metal-organic frameworks (MOFs), constructed from metal and organic ligand, have received extensive attention in many fields like catalysis, adsorption, sensing, due to their diverse frameworks, abundant pore channels, tunable functional group and so on [8]. The weak conductivity limits the application of MOF in the resistance-type gas sensor. Adopting MOF as a self-sacrifice template to construct porous gas sensor has become a hotspot due to its unique structure [9]. ZIF-8, a typical zeolitic imidazolate framework, is one of the most reported Zn-based MOF because of its simple preparation method and unique structure. Ruan's group [10] prepared hollow ZnO nanocubes by annealing ZIF-8 at high temperature, and the obtained ZnO exhibited a high response, fast response and recovery rate, good selectivity and low detection limit toward formaldehyde. Zhang et al. [11] reported that Ag modified ZnO derived from ZIF-8 showed enhanced ethanol sensing properties. Li's group [12] synthesized indium doped ZnO porous hollow cages by an encapsulation-calcination strategy using ZIF-8 as a template, which presented remarkably enhanced NO2 sensing performance due to its specific structure. Although a lot of ZnO-based gas sensors derived from ZIF-8 have been fabricated, the N-doped ZnO for gas-sensing has not been reported up to now.
Urea and melamine were always used to prepare N-doped metal oxide. Our group [13] found that N can be introduced into the TiO2 lattice to form N-TiO2 by annealing the mixture of melamine and MIL-125, a classical Ti-based MOF. However, this strategy was always applied in photocatalysis, and not found to be reported in the field of gas sensor. Inspired by our previous work of N-TiO2, we are trying to prepare N-ZnO by annealing ZIF-8 with the assistant of urea that provide N source, and to explore the effect of the N doping on the gas-sensing performance of ZnO.
N-ZnO was prepared by high-temperature pyrolysis using ZIF-8 as self-sacrificial template with the assistant of urea, as shown in Fig. 1. Firstly, 0.3 g ZIF-8 and a certain amount of urea were well-mixed in an agate mortar, then transferred into a porcelain boat with a cover and put in a muffle furnace. After calcination at 550 ℃ for 2 h, N-ZnO-1 and N-ZnO-5 ('1' and '5' represent the mass ratio of urea to ZIF-8) were obtained. For comparison, N-ZnO-0 was prepared by direct annealing ZIF-8 without addition of urea.
It can be observed from Fig. S1a (Supporting information) that the XRD pattern of the as-prepared ZIF-8 matched well with the simulated one, proving the successful preparation of ZIF-8. The SEM and TEM observation showed that the obtained ZIF-8 exhibited irregular particle with the size of 100–400 nm (Figs. S1b and c in Supporting information). Fig. 2 presented that the N-ZnO-0, N-ZnO-1 and N-ZnO-5 had similar XRD patterns, all diffraction peaks can be well-indexed to ZnO, and no diffraction peak of any impurity was observed. These results revealed that ZIF-8 was thoroughly transformed into ZnO with high purity via pyrolysis, and no other impurities were formed, which was similar to the reported literatures [14, 15]. The diffraction peaks of the N-ZnO-0 were sharp and strong, while the peaks of the N-ZnO-1 and N-ZnO-5 were widened with weaker intensities. It could be attributed to that larger amount of N atoms were doped into the lattice of ZnO with the assistant of urea, decreasing its degree of crystallinity [16].
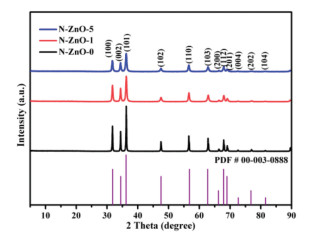
Because the atomic radius of the N atom is larger than that of the O atom, N-doping could induce the changes of the lattice parameters of the ZnO. Eq. 1 was employed to calculate the lattice parameters (a–c) of the N-ZnO-0, N-ZnO-1 and N-ZnO-5, in which d is the lattice spacing while h, k and l are the Miller indices of the diffraction plane. Besides, crystallite size (D) can be determined by Debye-Scherrer Eq. 2, and the lattice strain (ε) that represents the degree of the lattice distortion can be calculated by Eq. 3, in which the ks, λ, β and θ were the Scherrer constant, X-ray wavelength, full width at half maximum and diffraction angle, respectively. It is observed from Table 1 that the lattice parameters and lattice strain increased while crystallite size decreased with increasing the mass ratio of urea to ZIF-8, which could be related to the increased N-doping amount.
|
|
(1) |
|
|
(2) |
|
|
(3) |
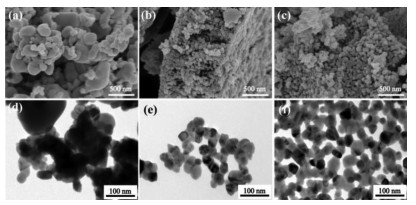
As shown in Fig. S 1 and Fig. 3, the morphology and size of N-ZnO-0 did not change obviously compared to the precursor ZIF-8, while the N-ZnO-1 and N-ZnO-5 exhibited uniform spherical particles with a smaller size of 40 nm. When the mixture of ZIF-8 and urea were heated, urea would be firstly decomposed to produce large amounts of NH3 and CO2 gas, and subsequently the ZIF-8 was disintegrated into small N-ZnO nanoparticles under the action of NH3 and air. Compared with N-ZnO-0, the smaller sizes of N-ZnO-1 and N-ZnO-5 may be caused from the impact force by the produced gas like CO2 and NH3 via urea pyrolysis at high temperature. It is generally considered that the smaller particles favor the increase of the specific surface area, exposing more active sites which are significant to the improving of gas-sensing performance. Therefore, it can be expected that the N-ZnO-1 and N-ZnO-5 would possess better gas response than the N-ZnO-0.
N2 adsorption-desorption isotherms and pore size distributions were conducted to determine the texture of the N-ZnO, as shown in Fig. S 2 (Supporting information). The hysteresis loops in the N2 adsorption-desorption isotherms suggested the presence of mesopores [17, 18], which facilitated the diffusion and adsorption of target gas as well as the improving of the gas-sensing performance. The specific surface areas (Sa) of the N-ZnO-0, N-ZnO-1 and N-ZnO-5 were 16.3, 26.1 and 33.2 m2/g, respectively, implying that the Sa increased with the increasing of the ratio of urea to ZIF-8.
Doping could change the electronic characteristic of ZnO and optimize the physical and chemical properties, further improving its gas-sensing performance [19-21]. It was reported that N doping led to the extended light absorption and reduced band gap [22-24]. To verify the successful doping of N into ZnO, UV-vis diffuse reflectance spectra (UV-Vis DRS) were recorded. The band gap (Eg) of the pure ZnO is reported as 3.37 eV, while the band gaps of the N-ZnO-0, N-ZnO-1 and N-ZnO-5 were calculated as 3.17, 3.04 and 2.99 eV (Figs. 4a and b), respectively. The narrowed band gap could be ascribed to the N-doping because the introducing of N atoms into ZnO would generate a new electron state located between the valance band and conduction band. From the discussion above, it can be reasonably speculated that the N-ZnO-5 had the largest N-doping content, followed by the N-ZnO-1 and N-ZnO-0, revealing that the N-doping amount increased with increasing the mass ratio of the urea to ZIF-8.
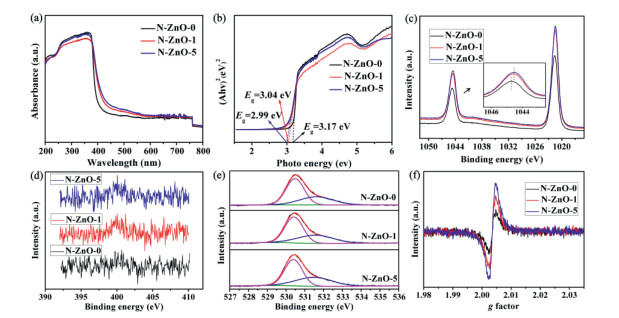
To further determine whether N atoms were doped into the lattice of ZnO and replace the lattice oxygen to form N-ZnO band, XPS spectra were performed. The extremely similar C 1s XPS spectra (Fig. S 3 in Supporting information) of the N-ZnO-0, N-ZnO-1 and N-ZnO-5 indicated that C3N4 could not be formed, which was also affirmed by the XRD, TEM and SEM results. It can be observed from Fig. 4c that the Zn 2p XPS spectra exhibited a typical bimodal due to the contribution of the Zn 2p1/2 and Zn 2p3/2. The standard Zn 2p1/2 XPS peak was centered at 1044.8 eV. In our case, the Zn 2p1/2 XPS peak was located at 1044.7, 1044.5 and 1044.5 eV for N-ZnO-0, N-ZnO-1 and N-ZnO-5, respectively, revealing that the N atoms could be introduced into the ZnO lattice. Considered that the electronegativity of N atom is smaller than the O atom, the replacement of lattice oxygen by N atoms resulted in the partial electron transition from N to Zn, leading to the increased electron density around Zn. Similar phenomenon was reported in other literatures. For example, Zhang's group [25] prepared N-doped ZnO by annealing ZIF-8, and found that the Zn 2p XPS peak shifted to a lower binding energy compared to the commercial ZnO. In addition, Yu reported that a shift to a lower binding energy of Co 2p XPS peak occurred in the N-doped Co3O4 compared to the pristine Co3O4 [26]. In addition, the peaks of Zn 2p for the N-ZnO-1 and N-ZnO-5 shifted slightly toward the lower binding energy compared to the N-ZnO-0, indicating that more N atoms were doped into the lattice of ZnO with the assistant of urea. N 1s XPS spectra (Fig. 4d) showed that the N-ZnO-0 had limited N content as the peak can not be obviously observed. There are obvious N 1s XPS peaks for the N-ZnO-1 and N-ZnO-5, indicating that the N atoms can be easily doped into ZnO with the assistant of urea.
Reactive oxygen species on the surface of ZnO is deemed to be crucial for the gas-sensing process. As shown in Fig. 4e, the O 1s XPS can be fitted into two peaks, and the peak located at 530.4 eV can be assigned to the lattice oxygen (OI) while the peak at 531.6 eV can be ascribed to the adsorbed oxygen (OII) [27, 28]. N-ZnO-5 has the largest OII amount, followed by the N-ZnO-1 and N-ZnO-0 (Table S 1 in Supporting information), which suggests that the N-ZnO-5 would have the best gas-sensing performance. Oxygen vacancy as an electron donor favors the generation of reactive oxygen species [29, 30], in which O2 molecules in air would capture the electron on the oxygen vacancy to form the adsorbed oxygen species like O2−, O2− and O−. Therefore, EPR was performed to determine the existence of oxygen vacancies in the N-ZnO. As shown in Fig. 4f, the EPR signal at g-factor value of 2.003 can be assigned to oxygen vacancy [31]. The amount of the oxygen vacancy increased as increasing the mass ratio of urea to ZIF-8. These results discussed above suggested that a large amount of oxygen vacancy was generated originated from the N-doping, which was beneficial to the generation of reactive oxygen species for the enhanced gas-sensing performance.
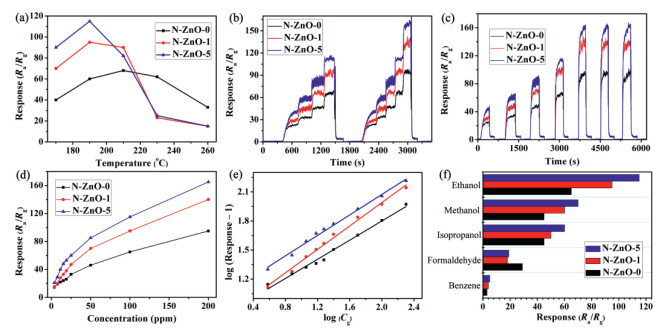
Ethanol was selected as the target gas to evaluate the gas-sensing performance of the N-ZnO-0, N-ZnO-1 and N-ZnO-5. The responses of the three samples toward 100 ppm ethanol at different operating temperature were measured and the results were exhibited in Fig. 5a. It can be observed that the responses for the three samples firstly increased and then decreased with increasing the operating temperature, and the optimal operating temperature was 210 ℃ for the N-ZnO-0 while 190 ℃ for the N-ZnO-1 and N-ZnO-5, revealing that the N-doping reduced the operating temperature. When the operating temperature was low, ethanol cannot be activated enough to react with reactive oxygen species, while the target gas was difficult to be adsorbed on the surface of the N-ZnO at high operating temperature, thus bringing about the lower response in either situation [32]. The responses of the N-ZnO-0, N-ZnO-1 and N-ZnO-5 were 60, 95 and 115, respectively, indicating that the gas-sensing performance was improved with increasing the N-doping content. Larger amount of N-doping would induce more oxygen vacancy and reactive oxygen species, resulting in the improved gas response. Additionally, the larger Sa as a result of the smaller particle size would also be responsible for the better gas-sensing performance of the N-ZnO-1 and N-ZnO-5. The as-prepared ZnO exhibited superior ethanol-sensing performance compared to other reported ethanol-sensing materials (Table S 2 in Supporting inforamtion) [11, 33-37].
Response and recovery time are important indicators to evaluate the gas-sensing materials. The response-recovery curves for the N-ZnO-0, N-ZnO-1 and N-ZnO-5 toward 100 ppm ethanol were measured, and the results were shown in Fig. S 4 (Supporting information). It can be seen that the response time was about 10, 6 and 4 s for the N-ZnO-0, N-ZnO-1 and N-ZnO-5, respectively. It is a pity that the resistance cannot reach the original value even after 20 min, which could be attributed to the strong affinity between the N-ZnO and the ethanol molecules. It was reported that increasing the working temperature favors the desorption of the target gas molecules from the surface of the gas-sensing materials [38]. As shown in Fig. S4, the resistance increased gradually and reached a constant value when the working temperature increased to 260 ℃. Then, the resistance decreased to the original value once the working temperature decreased to 190 ℃ (optimal operation temperature), indicating that the adsorbed ethanol molecules on the surface of N-ZnO were completely desorbed at 260 ℃.
Dynamic response curves (Fig. 5b) showed that the responses for these three samples increased with increasing the ethanol concentration, and all the three samples exhibited outstanding repeatability toward various ethanol concentrations. It can be also clearly seen from Fig. 5c that the response depended on the ethanol concentrations, and the similar response toward 200 ppm ethanol for the three cycles proved the good stability and repeatability. There was a significant positive correlation between the response and ethanol concentration (Fig. 5d) for all the N-ZnO. The responses increased rapidly when the ethanol concentration was lower than 25 ppm, then increased slowly when further raised the ethanol concentration. The ethanol molecules were firstly adsorbed on the surface of the N-ZnO, and subsequently reacted with the superficial oxygen species. Ethanol with low concentration can be easily adsorbed onto the surface of the N-ZnO until reached the adsorption saturation. When the concentration further increased, the ethanol molecules can not be completely adsorbed, leading to the slower growth of the response [39].
It is reported that the relationship between the response and gas concentration followed the empirical equation [40], as expressed by Eq. 4, in which the A is the prefactor, Cg is the concentration of target gas and B is the exponent on Cg. The value of B determines the type of reactive oxygen species, and it is reported that the B value of 0.5 represents that the superficial oxygen specie is O2−, while 1 represents O− [41]. The Eq. 4 can be rewritten as Eq. 5. As shown in Fig. 5e, the log(Response − 1) was liner with the logCg, and the slope B was 0.49, 0.60 and 0.53 for the N-ZnO-0, N-ZnO-1 and N-ZnO-5, respectively, indicating that the reactive oxygen specie for the three samples was O2−. Selectivity of the sensing material is an important factor especially in the actual application. Fig. 5f showed that the selectivity of the N-ZnO was satisfied.
|
|
(4) |
|
|
(5) |
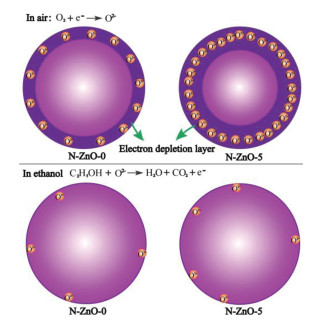
Oxygen molecules capture electrons from the conduction band to form the electron depletion layer near the surface of the N-ZnO (Fig. 6), meanwhile superficial reactive oxygen species like O2−, O− and O2− were generated, resulting in the increase of the resistance. In our case, O2− is the dominated reactive oxygen specie at the optimal operating temperature, as demonstrated by the calculated value of the slope B in Eq. 5. When ethanol was injected in, the ethanol molecules were firstly adsorbed on the surface of the N-ZnO, then reacted with the O2− and released free electrons, resulting in the decrease of the resistance. More N atoms doped into ZnO induced larger lattice distort and more oxygen vacancy that favors the adsorption, dissociation, ionization of the oxygen molecules to produce more reactive oxygen species, boosting the gas-sensing performance. N-ZnO-1 and N-ZnO-5 possessed a larger amount of oxygen vacancy compared to the N-ZnO-0, as demonstrated by EPR analysis, which provided more active sites for the adsorption of oxygen molecules to form more chemisorbed oxygen species, leading to the improved gas-sensing performance. Besides, the larger Sa originated from the smaller sizes of the N-ZnO-1 and N-ZnO-5 can also be responsible for the improving of the gas-sensing performance.
In conclusion, the N-doping amount was limited for the N-ZnO-0 obtained by direct annealing ZIF-8 alone, while the urea-assisted pyrolysis led to more N-doping for the N-ZnO-1 and N-ZnO-5. The introduction of more N atoms into ZnO gave rise to the larger lattice distortion and more oxygen vacancy, providing more active sites for the generation of chemisorbed oxygen species, resulting in the enhanced gas-sensing performance. We believe that the urea-assisted MOF pyrolysis is an effective method to realize the design and construction of high-performance gas sensor based on N-doped metal oxides.
The authors declare that they have no known competing financial interests or personal relationships that could have appeared to influence the work reported in this paper.
This work was supported by the National Natural Science Foundation of China (Nos. 21806008, 21876008), Science and Technology General Project of Beijing Municipal Education Commission, China (No. KM202110016010).
Supplementary material associated with this article can be found, in the online version, at doi:
Q.A. Drmosh, I.O. Alade, M. Qamar, S. Akbar, Chem. Asian J. 16 (2021) 1519–1538 doi: 10.1002/asia.202100303
S. Chaudhary, A. Umar, K.K. Bhasin, S. Baskoutas, Materials 11 (2018) 287 doi: 10.3390/ma11020287
V.S. Bhati, M. Hojamberdiev, M. Kumar, Energy Rep. 6 (2020) 46–62
A.M. Pineda-Reyes, M.R. Herrera-Rivera, H. Rojas-Chavez, et al., Sensors (Basel) 21 (2021) 4425 doi: 10.3390/s21134425
C.N. Wang, Y.L. Li, F.L. Gong, et al., Chem. Rec. 20 (2020) 1553–1567 doi: 10.1002/tcr.202000088
C. Zhang, M. Jia, Z. Xu, et al., Chem. Eng. J. 430 (2020) 132652
K. Ayeb, N. Mosussa, M.F. Nsib, S.G. Leonardi, G. Neri, Mater. Sci. Eng. B 263 (2021) 114870 doi: 10.1016/j.mseb.2020.114870
B.N. Bhadra, I. Ahmed, H.J. Lee, S.H. Jhung, Coord. Chem. Rev. 450 (2022) 214237 doi: 10.1016/j.ccr.2021.214237
G. Wang, S. Yang, L. Gao, et al., Coord. Chem. Rev. 445 (2021) 214086 doi: 10.1016/j.ccr.2021.214086
N. Zhang, L. Yan, Y. Lu, et al., Chin. Chem. Lett. 31 (2020) 2071–2076 doi: 10.1016/j.cclet.2019.12.014
J. Zhang, H. Lu, L. Zhang, et al., Sens. Actuators B Chem. 291 (2019) 458–469 doi: 10.1016/j.snb.2019.04.058
Z. Li, Y. Zhang, H. Zhang, Y. Jiang, J. Yi, ACS Appl. Mater. Interfaces 12 (2020) 37489–37498 doi: 10.1021/acsami.0c10420
C. Zhao, Z. Wang, X. Chen, et al., Chin. J. Catal. 41 (2020) 1186–1197 doi: 10.1016/S1872-2067(19)63516-3
R. Zhang, W. Song, M. Wang, H. Ji, CrystEngComm. 21 (2019) 6414–6422 doi: 10.1039/c9ce01184f
X. Zhang, W. Lan, J. Xu, et al., Sensor. Actuat. B Chem. 289 (2019) 144–152
Z. Wang, Z. Tian, D. Han, F. Gu, ACS Appl. Mater. Interfaces 8 (2016) 5466–5474 doi: 10.1021/acsami.6b00339
G. Huang, Z. Li, K. Liu, et al., Catal. Sci. Technol. 10 (2020) 4645–4654 doi: 10.1039/d0cy00019a
J. Ma, H. Fan, X. Zheng, et al., J. Hazard. Mater. 387 (2020) 122017 doi: 10.1016/j.jhazmat.2020.122017
C. Wang, X. Cui, J. Liu, et al., ACS Sens. 1 (2016) 131–136 doi: 10.1021/acssensors.5b00123
Z. Dong, Q. Hu, H. Liu, et al., Sens. Actuators B Chem. 357 (2022) 131227 doi: 10.1016/j.snb.2021.131227
P. Cheng, F. Dang, Y. Wang, et al., Sens. Actuators B Chem. 328 (2021) 129028 doi: 10.1016/j.snb.2020.129028
Y. Feng, H. Lu, X. Gu, et al., J. Phys. Chem. Solids. 102 (2017) 110–114 doi: 10.1016/j.jpcs.2016.11.022
J. Huang, L. Dou, J. Li, et al., J. Hazard. Mater. 403 (2021) 123857 doi: 10.1016/j.jhazmat.2020.123857
S.A. Ansari, M.M. Khan, M.O. Ansari, M.H. Cho, New J. Chem. 40 (2016) 3000–3009 doi: 10.1039/C5NJ03478G
J. Zhang, Y. Wang, S. Zheng, et al., ChemNanoMat. 5 (2018) 1800363
M. Yu, Z. Wang, C. Hou, et al., Adv. Mater. 29 (2017) 1602868 doi: 10.1002/adma.201602868
J. Liu, L. Zhang, J. Fan, B. Zhu, J. Yu, Sens. Actuators B Chem. 331 (2021) 129425 doi: 10.1016/j.snb.2020.129425
J. Huang, H. Liang, J. Ye, et al., Sens. Actuators B Chem. 346 (2021) 130568 doi: 10.1016/j.snb.2021.130568
L. Wang, S. Ma, J. Li, et al., Sens. Actuators B Chem. 347 (2021) 130642 doi: 10.1016/j.snb.2021.130642
C. Zhang, G. Liu, X. Geng, K. Wu, M. Debliquy, Sens. Actuators A Phys. 309 (2020) 112026 doi: 10.1016/j.sna.2020.112026
X. Wang, T. Wang, G. Si, et al., Sens. Actuators B Chem. 302 (2020) 127165 doi: 10.1016/j.snb.2019.127165
F. Gu, M. Di, D. Han, S. Hong, Z. Wang, ACS Sens. 5 (2020) 2611–2619 doi: 10.1021/acssensors.0c01074
X. Zhang, B. Liu, Y. Xu, et al., CrystEngComm. 21 (2019) 7528–7534 doi: 10.1039/c9ce01530b
X. Wu, S. Xiong, Y. Gong, et al., ChemistrySelect. 2 (2017) 10918–10925 doi: 10.1002/slct.201701752
R. Guo, H. Wang, R. Tian, et al., Ceram. Int. 46 (2020) 7065–7073 doi: 10.1016/j.ceramint.2019.11.198
S. Wang, Z. Gao, G. Song, et al., J. Mater. Chem. C 8 (2020) 9671–9677 doi: 10.1039/d0tc01425g
X. Zhang, W. Lan, J. Xu, et al., Sens. Actuators B Chem. 289 (2019) 144–152
S. Li, L. Xie, G. Luo, et al., Chin. Chem. Lett. 33 (2022) 551–556 doi: 10.1016/j.cclet.2021.06.016
R. Mo, D. Han, Z. Ren, et al., Chin. Chem. Lett. 32 (2021) 3619–3622 doi: 10.1016/j.cclet.2021.06.062
K. Xu, C. Lai, Y. Yang, et al., Sens. Actuators B Chem. 329 (2021) 129095 doi: 10.1016/j.snb.2020.129095
F. Gu, Y. Cui, D. Han, et al., Appl. Catal. B Environ. 256 (2019) 117809 doi: 10.1016/j.apcatb.2019.117809

Figure 3 (a–c) SEM and (d–f) TEM images of the (a, d) N-ZnO-0, (b, e) N-ZnO-1 and (c, f) N-ZnO-5.

Figure 4 (a) UV-vis DRS, (b) (αhυ)2 versus photo energy plots, (c) Zn 2p, (d) N 1s and (e) O 1s XPS spectra; (f) EPR spectra of the N-ZnO-0, N-ZnO-1 and N-ZnO-5.

Figure 5 (a) Responses of the N-ZnO to 100 ppm ethanol at different operating temperature. (b) Dynamic response curves. (c) Responses of the N-ZnO to various ethanol concentration. (d) Response versus concentration curves of the N-ZnO. (e) log(Response − 1) versus logCg curves. (f) Selectivity of the N-ZnO.

Figure 6 Schematic diagram of ethanol sensing process for the gas sensor based on N-ZnO.

 扫一扫看文章

扫一扫关注我们
 DownLoad:


 下载:
下载:
