Department of Physics, Nanchang University, Nanchang 330031, China
b.
Xiang Yang Public Inspection and Testing Center, Xiangyang 441000, China
c.
Institute for Advanced Study, Nanchang University, Nanchang 330031, China
d.
Key Laboratory of Poyang Lake Environment and Resource Utilization, Ministry of Education, School of Resources Environmental and Chemical Engineering, Nanchang University, Nanchang 330031, China
Received Date:
01 December 2021 Accepted Date:
06 April 2022 Revised Date:
18 February 2022 Available Online:
15 February 2023
Abstract:
Lithium-oxygen (Li-O2) batteries are considered as the next generation for energy storages systems due to the higher theoretical energy density than that of Li-ion batteries. However, the high charge overpotential caused by the insulated Li2O2 results in low energy efficiency, side reaction from electrolyte and cathode, and therefore poor battery performance. Designing noble metal-based catalysts can be an effective strategy to develop high-performance Li-O2 batteries with low charge overpotentials and outstanding cycle stability. However, the charge mechanism for noble metal-based catalysts is not clear and even contradictory. Herein, several charge mechanisms of Li2O2 are first discussed. Subsequently, the possible charge processes of Li-O2 batteries with noble metal-based catalysts are illustrated. In addition, the future development for noble metal-based catalysts is outlined.
Compared to Li-ion batteries, metal-air batteries show the higher energy densities [1-3], demonstrating great potential for energy storage systems [4-8]. Rechargeable lithium-oxygen (Li-O2) batteries have attracted wide attention due to high theoretical energy density (3500 Wh/kg) that originates from the reversible reaction of lithium peroxide [9-12]. Traditionally, Li-O2 cells are composed of the Li anode, separator and cathode catalyst [13-20]. According to different electrolytes, batteries can be divided into four categories: non-aqueous, aqueous, hybrid, all-solid-state electrolytes [18, 21-24]. A non-aqueous Li-O2 battery includes a lithium foil anode, a cathode electrode and the nonaqueous electrolytes, where the lithium salts are dissolved in nonaqueous electrolyte. For aprotic Li-O2 cells, Li is oxidized to Li+ during discharge process, while O2 is dissolved in the solvent to react with Li+ and generate Li2O2 [24-29]. For the charge process, the insulating Li2O2 is decomposed to generate Li+ and O2 [30-32]. However, the porous cathodes are seriously passivated by the insulating discharge products (Li2O2). To address the passivation issues, the Li-O2 batteries with aqueous the electrolytes are proposed [33]. Different from the non-aqueous Li-O2 batteries, the discharge product of aqueous Li-O2 batteries is LiOH, which can enhance the conductivities of discharge products, thereby promoting the electrochemical performances. To inhibit the direct contact between the lithium anode and the aqueous electrolytes, a hybrid non-aqueous/aqueous system is further proposed, which can improve the stability and durability of Li-O2 batteries [34]. Actually, the aforementioned non-aqueous, aqueous and hybrid electrolytes are based on the liquid solvents which can cause the safety issues and result in low energy densities. To improve the safety and energy densities, a variety of solid-state solvents containing polymers and inorganic solid electrolyte are utilized in Li-O2 batteries [35]. Though different kinds of Li-O2 batteries show huger potential than that of Li-ion batteries, the commercialization of Li-O2 cells is always impeded by various barriers including low energy efficiency, inferior cycle performances and unavoidable side reactions from electrolytes and cathodes [36-39]. Especially, the high charge overpotentials caused by the insulated Li2O2 can cause the degradation of solvents and electrodes, and therefore leading to poor performances [40-46]. To alleviate the high charge overpotentials, various catalysts such as carbon materials [46-52], transition metal oxides [53-61], perovskites [37, 62-65] and noble metals [66-69] are utilized to accelerate the oxidation of Li2O2. Among the cathode catalysts, due to half-filled antibonding states, noble metal-based catalysts are regarded as a promising catalysts for Li-O2 batteries, which can tune adsorption strength towards intermediates [70]. However, the charge mechanism of Li-O2 cells with noble metals has not been elucidated clearly. For instance, Byon et al. revealed that noble metal could simultaneously facilitate the oxidation of solvents and discharge products [30]. Therefore, the cycle performance cannot be obviously enhanced. In comparison, Kang et al. proposed that the anisotropic Pt would facilitate the generation and oxidation of Li2O2, delivering enhanced OER catalytic activities compared to commercial Pt/C catalysts [71]. Therefore, a comprehensive understanding of the oxidation mechanism is essential to rationally design efficient noble metal catalysts for promoting the oxidation of discharge products at low charge overpotentials.
Herein, we summarize the recent progress of charge mechanisms for noble metal-based Li-O2 cells. We begin the review by highlighting the different charge mechanisms of Li2O2. Subsequently, the charge processes of various noble metals are discussed. Finally, we conclude the current charge mechanisms of high-performance Li-O2 batteries and the future direction for constructing reasonable noble metal catalysts.
2.
Charge mechanism for Li2O2
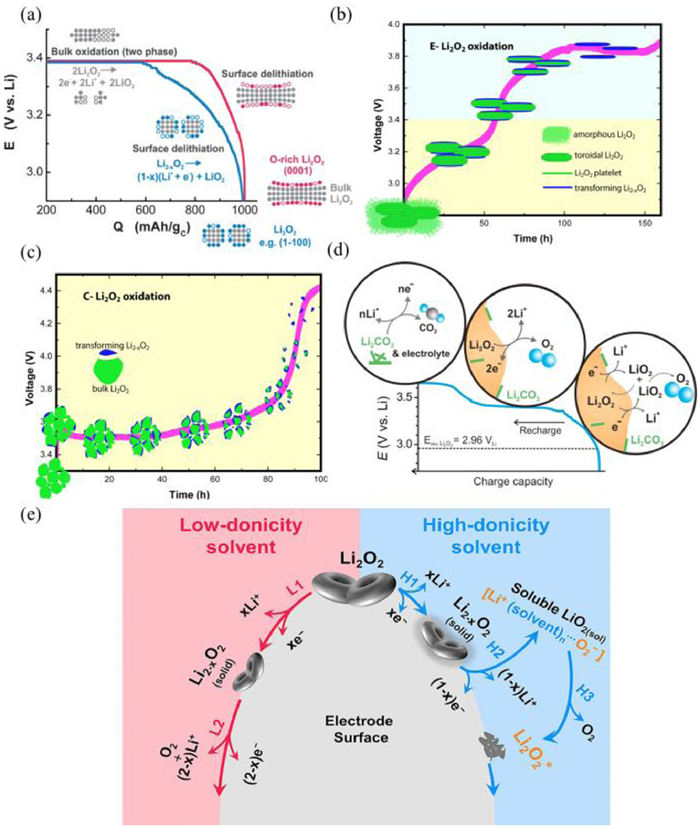
Several charge mechanisms are proposed for Li-O2 batteries, including one electron oxidation and two-electron oxidation. Bruce et al. showed that the oxidation of Li2O2 is conducted via a two-electron oxidation process since no O2− or LiO2 can be detected via the surface enhanced Raman spectroscopy (SERS) [72]. In contrast, Yang et al. [73] believed that the oxidation process of Li2O2 may contain several steps (Fig. 1a). In the sloping region with low charge overpotential, the oxidation with the formation of Li-deficient products (Li2-xO2) is attributed to both the one-electron solid-solution-like delithiation and the continuous removal of particles or discs in different surface regions. The two-phase oxidation process of bulk Li2O2 can be identified at high voltage plateau (E = 3.4 V). Yang et al. [73] showed that the lithium superoxide (LiO2) can be generated at low charge overpotentials due to one-electron oxidation of Li2O2, followed by disproportionation reactions of LiO2, while oxidation of bulk Li2O2via two-electron process appears at high charge voltages (Fig. 1b). Furthermore, similar results can also be achieved by Marnix et al. [74]. They demonstrated that the non-crystalline peroxide is first charged during initial charge stage, then the crystalline peroxide is charged at high charge voltage to generate Li-deficient solid solution phase (Li2-xO2) via one-electron oxidation (Figs. 1c and d) [75]. The existence of LiO2 is confirmed by Lu et al. [76]. They claimed that the soluble LiO2 could be generated during oxidation process of Li2O2 in high donor number solvents, while LiO2 is absent and Li2-xO2 can be formed in low-donicity solvent (Fig. 1e). The existence of LiO2 is further confirmed by the thin-film rotating ring-disk electrode (RRDE) and X-ray absorption near-edge spectrum.
Figure 1
Figure 1.
(a) The charge processes for Li2O2 with disk or particle morphologies. Reproduced with permission [73]. Copyright 2013, Royal Society of Chemistry. The charge processes of (b) E-Li2O2 and (c) C-Li2O2. Reproduced with permission [74]. Copyright 2014, American Chemical Society. (d) The proposed charge mechanisms of Li-O2 batteries. Reproduced with permission [75]. Copyright 2013, Elsevier. (e) Proposed solvent-controlled Li2O2 decomposition mechanism. Reproduced with permission [76]. Copyright 2018, Elsevier.
In addition, the different morphologies of Li2O2 also reflects distinctive mechanisms. For the toroid-shape discharge products, electron transportation from toroidal Li2O2 to current collectors is difficult due to the poor electronic conductivity [77]. At a low charge potential, lithium-deficient product (Li2-xO2) is formed, followed by the oxidation process of Li2-xO2 at a relatively plat voltage area. With the continuous charge process, oxidation of byproducts and solvents occurs at high charge overpotentials according to the previous reports [73, 78]. In contrast, for the Li2O2 thin films, the electron transport can be realized by the electron tunneling through the film (with thickness of 5–10 nm) [79]. Additionally, the Li2O2 thin films are amorphous compared to crystalline Li2O2 with toroid shapes [23, 80-82]. Peng et al. [80] also stated that the amorphous Li2O2 shows two to three orders of magnitude higher in ionic and electronic conductivity than that of commercial Li2O2, leading to a low charge overpotential. Therefore, the charge overpotential of amorphous Li2O2 thin films is low due to enhanced electronic conductivities compared to that of toroidal Li2O2. Another reason for the low charge overpotential of Li2O2 films is ascribed to the increased contact interfaces between Li2O2 films and cathodes [29, 83]. Though the Li2O2 thin film can be decomposed at a low voltage, the disadvantages of Li2O2 thin film including low discharge capacity and seriously parasitic reactions should be considered. In the future, efficient catalysts should be designed to balance the capacity and charge overpotentials [39, 41, 84].
3.
OER mechanisms for noble metal-based cathodes
3.1
OER for noble metals
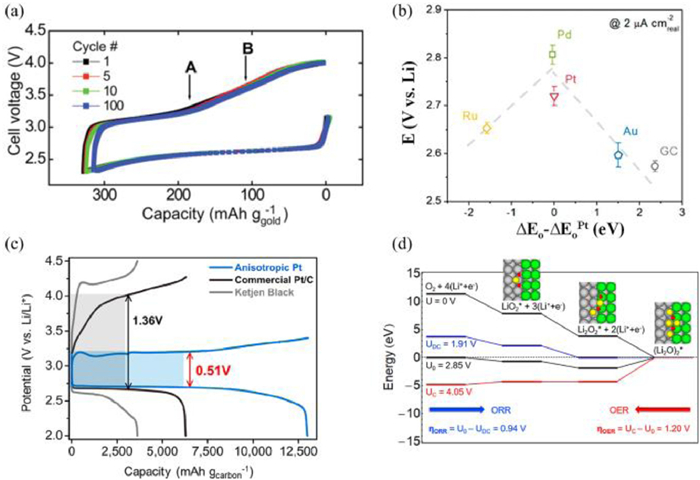
Noble metals have attracted increasing attention since they can provide the ideal adsorption sites and strength for Li2O2 [71, 85-92]. The gold cathode by Peng et al. [87] displayed the reversible generation and oxidation of Li2O2 for 100 cycles, which inspires the development of noble metal-based cathodes in Li-O2 cells (Fig. 2a). Yang et al. [93] showed that the ORR activity of Pd, Au, Pt and Ru established a volcano-shaped regulation, which is in consistent with the trend in fuel cell batteries (Fig. 2b). Among all the noble metals, Ru demonstrates superior catalytic activity for OER performances. Zhou et al. [94] stated that Ru@MWCNTP-based catalysts exhibit a lower charge overpotential of 0.68 V than that of MWCNTP cathode (1.04 V); Jeong et al. [95] investigated the catalytic effect of Ru, Pd and Au on the reduced graphene oxide during charge process. They claimed that the Ru-reduced oxide graphene (Ru-rGO) composite displays low charge overpotential compared to the other noble metal since the Ru nanoparticles can induce Li2O2 thin films.
Figure 2
Figure 2.
(a) The cycle performance of NPG cathodes. Reproduced with permission [87]. Copyright 2012, American Association for the Advancement of Science. (b) Nonaqueous Li+-ORR potentials as a function of calculated oxygen adsorption energy, ΔEO, relative to that of Pt. Reproduced with permission [93]. Copyright 2011, American Chemical Society. (c) Discharge-charge curves for anisotropic Pt, Pt/C and KB carbon cathodes. (d) ORR and OER energy curves calculated on the Pt (411) planes. Reproduced with permission [71]. Copyright 2018, American Chemical Society.
The surface structure of noble metals will have an effect on the charge overpotentials. Kang et al. [71] stated that the anisotropic Pt catalyst with high-index (411) facets show superior OER performances with low overpotential (0.51 V) at 0.2 A/g (Fig. 2c). According to the calculation results (Fig. 2d), the principal reason is the higher activity of the high-index facets than that of the low-index facets. Meanwhile, Su et al. [96] showed that Au nanocrystals with high-index facets displayed higher excellent OER activities than the Au with low-index facets. They believed that the excellent activity performance of high-index facets is due to the high surface energy, which can enhance the interaction between O and Li atoms, thereby facilitating the decomposition of Li2O2.
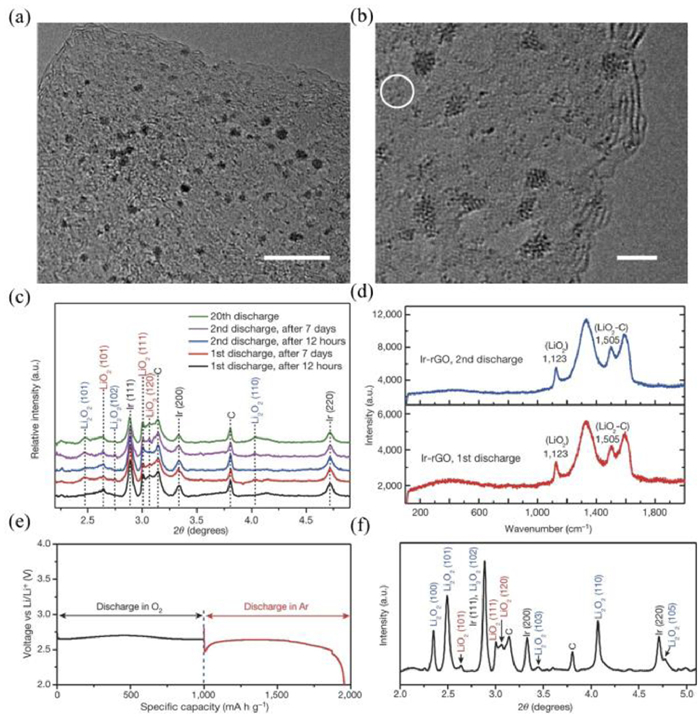
Due to the intrinsic affinity towards LiO2, noble metals can inhibit the formation of Li2O2, leading to the generation of LiO2 as the main discharge products. For example, Lu et al. [86] designed a suitable noble metal-based cathode that contains Ir and reduced oxide graphene (rGO) for Li-O2 batteries (Figs. 3a and b). LiO2 is detected as the main discharge products by the XRD patterns and Raman spectra (Figs. 3c and d). Another evidence for the formation of LiO2 is the discharge curves of LiO2 under Ar atmosphere. After LiO2 was discharged at 1000 mAh/g (the red curves in Fig. 3e), the crystalline LiO2 can be formed. This result suggested that LiO2 can be formed by a one-electron process with a capacity of 1000 mAh/g (Fig. 3f). They believed the lattice matching degree between LiO2 and Ir3Li determined the generation of LiO2. Since the disproportionation reaction rate of Li2O2 is determined by the two factors: (1) the desorption rate of O2 from the LiO2 surface; (2) the solvent effect, the electrolytes can prevent LiO2 from disproportionation and bring good stability of crystalline LiO2. This research work provides new directions for designing defective discharge products to inhibit side reactions by lattices matching between catalysts and discharge products.
Figure 3
Figure 3.
(a, b) TEM images of Ir-rGO catalysts. The circle in (b) shows some small Ir atomic clusters. Scale bars: (a) 10 nm, (b) 2 nm. (c) HE-XRD patterns of discharge product on Ir-rGO as a function of aging time. (d) Raman spectra of discharge products on Ir-rGO cathodes. (e) Voltage curves for Ir-rGO discharged first in O2 and then in Ar at a capacity of 1000 mAh/g. (f) HE-XRD pattern of cathode resulting from both discharges in (e). Reproduced with permission [86]. Copyright 2016, Nature Publishing Group.
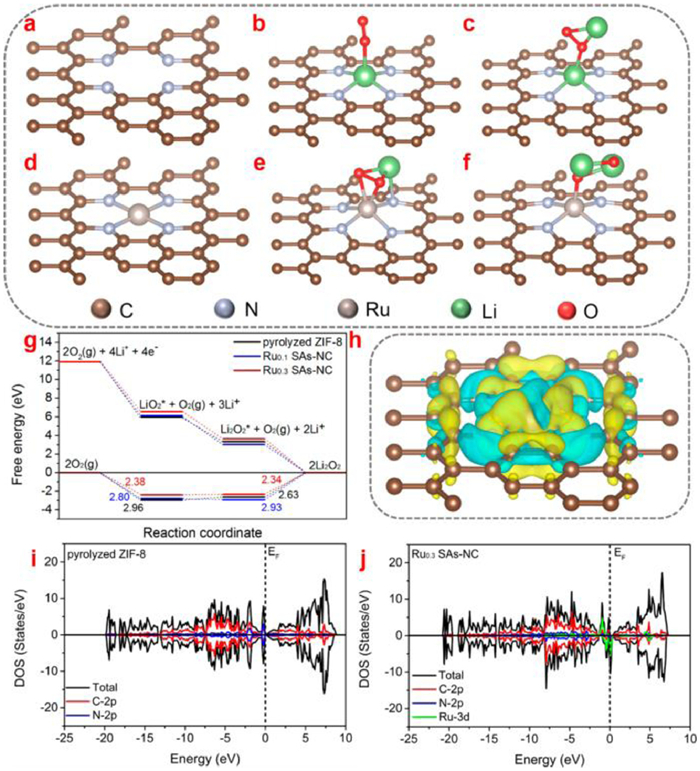
Apart from the noble metal cluster, the noble-metal single-atom catalysts (NMSACs) with well-defined structures can enhance the catalytic activities by increasing the active sites. Recently, Hu et al. [69] developed Ru single-atom onto nitrogen-doped porous carbon (Ru0.1 SAs-NC and Ru0.3 SAs-NC) as cathode catalysts for Li-O2 batteries. Compared to the ZIF-8, Ru0.3 SAs-NC demonstrates a low adsorption strength towards LiO2 and Li2O2 (Figs. 4a-f). Furthermore, the Gibbs free energy profiles demonstrates that the rate determining step for ORR and OER processes are the reduction of O2 to form Li2O2 clusters and the oxidation of Li2O2 clusters to generate O2, respectively. Due to the weak binding interaction towards LiO2, Ru0.3 SAs-NC delivers a low discharge polarization (2.34 V in Fig. 4g). The charge density difference further confirms an abundant electron transfer for the Ru0.3 SAs-NC (Fig. 4h). Meanwhile, compared to the pyrolyzed ZIF-8, the density of state (DOS) suggested that Ru mainly contributed to DOS below the Fermi level of the Ru0.3SAs-NC (Figs. 4i and j), indicating the superior catalytic activities.
Figure 4
Figure 4.
The pristine (a) pyrolyzed ZIF-8 and (d) Ru0.3 SAs-NC structures. The optimized structures of (b) LiO2 adsorbed on pyrolyzed ZIF-8, (e) LiO2 adsorbed on Ru-N4 configuration of Ru0.3 SAs-NC, and (c) Li2O2 adsorbed on pyrolyzed ZIF-8, (f) Li2O2 adsorbed on Ru-N4 configuration of Ru0.3 SAs-NC. (g) Gibbs free energy diagrams at 2.97 V for the discharge-charge reactions on the active surface of pyrolyzed ZIF-8, Ru0.1 SAs-NC and Ru0.3 SAs-NC. (h) Corresponding charge density distribution. Isosurface level = 0.002 a.u. The total density of states (DOS) and partial density of states (PDOS) of (i) pyrolyzed ZIF-8 and (j) Ru0.1 SAs-NC. Reproduced with permission [69]. Copyright 2020, American Chemical Society.
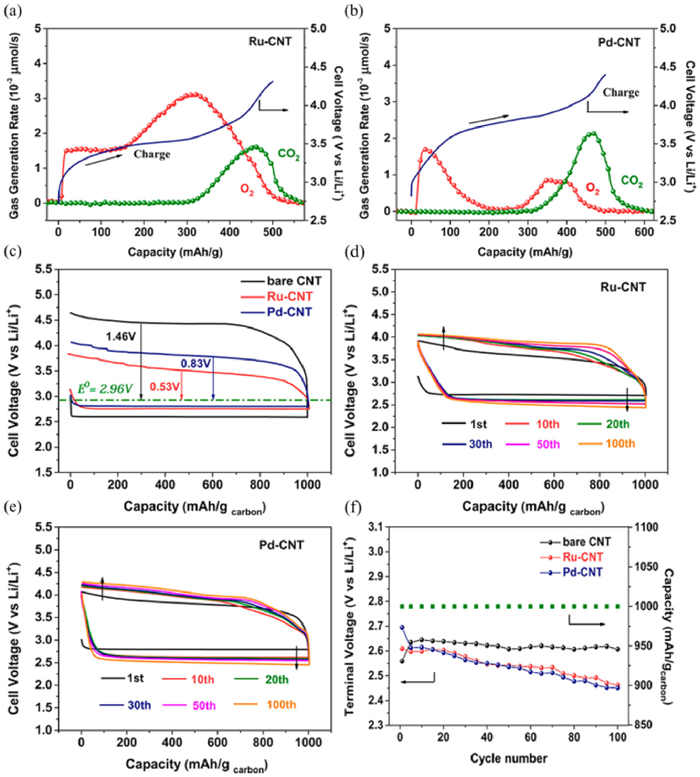
As discussed in detail above, though the noble metal can decrease the charge polarizations and enhance the energy efficiency in Li-O2 batteries, using noble catalysts also increases the risk of side reactions from cathodes and electrolytes. For instance, Pt and Pd based catalysts can accelerate the decomposition of solvent by the differential electrochemical mass spectrometry (DEMS) results [95, 97]. Peng et al. [85] showed that the continuous CO2 evolution can be identified at the later charge process for Ru-carbon nanotube (Ru-CNT) and Pd-CNT catalysts by the DEMS characterizations (Figs. 5a and b). Though Ru-CNT and Pd-CNT catalysts can improve OER overpotentials and high round-trip efficiency (Figs. 5c and d), the reversibility is impaired by the parasitic reactions. Therefore, there is no improvement for the rechargeability by using Ru-CNT and Pd-CNT cathodes (Figs. 5e and f). Similar results was observed by Byon et al. [30]. By using Pt, Ru, Pd and Au as cathode catalysts for Li-O2 cells, they found that the oxidation process of Li2O2 is accompanied by more side reaction. These results suggest that using noble metal-based catalysts in fact damage the reversible formation and decomposition of Li2O2.
Figure 5
Figure 5.
DEMS results for (a) Ru-CNT and (b) Pd-CNT catalysts during the charge process. (c) The first cycle of the pristine CNT, Ru-CNT and Pd-CNT cathodes. 100 cycles of Li-O2 cells with (d) Ru-CNT and (e) Pd-CNT catalysts. (f) The terminal discharge voltage as a function of cycle number at a fixed capacity of 1000 mAh/g. Reproduced with permission [85]. Copyright 2015, American Chemical Society.
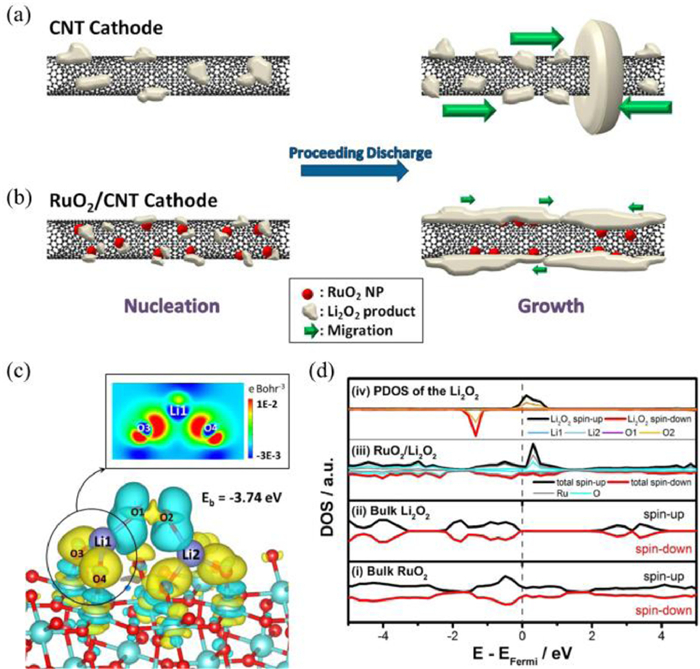
Among all the noble metal oxides, RuO2 represents excellent OER catalytic performances due to its metallic character with high electronic conductivity (104 S/cm for single crystal) [98, 99]. Zhou et al. [100] prepared the RuO2 hollow spheres with diameters of 200–300 nm as the catalyst for cathode electrodes. The RuO2 hollow spheres showed a charge overpotential of only 0.54 V even up to 100 cycles. Impressively, Zhou et al. [88] also designed a core shell-structured CNT@RuO2 hybrid as the cathode. The Li-O2 batteries with CNT@RuO2 cathodes showed a low charge overpotential of 0.51 V. Unfortunately, the specific role of RuO2 during the OER process should be further elucidated. Byon et al. suggested that the RuO2 was beneficial to the generation of amorphous Li2O2 on the CNTs, and the large contact area between CNTs and Li2O2 can promote the OER kinetics (Figs. 6a and b) [101]. According to first-principle calculations, Kim et al. [102] proposed that insulated Li2O2 can interact with RuO2 through a Stranski-Krastanov growth mode and transform into conductive Li2O2, which leads to a low charge overpotential. RuO2 demonstrates strong adsorption strength towards Li2O2 (−3.74 eV), leading to the formation of RuO2/Li2O2 heterostructure. After depositing Li2O2 on the surface of RuO2, obvious charge transfer as well as remarkable lattice mismatch between Li2O2 and RuO2 can be observed (Fig. 6c), which makes the insulative Li2O2 conductive according to the density of state results (Fig. 6d). Recently, the charge mechanism of RuO2 was further investigated by Chen's group [103] via an aberration-corrected scanning transmission electron microscope with a high angle annular dark field detector (HAADF-STEM) and synchronous electrochemical measurements. During the charge process, the catalytic sites are located at solvent-RuO2-Li2O2 triple-phase interfaces. RuO2 can accelerate both the oxidation process of surfaced discharge products and the decomposition of soluble LiO2 to dissolve the insulated discharge product of Li2O2via a chemical disproportionation reaction. This mechanism provides new insights into OER reactions of noble metal-based catalysts.
Figure 6
Figure 6.
The diagram of the discharge processes in (a) CNT and (b) RuO2/CNT cathodes. Reproduced with permission [101]. Copyright 2013, American Chemical Society. (c) Charge density difference at the RuO2 (110) slab. (d) Density of states (DOS) of (ⅰ) bulk RuO2, (ⅱ) bulk Li2O2, (ⅲ) total DOS of RuO2/Li2O2, (ⅳ) projected DOS (PDOS) of Ru, O and the adsorbed Li2O2. Reproduced with permission [102]. Copyright 2017, American Chemical Society.
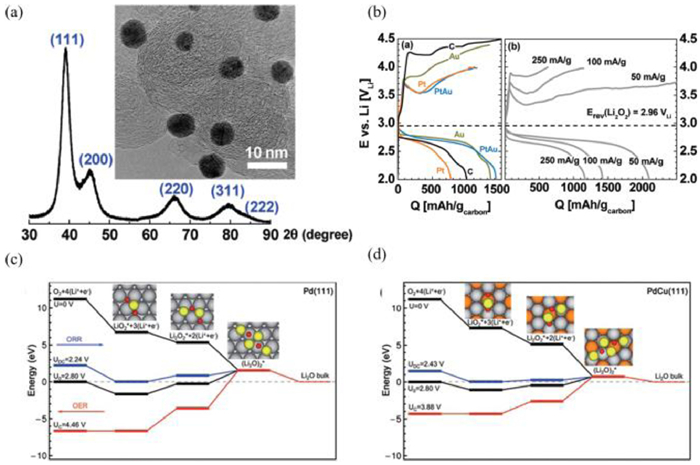
Alloying noble metal with the other metal is a feasible tactic to enhance the catalytic performance for Li-O2 batteries. Considering Pt-based alloy, Shao Horn et al. [104] developed PtAu nanoparticles as the catalyst for Li-O2 cells, resulting in a low overall potential (0.85 V) at 0.05 A/g (Figs. 7a and b). In addition, the PdCu nanoparticles fabricated by Kang et al. [90] demonstrate a high energy efficiency of 80% at 0.2 A/g. The DFT calculations showed that the electron transfer from Cu to Pd can decrease adsorption strength towards LiO2, leading to a low OER overpotential (Figs. 7c and d). Similarly, Kim et al. [91] confirmed that the adsorption strength towards LiO2 is related to the charge overpotential of Pt3Co catalysts. In particular, the decreased adsorption between LiO2 and Pt3Co alloy caused a low charge overpotential of 0.56 V at 0.2 A/g.
Figure 7
Figure 7.
(a) TEM image of PtAu/C. (b) The first discharge/charge curves of Au/C, Pt/C, and PtAu/C for Li-O2 batteries. Reproduced with permission [104]. Copyright 2010, American Chemical Society. Calculated energy diagrams for ORR and OER on (c) Pd(111) and (d) PdCu(111). Reproduced with permission [90]. Copyright 2014, Royal Society of Chemistry.
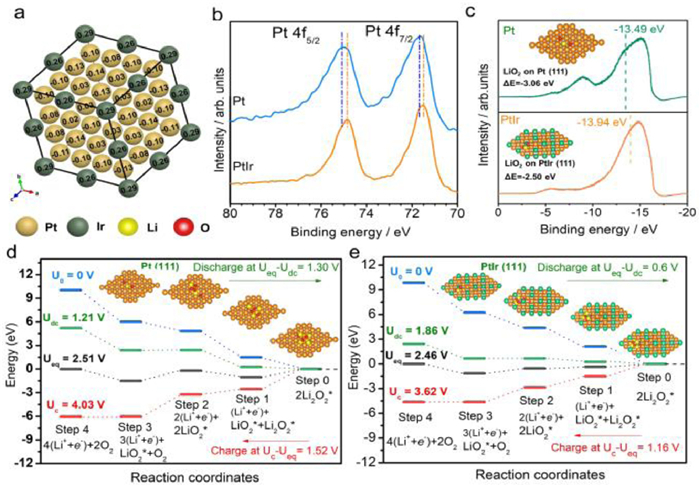
Similar results were also reported by Guo et al. [105], where the PtIr alloys are rationally designed as the efficient catalysts for Li-O2 batteries. Pt atom with high electronegativity tends to capture electron from Ir atoms, leading to lower Lewis acidity of Pt atoms and thereby causing the downshift of d-band center (Figs. 8a-c). which results in the weaker adsorption strength towards LiO2 (−2.50 eV) compared to pure Pt (Fig. 8c). The weak binding interaction between LiO2 and PtIr alloys bring about the outstanding discharge (0.60 V) and charge (1.16 V) catalytic activities (Figs. 8d and e). The Gibbs free energy profiles show that the rate determining steps for discharge and charge processes are the formation of 2LiO2 molecules and the oxidation of LiO2 to release O2, respectively.
Figure 8
Figure 8.
(a) The Bader charge simulation for PtIr multipods. (b) The XPS spectra of Pt and PtIr catalysts in Pt 4f region. (c) The valence band spectra (VBS) of Pt and PtIr by UPS. The positions of the d-band centers were implied by short dashed lines. The insets are the adsorption energy of LiO2 on the (111) planes of Pt and PtIr catalysts, respectively. (d, e) The Gibbs free energy at zero, equilibrium, discharge and charge voltages for Pt and PtIr cathodes. Asterisks denote the species absorbed on the surface of cathode catalysts. The insets in (d) and (e) are the optimized structures of the Pt and PtIr cathodes with adsorbates at corresponding charging steps. Reproduced with permission [105]. Copyright 2021, Wiley-VCH.
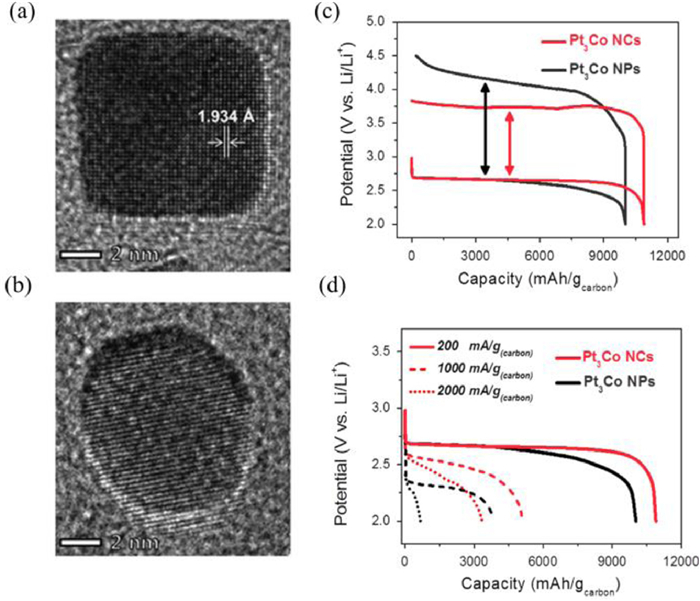
Another tactic to enhance the electrochemical performances of noble metals is tuning the shape of noble metal-based alloys, which can provide abundant exposed ledges and atomic steps. Kang et al. [106] fabricated Pt3Co nanocubes (NCs) surrounded by (100) planes and 12 edged surfaces (Figs. 9a and b). Compared to Pt3Co nanoparticles, Pt3Co nanocubes delivered a high energy efficiency and excellent rate performances (Figs. 9c and d). The enhanced performance of Pt3Co nanocubes was ascribed to the electronic structure, atomic arrangement and the cubic morphologies.
Figure 9
Figure 9.
TEM images of (a) Pt3Co nanocubes and (b) nanoparticles. (c) The initial discharge-charge profiles between 2.0 V and 4.5 V at a current density of 200 mA/gcarbon. (d) The discharge profiles obtained at various current densities. Reproduced with permission [106]. Copyright 2015, Wiley VCH.
3.4
OER for noble metals and transition-metal oxides hybrids
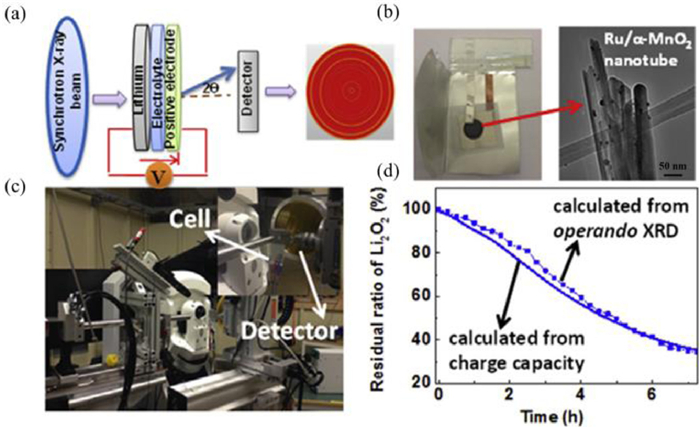
Noble metals and transition-metal oxides hybrids are effective catalysts, which can promote the formation and oxidation of discharge products. Among them, Ru or RuO2 based hybrid catalysts demonstrates excellent ORR and OER performances. Zhou et al. [107] utilized Ru/MnO2 as the cathode for Li-O2 batteries with water as the protic additives in aprotic electrolytes. During the discharge process, LiOH and H2O2 were generated by the reaction between Li2O2 and H2O. During the charge process, H2O2 can convert into H2O and O2 due to the catalytic effect of MnO2 while LiOH can be oxidized by Ru noble metals, leading to low charge overpotentials (0.21 V). As a result, Li-O2 batteries with Ru/MnO2 cathodes showed outstanding OER and rate performances. Meanwhile, the catalytic role of Ru/MNT was investigated by Zhu et al. with the help of operando synchrotron radiation powder X-ray diffraction (SR-PXD in Figs. 10a-c) [108]. The oxidation of Li2O2 on the Ru/MNT cathodes follows a pseudo-zero-order kinetics, therefore, the Ru/MNT cathode delivers a coulombic efficiency of 100% (Fig. 10d).
Figure 10
Figure 10.
(a-c) The structure of operando synchrotron radiation powder X-ray diffraction (SR-PXD). The left image in (b) is the SR-PXD sample holder with sample and the right one in (b) is the TEM image of that sample on the sample holder. (d) The profile of Li2O2 oxidation calculated from the charge capacity and SR-PXD, respectively. Reproduced with permission [108]. Copyright 2017, Elsevier.
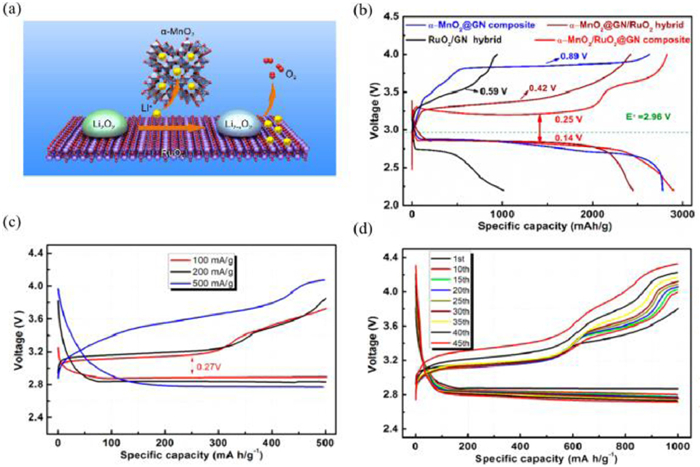
Additionally, Dong et al. [92] developed α-MnO2/RuO2 as the catalyst for Li-O2 batteries. The synergistic catalytic mechanism between α-MnO2 and RuO2 was proposed. During the charge process, more LiO2 can be generated on the α-MnO2/RuO2 cathodes compared to that of pure RuO2 electrodes. In detail, Li ions and Li2−xO2 can be stabilized by α-MnO2 and RuO2, respectively. Subsequently, the Li2−xO2 could be easily decomposed by RuO2 (Fig. 11a). Therefore, the Li-O2 batteries with α-MnO2/RuO2@CN cathodes show good rate performances and excellent cycle performances (45 cycles) with a low charge overpotential (0.25 V). The synergistic charge mechanism provides a novel strategy to obtain high-performance Li-O2 batteries (Figs. 11b-d).
Figure 11
Figure 11.
(a) The schematic illustration for the Li extraction from Li2O2 and migration on α-MnO2/RuO2 cathode. (b) The comparison of the discharge-charge curves between the α-MnO2@GN RuO2/GN, α-MnO2@GN/RuO2 and MRG electrode. (c) Discharge-charge profiles of MRG cathode at various current densities. (d) Voltage profiles of selected cycles at 100 mA/g for the MRG cathode. Reproduced with permission [92]. Copyright 2018, American Chemical Society.
In this review, we mainly discuss the recent progress of the charge mechanisms for the noble metal-based catalysts in Li-O2 batteries. The noble metal-based cathodes contain noble metals, noble metal oxides, noble metal-based alloy, and noble-transition metal oxides hybrids. The oxidation of discharge products can be a one-electron or two-electron process, which is determined by the solvents and catalysts. For the noble metal cathodes, the charge overpotential can be decreased by the high-index facets or the formation of other types of discharge products, which can enhance the electrochemical performances. In comparison, it is suggested that the noble metals could also lead to the degradation of solvents, bringing negligible improvement for the cycle performances. For the noble metal oxides in Li-O2 batteries, during the charge process, the oxidation of Li2O2 can be promoted by the interaction between Li2O2 and catalysts by constructing the solvent-catalyst-Li2O2 triple-phase interfaces. For the catalytic activity of noble metal-based alloy, the electron properties and the shape of alloys can affect the decomposition process of Li2O2. In the last section, the OER mechanisms of noble-transition metal oxides hybrids were elucidated. OER is a complicated process, which contains multistep electrochemical reactions. The OER process can be influenced by many parameters such as high-index facets, shapes, and the composition of noble metals. Though remarkable progress has been made for the charge mechanisms in Li-O2 batteries, substantial efforts should be devoted for a fundamental understanding of Li2O2 decomposition. The process of Li2O2 oxidation on the O2 cathode during the charge process is always under debate. Therefore, the in situ characterizations should be established to provide direct evidence for the analysis of OER process.
Developing efficient noble metal cathodes with superior stability and high energy efficiency is the ultimate goal for high-performance Li-O2 batteries. To obtain low OER overpotentials and excellent cycle performances, two strategies can be proposed: (1) maximizing noble metal atomic utilization by construing the noble metal single-atom catalysts, (2) decreasing the OER overpotentials by the strain engineering. Due to the high cost and low abundance of noble metals, decreasing the content of noble metals while maintaining high OER catalytic is urgent. Therefore, constructing the noble metal single-atom catalysts can show the maximum atom-utilization efficiency, leading to excellent OER performance [69]. In addition, the local environment, coordination number and spatial configuration of noble metal single atom can be modulated to further tune the electronic structure and determine the OER catalytic performance [109]. On the other hand, the OER activity of noble metals can be tuned by the strain effect, which includes the compressive and tensile strain. The strain can be generated by forming the core-shell structure, shape variation, alloys, grain boundaries, etc. [110]. Generally, tuning the lattice strain has already been confirmed to be effective in the electrocatalyst design. Usually, introducing a compressive strain can cause the downshift of d-band center for the noble metal with fixed d orbital occupancy. Therefore, the antibonding d states will move to a low energy level, which increases electron occupation and enhances adsorption strength towards intermediates [111]. In comparison, the tensile strain of noble metals induces the upshift of d-band center, enhancing the binding interaction between intermediates and catalysts. Therefore, the rate determining step during the ORR and OER process can be tuned by the strain engineering for the noble metal catalysts. With continuous efforts, the Li-O2 batteries with high energy densities will show great commercial potential in the future.
Declaration of competing interest
The authors declare that they have no known competing financial interests or personal relationships that could have appeared to influence the work reported in this paper.
Acknowledgments
The authors acknowledge the financial support from the National Natural Science Foundation of China (No. 12175098) and Hundred Talents Sailing Project of Jiangxi Province, China.
Z. Lei, W. Cai, Y. Rao, Nat. Commun. 13 (2022) 1–10.
[110]
X. Yang, Y. Wang, X. Tong, N. Yang, Adv. Energy Mater. 12 (2022) 2102261. doi: 10.1002/aenm.202102261
[111]
Z. Xia, S. Guo, Chem. Soc. Rev. 48 (2019) 3265–3278. doi: 10.1039/c8cs00846a
Figure 1
(a) The charge processes for Li2O2 with disk or particle morphologies. Reproduced with permission [73]. Copyright 2013, Royal Society of Chemistry. The charge processes of (b) E-Li2O2 and (c) C-Li2O2. Reproduced with permission [74]. Copyright 2014, American Chemical Society. (d) The proposed charge mechanisms of Li-O2 batteries. Reproduced with permission [75]. Copyright 2013, Elsevier. (e) Proposed solvent-controlled Li2O2 decomposition mechanism. Reproduced with permission [76]. Copyright 2018, Elsevier.
Figure 2
(a) The cycle performance of NPG cathodes. Reproduced with permission [87]. Copyright 2012, American Association for the Advancement of Science. (b) Nonaqueous Li+-ORR potentials as a function of calculated oxygen adsorption energy, ΔEO, relative to that of Pt. Reproduced with permission [93]. Copyright 2011, American Chemical Society. (c) Discharge-charge curves for anisotropic Pt, Pt/C and KB carbon cathodes. (d) ORR and OER energy curves calculated on the Pt (411) planes. Reproduced with permission [71]. Copyright 2018, American Chemical Society.
Figure 3
(a, b) TEM images of Ir-rGO catalysts. The circle in (b) shows some small Ir atomic clusters. Scale bars: (a) 10 nm, (b) 2 nm. (c) HE-XRD patterns of discharge product on Ir-rGO as a function of aging time. (d) Raman spectra of discharge products on Ir-rGO cathodes. (e) Voltage curves for Ir-rGO discharged first in O2 and then in Ar at a capacity of 1000 mAh/g. (f) HE-XRD pattern of cathode resulting from both discharges in (e). Reproduced with permission [86]. Copyright 2016, Nature Publishing Group.
Figure 4
The pristine (a) pyrolyzed ZIF-8 and (d) Ru0.3 SAs-NC structures. The optimized structures of (b) LiO2 adsorbed on pyrolyzed ZIF-8, (e) LiO2 adsorbed on Ru-N4 configuration of Ru0.3 SAs-NC, and (c) Li2O2 adsorbed on pyrolyzed ZIF-8, (f) Li2O2 adsorbed on Ru-N4 configuration of Ru0.3 SAs-NC. (g) Gibbs free energy diagrams at 2.97 V for the discharge-charge reactions on the active surface of pyrolyzed ZIF-8, Ru0.1 SAs-NC and Ru0.3 SAs-NC. (h) Corresponding charge density distribution. Isosurface level = 0.002 a.u. The total density of states (DOS) and partial density of states (PDOS) of (i) pyrolyzed ZIF-8 and (j) Ru0.1 SAs-NC. Reproduced with permission [69]. Copyright 2020, American Chemical Society.
Figure 5
DEMS results for (a) Ru-CNT and (b) Pd-CNT catalysts during the charge process. (c) The first cycle of the pristine CNT, Ru-CNT and Pd-CNT cathodes. 100 cycles of Li-O2 cells with (d) Ru-CNT and (e) Pd-CNT catalysts. (f) The terminal discharge voltage as a function of cycle number at a fixed capacity of 1000 mAh/g. Reproduced with permission [85]. Copyright 2015, American Chemical Society.
Figure 6
The diagram of the discharge processes in (a) CNT and (b) RuO2/CNT cathodes. Reproduced with permission [101]. Copyright 2013, American Chemical Society. (c) Charge density difference at the RuO2 (110) slab. (d) Density of states (DOS) of (ⅰ) bulk RuO2, (ⅱ) bulk Li2O2, (ⅲ) total DOS of RuO2/Li2O2, (ⅳ) projected DOS (PDOS) of Ru, O and the adsorbed Li2O2. Reproduced with permission [102]. Copyright 2017, American Chemical Society.
Figure 7
(a) TEM image of PtAu/C. (b) The first discharge/charge curves of Au/C, Pt/C, and PtAu/C for Li-O2 batteries. Reproduced with permission [104]. Copyright 2010, American Chemical Society. Calculated energy diagrams for ORR and OER on (c) Pd(111) and (d) PdCu(111). Reproduced with permission [90]. Copyright 2014, Royal Society of Chemistry.
Figure 8
(a) The Bader charge simulation for PtIr multipods. (b) The XPS spectra of Pt and PtIr catalysts in Pt 4f region. (c) The valence band spectra (VBS) of Pt and PtIr by UPS. The positions of the d-band centers were implied by short dashed lines. The insets are the adsorption energy of LiO2 on the (111) planes of Pt and PtIr catalysts, respectively. (d, e) The Gibbs free energy at zero, equilibrium, discharge and charge voltages for Pt and PtIr cathodes. Asterisks denote the species absorbed on the surface of cathode catalysts. The insets in (d) and (e) are the optimized structures of the Pt and PtIr cathodes with adsorbates at corresponding charging steps. Reproduced with permission [105]. Copyright 2021, Wiley-VCH.
Figure 9
TEM images of (a) Pt3Co nanocubes and (b) nanoparticles. (c) The initial discharge-charge profiles between 2.0 V and 4.5 V at a current density of 200 mA/gcarbon. (d) The discharge profiles obtained at various current densities. Reproduced with permission [106]. Copyright 2015, Wiley VCH.
Figure 10
(a-c) The structure of operando synchrotron radiation powder X-ray diffraction (SR-PXD). The left image in (b) is the SR-PXD sample holder with sample and the right one in (b) is the TEM image of that sample on the sample holder. (d) The profile of Li2O2 oxidation calculated from the charge capacity and SR-PXD, respectively. Reproduced with permission [108]. Copyright 2017, Elsevier.
Figure 11
(a) The schematic illustration for the Li extraction from Li2O2 and migration on α-MnO2/RuO2 cathode. (b) The comparison of the discharge-charge curves between the α-MnO2@GN RuO2/GN, α-MnO2@GN/RuO2 and MRG electrode. (c) Discharge-charge profiles of MRG cathode at various current densities. (d) Voltage profiles of selected cycles at 100 mA/g for the MRG cathode. Reproduced with permission [92]. Copyright 2018, American Chemical Society.

 DownLoad:

 下载:
下载:


