Figure 1.
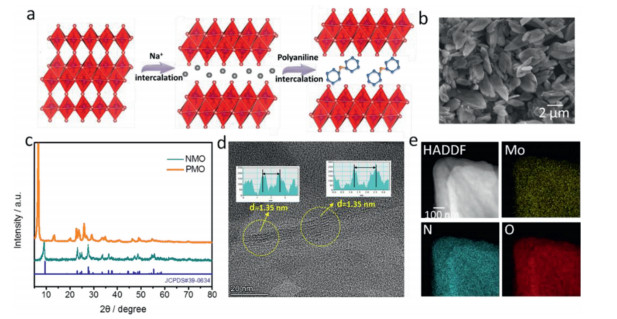
(a) Schematic illustration of the preparation process of PMO. (b) The typical SEM image of PMO. (c) XRD patterns and (d) HRTEM images of PMO and NMO. (e) Elemental mapping analysis of PMO.
Tuning the layer structure of molybdenum trioxide towards high-performance aqueous zinc-ion batteries
Yu Tan , Jinjun He , Bo Wang , Cheng Chao Li , Taihong Wang

Lithium ion batteries (LIBs) have played a dominate role in the market of portable electronics devices since their first utilization because of the high energy density and long lifespan [1-3]. With the widespread use of LIBs, hesitations such as safety, economic cost and environmental impact have arisen [4, 5]. At this point, aqueous rechargeable batteries are promising candidates result from their greater ionic conductivity, higher safety and environmentally friendly [6, 7]. In particularly, aqueous Zn ion batteries (ZIBs) with Zn anode gained ever-increasing attention due to high capacity (820 mAh/g), low redox potential (−0.76 V versus SHE) and high abundance on the earth [8-10]. In order to maximize the excellent features of Zn anode, people have been working hard to develop various progressive cathodes. To date, plentiful materials including Zn0.25V2O5·nH2O [11], Na2V6O16·1.63H2O [12], Ca0.25V2O5·nH2O [13], VS2 [14], MnO2 [15], ZnMn2O4 [16], ZnHCF [17] and Co3O4 [18] have been applied for high performance cathodes of ZIBs. For example, zinc hexacyanoferrates cathode delivered a capacity of 65.4 mAh/g at 0.06 A/g with stability capacity retention of 76% after 100 cycles [17]. Chen's group reported cation-deficient spinel ZnMn2O4 cathode, which possess 150 mAh/g at 0.05 A/g [16]. Nevertheless, the capacity of most reported cathodes are still unsatisfactory. In this regard, developing new materials as cathodes for ZIBs is extremely desirable by yet challenging.
As a nontoxic metal oxide, orthorhombic MoO3 with variable valence and layered structure has been widely investigated as cathode for LIBs and sodium ion batteries [19, 20]. Specifically, its internal layered structure subsists along the [010] direction, which is formed by [MoO6] octahedrons sharing angles in the [001] and [100] directions, allowing guest atom ions (Li+, Na+, etc.) to intercalate/deintercalate between the layers [21-23]. Considering the similar ionic radius of Li+ and Zn2+ (rLi = 0.74 Å, rZn = 0.76 Å), MoO3 can be expected to be a promising host of Zn2+ in ZIBs [24, 25]. Very recently, our group reported MoO3 cathode in ZIBs with 3.79 mAh/cm2 at 0.4 A/g in 2 mol/L ZnCl2 electrolyte [26]. However, it suffers from severe capacity loss (27.1% capacity retention after 400 cycles). One of possible solution to the inherent shortcomings of MoO3 may be guest pre-intercalation strategy, which has been proposed in various manganese/vanadium-based composites and receives impressing achievements [27, 28]. It has been studied that water/metal ion pre-intercalation strategy can effectively improve the stability of layered structure cathode, but the electrochemical stability of host materials still suffer from structural degradation. Specifically, because the layer structure could be destroyed when guest metal species are located between layers due to the strong electrostatics' interactions between inserted cations and oxygen atoms of MoO3 [29-31]. Additionally, the large volume and molecular weight of metal ions may cause unstable change during insertion/extraction of Zn2+ [32].
Herein, for the first time we demonstrated intercalation engineering to enhance Zn2+ storage ability of MoO3 by intercalating organic molecules into MoO3 (polyaniline (PANI) intercalated MoO3 (denoted as PMO). The interlayer spacing of PMO was prominently increased which results in an improved cation mobility from electrolyte to the internal crystal lattice. Importantly, a compassion of the electrochemical behavior between PMO and metal ion intercalated MoO3 ([Na(H2O)0.25]MoO3 (denoted as NMO)) revealed the intercalation of PANI facilitated the charge storage and reinforced the layered structure of MoO3, leading to a high capacity and good cycling stability. As a result, an aqueous ZIBs based on PMO cathode delivered a high capacity of 157 mAh/g at the current density of 0.5 A/g as well as a promoted stability (capacity retention of 63.4% after 1000 cycles), obviously better than the ever reported MoO3 based ZIBs cathodes.
Synthesis of NMO: Typically, commercial MoO3 (0.9 g) was dispersed in deionized water (62 mL), and stirred at room temperature for 0.5 h while blowing with nitrogen. Then, sodium dithionite (Na2S2O4, 0.5 g) and sodium molybdate dehydrate (Na2MoO4·2H2O, 15 g) were added to above suspension, and stirred at room temperature for 3 h. Afterwards, the blue-purple products were collected by centrifugation, washed with deionized water, and dried under vacuum at 60 ℃.
Synthesis of PMO: Typically, aniline (1825 µL) was dropped into HCl (1 mol/L, 20 mL) under ice bath conditions, then NMO (0.69 g) was added and stirred for 24 h while blowing with nitrogen. Afterwards, the aniline-NMO products were collected by centrifugation, washed with deionized water, and dried under vacuum at 60 ℃. In order to polymerize aniline, aniline-NMO (0.4 g) was ultrasonically dispersed in deionized water (15 mL). Meanwhile, ammonium persulfate ((NH4)2S2O8, 3 g) was dissolved in deionized water (15 mL), and added to above solution and stirred. Finally, the PANI-NMO was collected by centrifugation, washed with deionized water, and dried under vacuum at 60 ℃.
The X-ray diffraction patterns of the as-synthesized samples were recorded by a Rigaku MiniFlex600 X-ray diffractometer (XRD) with Cu-Kα radiation. The morphologies and structures of the samples were characterized by a field-emission gun scanning electron microscope (SEM, Hitach-SU8010) and a transmission electron microscopy (TEM, FEL-Talos F200S). X-ray photoelectron spectroscopy (XPS, Thermo Fisher-Escalab 250Xi) measurements were performed to study the chemical natures of the as-synthesized samples. The Raman measurement was operated through a confocal Raman spectrometer (LabRAM HR800, Horiba Jobin Yvon) with a 532 nm laser wavenumber. Infrared spectroscopy of samples were characterized by an FT-IR spectrometer (Nicolet iS5, Thermo Scientific). Thermogravimetric analysis (TGA) was performed using a Netzsch STA 449C thermal analyzer with a temperature range of 25–800 ℃ at a heating rate of 10 ℃/min. Contact angle measurements were performed on the OCA 100 (Dataphysics) contact angle meter.
The electrode was prepared by mixing PMO, Super-P, and polyvinylidene fluoride with a mass ratio of 7:2:1 in N-methylpyrrolidine. The slurry was then casted on the stainless steel grids and dried at 80 ℃ overnight. The effective mass loading of PMO is about 1.0 mg/cm2. Zn plate and Glass fiber filter paper are used as the counter/reference electrode and separator, respectively. The electrolyte is 2 mol/L ZnCl2 aqueous solution. Galvanostatic charge/discharge tests were performed using a NEWARE battery system at a voltage window of 0.2–1.3 V (vs. Zn2+/Zn). The cyclic voltammetry (CV) and electrochemical impedance spectroscopy (EIS) at an open circuit voltage in the frequency range of 0.01–100 kHz were carried out using a Gamry electrochemical workstation. The GITT was measured with a current pulse of 0.1 A/g for 10 min followed by 1 h of relaxation time to achieve equilibrium potential.
MoO3 layer with PANI intercalation and pure MoO3 layer were constructed respectively, and 4 × 2 × 1 supercells were taken for calculation. The projector augmented-wave (PAW) method were performed in the DFT calculations [33]. The Perdew-Burke-Ernzerhof within the generalized gradient approximation was adopted to examine the electronic exchange-correlation function of the interacting electrons [34]. The van der Waals interaction was considered by using the empirical correction in Grimme's scheme, i.e., DFT+D3 [35], in all calculations. The energy cutoff is 400 eV for all cases, and 2 × 3 × 1 k-meshes were used to sample the Brillouin zone for geometry optimization. The convergence tolerance for the residual force on each atom during structure relaxation was set to 0.05 eV/Å and for energy difference between two consecutive self-consistent calculations is less than 10−4 eV, respectively.
As shown in Fig. 1a, the PANI intercalated MoO3 was synthesized via a two-step method. MoO3 layer was firstly swelled by chemical reduction and formed hydrated sodium molybdenum bronze as a result [36]. The interlayer alkali metal cations are important in promoting the dispersion of the oxide layers during the intercalation process, since the extent of the layer exfoliation depends on the alkali-metal cations originally present in the bronze [37]. Then the PMO was prepared via an ion-change process by reacting NMO with aniline in the present of oxidizing agent. The morphology of as-prepared NMO and PMO was characterized by scanning electron microscope (SEM), as presented in Fig. S1 (Supporting information) and Fig. 1b. The NMO shows a stacked morphology that comprises aggregates of nanosheets. The PMO shows similar morphology with its precursor, indicating the incorporation of PMO does not destroy the nanosheet structure and there is no large bulk of PANI deposit on the MoO3. The X-ray diffraction (XRD) and transmission electron microscope (TEM) were further operated to explore the crystal structure of PANI-intercalated MoO3. As shown in Fig. 1c, the XRD pattern of NMO sample can be well assigned to [Na(H2O)0.25]MoO3 (JCPDS No. 39–0634) with a interlayer spacing of 0.98 nm. After PANI intercalation, the interlayer spacing of MoO3 was remarkably enlarged to 1.36 nm which may due to the intercalated PANI into MoO3 interlayer in helical chain configuration or with the benzene rings lying roughly perpendicular to the layers, similar to the case of the poly(pphenylenevinylene) MoO3 composite. The interlayer spacing (1.35 nm) of PMO was further confirmed by HRTEM (Fig. 1d), which was in great agreement with XRD results. The element mapping images of as-prepared PMO were shown in Fig. 1e, which demonstrated the even distribution of C, N, O, Mo elements and the completely substitution of PANI to Na+ as the intercalation.
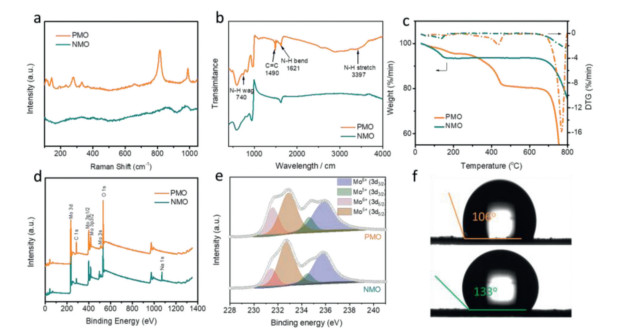
The Raman spectras of NMO and PMO are shown in Fig. 2a. It can be observed both samples show specifically Mo=O vibration at about 970 cm−1 [38]. The Mo-O-Mo vibration can be located at 860 and 814 cm−1 for NMO and PMO, respectively, which may be attributed to the difference of intercalated ions in MoO3 interlayer. Moreover, the PMO shows sharp and high-intensity Raman peaks, which is mainly due to the good crystalline character. Fourier transform infrared spectroscopy (FT-IR) was used to ensure the existence of PANI, which is shown in Fig. 2b. The band at 740 cm−1 is corresponded to N—H wag [39]. The band at 1490 and 1621 cm−1 can be assigned to C=C bond and N—H bend, respectively [40]. The broad band at 3397 cm−1 is related to N—H stretch [41]. In addition, other characteristic absorption bands in the range of 400–800 cm−1 are assigned to Mo-O stretching vibrations of MoO6 octahedra [42]. The weight percentage of intercalated PANI (~5 wt%) was determined by the thermo gravimetric (TG) analysis (Fig. 2c). Compared to NMO, the PMO shows three kinds of weight loss. The first weight loss (~14%) below 200 ℃ is attributed to the loss of adsorbed water, the second weight loss (~5%) between 200 ℃ and 500 ℃ was due to the loss of PANI, and the last weight loss above 680 ℃ was belong to the loss of MoO3. The X-ray photoelectron spectroscopy (XPS) results of NMO and PMO are presented in Fig. 2d. Only C, N, O and Mo elements can be identified on the surface of PMO, implying the successful ion exchange between PANI and Na+ in the interlayer of MoO3. The Na 1s XPS spectrum also confirms that the absence of Na+ in PANI intercalated MoO3 (Fig. 2d). The Mo 3d XPS spectrum of NMO and PMO can be deconvolute into two peaks at 232 and 235 eV (Fig. 2e), which can respectively be assigned to Mo5+ (Mo 3d3/2) and Mo6+ (Mo 3d5/2), suggesting the intercalation of guest ion partially reduce the MoO3 [43]. In addition, the binding energy of Mo 3d characteristic peaks of PMO sample show slight increase compared to that of NMO sample, as a result of strong electron withdrawing ability of N element in the intercalated PANI. The decreased water contact angle (Fig. 2f) from NMO (133°) to PMO (106°) reveal the enhanced hydrophilia after the PANI intercalation, which can be beneficial for reducing the electrode/electrolyte resistance and facilitate the ion transition during the energy storage process [44].
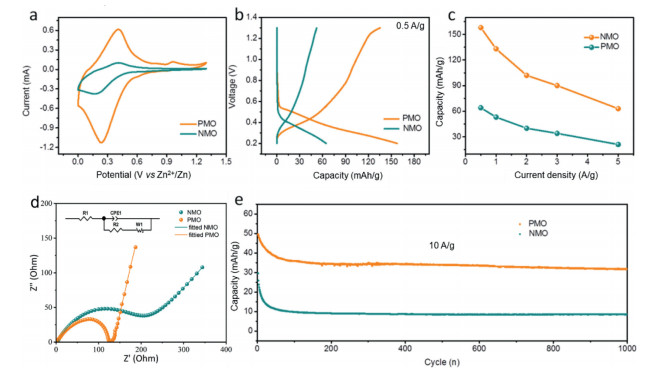
To evaluate the function of Na+/PANI intercalation on electrochemical performance of MoO3, the device (named as PMO//Zn battery) was assembled using 2 mol/L ZnCl2 as electrolyte. The PMO and Zn plate was used as cathode and anode, respectively. Both electrodes show cathodic peaks at 0.24 V vs. Zn2+/Zn which are associated with the reduction of Mo6+ to Mo4+ accompanied with Zn2+ intercalation. The anodic peaks at 0.41 V vs. Zn2+/Zn are due to the oxidation of Mo4+ to Mo6+ coupled with the Zn2+ de-intercalation (Fig. 3a). Notably, the PMO cathode shows much larger CV curve in sharp contrast with NMO, indicating a more vibrant Zn2+ intercalation/deintercalation kinetics. The galvanostatic charge-discharge (GCD) profiles (Fig. 3b) of NMO and PMO are in great agreement with CV results. The PMO cathode possess a high capacity (157 mAh/g at 0.5 A/g), which is almost three times larger than that of NMO cathode (64 mAh/g at 0.5 A/g). The obvious plateaus in GCD curves of both samples (Fig. S2 in Supporting information) at different current densities further confirm the occurred redox reaction during the energy storage process. Besides from high capacity, the PMO cathode also exhibited good rate performance, which is shown in Fig. 3c. As the current density increased from 0.5 A/g to 5 A/g, the PMO electrode can still maintain 63 mAh/g (41% capacity retention) while NMO electrode only possess 20 mAh/g (31% capacity retention). Electrochemical impedance spectroscopy (EIS) was further operated to probe the optimal charge storage ability of PMO. Fig. 3d presents the fitting ESI of NMO and PMO electrodes at open circuit potential (OCP). The Rct of PMO electrode is obvious smaller than that of NMO electrode, suggesting that the charge transportation of MoO3 is effectively promoted by PANI intercalation [45]. The cycling stability test was operated at high current density of 10 A/g (Fig. 3e). After 1000 continuous cycles, the PMO electrode shows a 63.4% capacity retention, much higher to that of NMO electrode (28.8% capacity retention). In addition, we compared the electrochemical performance of Zn-ion batteries based on MoO3 materials. As shown in the Table S1 (Supporting information), the PMO exhibited moderate capacity and good long-cycling performance.
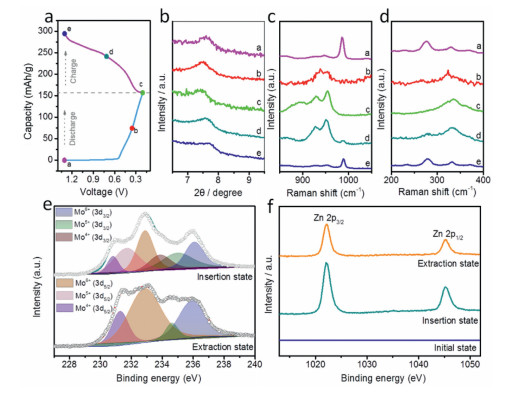
The morphology and structural evolution of PMO during the (de)intercalation of Zn2+ was subsequently investigated by XRD, Raman, SEM and XPS studies at different charge/discharge voltage (Fig. 4a). Fig. 4b shows the ex-situ XRD patterns collected from the second charge/discharge cycle. Compared to the pristine PMO, the (020) peak of PMO after first cycle shifts to a higher degree (7.7°), which may due to the de-intercalation of partial PANI at the first cycle of charge. As the discharge proceeds, the (020) peak shifts to lower degree, indicating the expanded interlayer spacing of PMO is caused by the Zn2+ intercalation along the b-axis. After fully discharged, the interlayer spacing increased to 1.2 nm (corresponding to 7.4°). The charge process shows an opposite phenomenon. The interlayer spacing shrunk gradually and decreased to 1.1 nm (corresponding to 7.7°) at the fully charged state because of the release of Zn2+. It is worth mention that the interlayer spacing evolved regularly during the Zn2+ intercalation/deintercalation, suggesting the great reversibility of PMO electrode. Further evidence for Zn ion intercalation into the interlayer of PMO cathode was examined by Raman spectra (Figs. 4c and d). The νas(Mo=O) stretching vibrations and δ(O=Mo=O) wagging (985 and 278 cm−1) vanish and new bands appears at 930–950 cm−1, which can be attributed to Mo-O terminal bonds caused by the slight deformation of MoO6 octahedra at fully discharged state. Nevertheless, the Raman spectrums recover to the original state at the fully charged state. These results further confirm the high reversibility of PMO. To monitor the evolution of morphology during Zn2+ intercalation/deintercalation, ex-situ SEM was operated at different voltages in the second discharge/charge cycle (Fig. S3 in Supporting information). The PANI intercalated MoO3 cathode shows stacked morphology at the initial state (1.3 V). As the discharge proceeds, the nanowire morphology is presented and becomes the most widespread at the fully discharged state (0.2 V). Contrarily, the nanowires gradually aggregate to form bundles and come back to its original morphology at fully charged state (1.3 V). XPS measurement was further conducted to prove Zn2+ uptake and examine the change of oxidation states (Figs. 4e and f). At the insertion state (0.2 V), the two new signals at binding energy of 233.8 and 235 eV are detected, respectively, indicating a deep discharge in which the Mo6+ is partially reduced to Mo5+ and Mo4+ [46]. The Mo4+ completely disappears at the extraction state (1.3 V), manifesting the Mo4+ transforms into its high valence accompanied with Zn2+ de-intercalation from the host. However, a small amount of Mo5+ can still be observed, which is due to the residue of partial Zn2+ in the electrode. It can be further confirmed by the Zn 2p spectra, in which two peaks are still present when charged to 1.3 V but reduce in intensity.
To thoroughly understand the enhanced electrochemical performance of PMO, CV and GITT were further carried out to investigate the reaction kinetics. Fig. 5a and Fig. S4 (Supporting information) show the CV curves of NMO and PMO at different scan rates. As the scan rate increases, the CV curves of both cathodes mainly hold similar shapes, the oxidation/reduction peaks shift to higher and lower voltages, respectively. Then, the diffusion-controlled and capacitive contributions are quantitatively separated by using sweep voltammetry. The relationship between the peak current (i) and sweep rate (v) can be presented by the following equation: i = av [47]. In general, b value ranges from 0.5 to 1, representing a mixed contribution of both capacitive effect and diffusion process [48]. The fitted b values for NMO and PMO electrodes are shown in Figs. 5b and c. These results indicate that the Zn2+ storage process of the PMO electrode is mainly controlled by the mixed mechanisms of capacitive behavior and diffusion process, while that of NMO electrodes is dominated by diffusion behavior. Furthermore, the overall capacity can be divided into the contribution of capacitive response and diffusion process according to the following equation: i = k1v + k2v1/2 [49]. At 0.2 mV/s, the capacitive contribution of NMO and PMO is 11.5% and 27.2%, respectively. And the capacitive contribution of both electrodes grows up with the increasing of sweep rate. It is worth mention that PMO electrodes possesses the higher ratio of capacitive contribution at all the time than that of the NMO, resulting in the PMO delivers a higher capacity at 10 A/g (Fig. 3e). GITT measurement was used to further investigate the Zn2+ diffusion in the lattice of PMO (Fig. S5 in Supporting information). The Zn2+ diffusivity (DGITT) can be calculated as described below: 
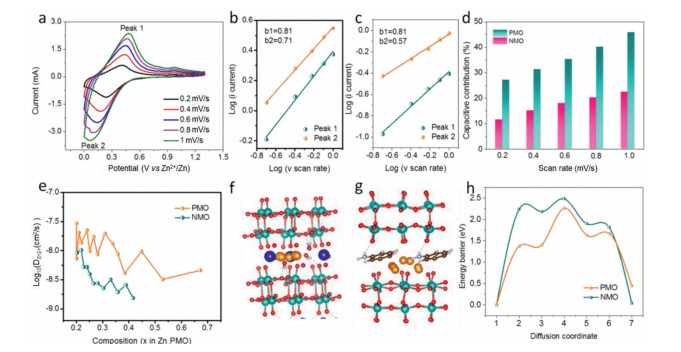
To acquire a fundamental understanding of intercalation effects on rate and cycle performance of MoO3, DFT calculations were further performed to compare the diffusion behavior of Zn2+ in the NMO and PMO. Based on the available sites to incorporate Zn2+, the Zn2+ diffusion pathways of NMO and PMO are identified, as shown in Figs. 5f and g. Starting from the most stable interlayer site, Zn2+ can diffuse either in the c-direction or the a-direction to reach one of the interlayer sites. The corresponding energy barriers for Zn2+ diffusion along these pathways are 2.48 and 2.26 eV for NMO and PMO, respectively (Fig. 5h). Because the diffusion energy barrier describes the minimum energy that must be available for the Zn2+ diffusion in the MoO3 layers, the values of the energy barriers determines the difficulty of the Zn2+ transmission. As a consequence, the much lower Zn2+ diffusion energy of PMO lead to the improved electrochemical performance of PMO.
In summary, we developed a conducting polymer intercalated MoO3 with extensively extended interlayer spacing for high performance ZIBs cathode. We demonstrated the superiority of organic molecules intercalation to metal ion intercalation by comparing the Zn ion storage performance and electrochemical kinetics of PMO and NMO. DFT calculation further reveals the intercalation of PANI into MoO3 significantly lower Zn2+ diffusion barrier in contrast to Na+. The ZIBs based on PMO cathode delivers a high capacity of 157 mAh/g at the current density of 0.5 A/g and ameliorative stability (63.4% capacity retention after 1000 cycles). This work presents the first example of intercalation engineering to improve MoO3 based material as a stable cathode for aqueous ZIBs, which will give new insights in the exploration of advanced energy storage systems.
The authors declare that there are no conflicts to declare.
This work was financially supported by the National Natural Science Foundation of China (Nos. 51771058, 51801030), Natural Science Foundation of Guangdong Province (No. 2018A030310571).
Supplementary material associated with this article can be found, in the online version, at doi:
Z. Ye, Z. Cao, M.O. Lam Chee, et al., Energy Storage Mater. 32 (2020) 290–305. doi: 10.1016/j.ensm.2020.07.011
J. Shin, J.W. Choi, Adv. Energy Mater. 10 (2020) 2001386. doi: 10.1002/aenm.202001386
N. Liu, X. Wu, Y. Yin, et al., ACS Appl. Mater. Interfaces 12 (2020) 28199–28205. doi: 10.1021/acsami.0c05968
Z. Lv, W. Meng, Y. Yang, et al., J. Power Sources 496 (2021) 229840. doi: 10.1016/j.jpowsour.2021.229840
N. Liu, X. Wu, Y. Zhang, et al., Adv. Sci. 7 (2020) 2000146. doi: 10.1002/advs.202000146
H. Jia, Z. Wang, B. Tawiah, et al., Nano Energy 70 (2020) 104523. doi: 10.1016/j.nanoen.2020.104523
W. Xu, Y. Wang, Nano-Micro Lett. 11 (2019) 90. doi: 10.1007/s40820-019-0322-9
Y. Liu, J. Wang, Y. Zeng, et al., Small 16 (2020) 1907458. doi: 10.1002/smll.201907458
H. Zhang, W. Wu, Q. Liu, et al., Angew. Chem. Int. Ed. 60 (2021) 896. doi: 10.1002/anie.202010073
X. Han, H. Leng, Y. Qi, et al., Chem. Eng. J. 431 (2022) 133931. doi: 10.1016/j.cej.2021.133931
D. Kundu, B.D. Adams, V. Duffort, S.H. Vajargah, L.F. Nazar, Nat. Energy 1 (2016) 16119. doi: 10.1038/nenergy.2016.119
V. Soundharrajan, B. Sambandam, S. Kim, et al., Nano Lett. 18 (2018) 2402–2410. doi: 10.1021/acs.nanolett.7b05403
C. Xia, J. Guo, P. Li, X. Zhang, H.N. Alshareef, Angew. Chem. Int. Ed. 57 (2018) 3943–3948. doi: 10.1002/anie.201713291
P. He, M. Yan, G. Zhang, et al., Adv. Energy Mater. 7 (2017) 1601920. doi: 10.1002/aenm.201601920
X. Gao, H. Wu, W. Li, et al., Small 16 (2020) 1905842. doi: 10.1002/smll.201905842
N. Zhang, F. Cheng, Y. Liu, et al., J. Am. Chem. Soc. 138 (2016) 12894–12901. doi: 10.1021/jacs.6b05958
L. Zhang, L. Chen, X. Zhou, Z. Liu, Adv. Energy Mater. 5 (2015) 1400930. doi: 10.1002/aenm.201400930
L. Ma, S. Chen, H. Li, et al., Energy Environ. Sci. 11 (2018) 2521–2530. doi: 10.1039/C8EE01415A
M. Yu, X. Cheng, Y. Zeng, et al., Angew. Chem. Int. Ed. 55 (2016) 6762–6766. doi: 10.1002/anie.201602631
A.M. Hashem, H. Groult, A. Mauger, K. Zaghib, C.M. Julien, J. Power Sources 219 (2012) 126–132. doi: 10.1016/j.jpowsour.2012.06.093
P. Meduri, E. Clark, J.H. Kim, et al., Nano Lett. 12 (2012) 1784. doi: 10.1021/nl203649p
L.Q. Mai, B. Hu, W. Chen, et al., Adv. Mater. 19 (2007) 3712–3716. doi: 10.1002/adma.200700883
W. Li, Z.L. Tao, J. Chen, J. Phys. Chem. B 110 (2006) 119–124. doi: 10.1021/jp0553784
Y. Liu, J. Wang, Y. Zeng, et al., Small 16 (2020) e1907458. doi: 10.1002/smll.201907458
C. Yuan, Y. Zhang, Y. Pan, et al., Electrochim. Acta 116 (2014) 404–412. doi: 10.1016/j.electacta.2013.11.090
X. He, H. Zhang, X. Zhao, et al., Adv. Sci. 6 (2019) 1900151. doi: 10.1002/advs.201900151
J. Huang, Z. Wang, M. Hou, et al., Nat. Commun. 9 (2018) 2906. doi: 10.1038/s41467-018-04949-4
S. Chen, K. Li, K.S. Hui, J. Zhang, Adv. Funct. Mater. 30 (2020) 2003890. doi: 10.1002/adfm.202003890
M. Yan, P. He, Y. Chen, et al., Adv. Mater. 30 (2018) 1703725. doi: 10.1002/adma.201703725
F. Ming, H. Liang, Y. Lei, et al., ACS Energy Lett. 3 (2018) 2602–2609. doi: 10.1021/acsenergylett.8b01423
Y. Yang, Y. Tang, G. Fang, et al., Energy Environ. Sci. 11 (2018) 3157–3162. doi: 10.1039/C8EE01651H
F. Wan, Z. Niu, Angew. Chem. Int. Ed. 58 (2019) 16358–16367. doi: 10.1002/anie.201903941
G. Kresse, D. Joubert, Phys. Rev. B 59 (1999) 1758.
J.P. Perdew, K. Burke, M. Ernzerhof, Phys. Rev. Lett. 77 (1996) 3865. doi: 10.1103/PhysRevLett.77.3865
S. Grimme, J. Antony, S. Ehrlich, S. Krieg, J. Chem. Phys. 132 (2010) 154104. doi: 10.1063/1.3382344
B. Wang, J. Yan, Y. Zhang, et al., Adv. Funct. Mater. (2021) 2102827.
B. Wang, E.H. Ang, Y. Yang, et al., Adv. Funct. Mater. 30 (2020) 2001708. doi: 10.1002/adfm.202001708
M. Dieterle, G. Mestl, Phys. Chem. Chem. Phys. 4 (2002) 822–826. doi: 10.1039/b107046k
S. Kundu, B. Satpati, M. Mukherjee, T. Kar, S.K. Pradhan, New J. Chem. 41 (2017) 3634–3645. doi: 10.1039/C7NJ00372B
S. Kundu, B. Satpati, T. Kar, S.K. Pradhan, J. Hazard. Mater. 339 (2017) 161–173. doi: 10.1016/j.jhazmat.2017.06.034
S. Goswami, U.N. Maiti, S. Maiti, M.K. Mitra, K.K. Chattopadhyay, Mater. Chem. Phys. 138 (2013) 319–326. doi: 10.1016/j.matchemphys.2012.11.063
D. Chen, M. Liu, L. Yin, et al., J. Mater. Chem. 21 (2011) 9332. doi: 10.1039/c1jm11447f
J.C.C. Thomas, A. Patterson, D.E. Leyden, D.M. Hercules, J. Phys. Chem. 80 (1976) 1700–1708. doi: 10.1021/j100556a011
Y. Yang, C. Liu, Z. Lv, et al., Adv. Mater. 33 (2021) e2007388. doi: 10.1002/adma.202007388
S. Liu, H. Zhu, B. Zhang, et al., Adv. Mater. 32 (2020) e2001113. doi: 10.1002/adma.202001113
J. Swiatowska-Mrowiecka, S. de Diesbach, V. Maurice, et al., J. Phys. Chem. C 112 (2008) 11050–11058. doi: 10.1021/jp800147f
L. Shen, Y. Wang, H. Lv, et al., Adv. Mater. 30 (2018) e1804378. doi: 10.1002/adma.201804378
J.B. Cook, H.S. Kim, T.C. Lin, et al., Adv. Energy Mater. 7 (2016) 1601283.
D. Xie, F. Hu, X. Yu, et al., Chin. Chem. Lett. 31 (2020) 2268–2274. doi: 10.1016/j.cclet.2020.02.052
H. Liang, Z. Cao, F. Ming, et al., Nano Lett. 19 (2019) 3199–3206. doi: 10.1021/acs.nanolett.9b00697

Figure 1 (a) Schematic illustration of the preparation process of PMO. (b) The typical SEM image of PMO. (c) XRD patterns and (d) HRTEM images of PMO and NMO. (e) Elemental mapping analysis of PMO.

Figure 2 (a) Raman spectras, (b) FT-IR, (c) TG, (d) full XPS survey spectra, (e) Mo 3d XPS spectra and (f) water contact angle of PMO and NMO.

Figure 3 (a) CV curves at a scan rate of 0.2 mV/s. (b) GCD profiles at a current density of 0.5 A/g. (c) Rate performance range from 0.5 A/g to 5 A/g. (d) ESI analysis and (e) long-term cycling performance at 10 A/g of PMO and NMO.

Figure 4 (a) The second cycle of GCD profiles of PMO. (b) Ex-situ XRD patterns, (c, d) ex-situ Raman spectras at the discharge and charge states of PMO. (e) Mo 3d and (f) Zn 2p XPS spectras at the discharge and charge states of PMO.

Figure 5 (a) CV curves at different scan rates of PMO. log(i) versus log(v) plots of redox peaks of (b) PMO and (c) NMO. (d) Normalized contribution ratios of capacitive storage to total capacity at different scan rates and (e) Zn2+ diffusion coefficients at various states of discharge during GITT measurements of PMO and NMO. Zn2+ diffusion pathways of (f) NMO and (g) PMO. (h) Diffusion barrier profiles of Zn2+ transport in NMO and PMO.

 扫一扫看文章

扫一扫关注我们
 DownLoad:
 下载:
下载: