Figure 1.
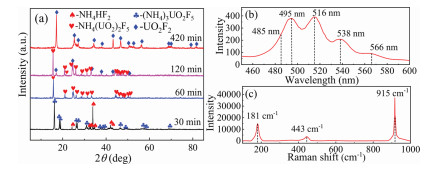
(a) XRD patterns of products obtained at 573 K for 30 min, 60 min, 120 min, 420 min. (b) Fluorescence spectrum and (c) Raman spectrum.
Fluorination reaction of UO3 and electrochemical preparation of UO2
Rugeng Liu , Yangyang Meng , Wenjing Ji , Wei Han , Mei Li , Yang Sun

The reprocessing of spent fuel is one of the critical steps in the nuclear fuel cycle. In recent decades, extensive studies have been carried out on dry reprocessing using molten salt as a medium [1-3]. Thereinto, the electrolytic refining process developed by the United States and oxide-electrowinning reprocessing developed by Russia as are considered as the prominent candidate technologies for advanced nuclear fuel reprocessing in the future [4, 5]. For MOX spent fuel, removing the cladding material is an important step in head-end process of spent fuel reprocessing. Recently, high temperature oxidation technology was adopted to separate spent fuel from cladding material by high temperature calcination UO2 to form a volume expansion force to destroy the cladding material, which was proposed by Idaho national laboratory (TNL) and Korea atomic energy research institute (KAERI). During the process, UO2 is oxidized to U3O8 and UO3 [6]. In the oxide-electrowinning process, uranium and fission products in the oxide fuel are firstly chlorinated and dissolved into the molten salt as oxychloride (uranyl ion) and chloride ions by flowing chlorine gas, then uranyl ion is reduced to form the raw material of MOX fuel (UO2) on the cathode in molten chlorides. However, the spontaneity of the chlorination reaction is unfavorable, and hence, it is necessary to add reducing agents, for instance, carbon and carbon monoxide into the melts [7]. Thus, many investigators explored the chlorination reaction of uranium oxide (UO2 and U3O8) using ZrCl4 [8], CCl4 [9, 10], NH4Cl [11]. Sakamura et al. [8] studied UO2 was chlorinated to form UCl4 by ZrCl4 in LiCl-KCl melt, however, the conversion rate was only 37%. Kitawaki et al. [9] explored the chlorination UO2 and U3O8 using CCl4 through mechanical mixing method, but did not succeed. Jiang et al. [10] chlorinated U3O8 to UCl4 using CCl4 at high temperature, but CCl4 would volatilize severely and the by-product of UCl5 was formed. As we known, UCl5 is easy to volatilize which causes the loss of uranium. Liu et al. [11] investigated the chlorination reaction of U3O8 and NH4Cl in LiCl-KCl melt under air atmosphere. Their results showed that U3O8 can be successfully chlorinated to UO22+. Wani et al. [12] studied the fluorination of UO2 and U3O8 with NH4HF2 and found the formation of [NH4]4UF8 and [NH4]3UO2F5 compounds. These two compounds, on heating to about 673 K could form UF4 and UO2F2·2H2O, respectively.
The electrochemical reduction of UO22+ has been explored in molten chlorides and found that UO22+ can be reduced to UO2 by two-step single electron transfer [13-16]. Schlechteret et al. [17] reported that the crystalline form of electrodeposited UO2 in LiCl-KCl molten salt was affected by the presence of fluoride, and the presence of a small amount of fluoride would be conducive to the formation of cubic crystal UO2. Caligara et al. [18] measured the diffusion coefficient of UO22+ in molten LiCl-KCl eutectic.
In order to explore the route of the formation of UO2 using UO3 as raw material, NH4HF2 was chosen as fluoride reagent to make uranium oxide change to UO22+ under air atmosphere. Then, the electrochemical formation of UO2 was investigated in LiCl-KCl molten salt by constant potential electrolysis for uranium extraction. The fluoride product and electrodeposition sample were checked by XRD, SEM-EDS.
Firstly, the possibility of the formation of UO2F2 from UO3 was estimated using the thermodynamic analysis of related fluorination reactions. UO3 can react with NH4HF2 or HF obtained from the decomposition of NH4HF2 to form UO2F2, the following reactions may be involved as follows:
|
|
(1) |
|
|
(2) |
|
|
(3) |
The standard Gibbs free energy changes (ΔrGmΘ) for these reactions at various temperatures were calculated shown in Fig. S1 (Supporting information). It can be seen that (ΔrGmΘ) of these reactions are less than zero, which means that all the reactions correlated with the formation of UO2F2 are spontaneous at the temperature of 473–873 K. Moreover, the (ΔrGmΘ) becomes more and more negative with the increasing temperature, indicating that the increase of temperature can be beneficial to the fluorination reaction of UO3.
The fluorination reaction of UO3 with NH4HF2 was performed at 573 K for different times. The obtained products were characterized by XRD shown in Fig. 1a. It can be seen from Fig. 1a that after the fluorination reaction for 30 min, only (NH4)3UO2F5 is observed except for the unreacted NH4HF2. No diffraction peak of UO3 occurs, indicating that UO3 is firstly converted to (NH4)3UO2F5. After 60 min, only NH4(UO2)2F5 appears, which shows that (NH4)3UO2F5 is completely converted to NH4(UO2)2F5. When the fluorination reaction time is extended to 120 min, the diffraction peak of UO2F2 is observed. However, NH4(UO2)2F5 is not completely decomposed, and its diffraction peaks can still be observed. However, after the reaction for 420 min, XRD result indicates there are only UO2F2, and NH4(UO2)2F5 has been completely converted to UO2F2.
To further confirm the formation of UO2F2, fluorescence spectroscopy and Raman spectroscopy were used to analyze the product obtained from the fluorination of UO3 for 180 min at 673 K. It can be seen from Fig. 1b that peaks maxima appear at about 485, 495, 516, 538 and 566 ± 0.5 nm, showing a five-finger shape, which is a typical characteristic peak of UO22+ [19, 20]. Fig. 1c shows the Raman spectrum of the product. Three obvious vibration peaks are observed at 181 cm−1, 443 cm−1 and 915 cm−1, respectively. Among them, the strong band at 915 cm−1 is ascribed to the symmetric U-O stretching vibration. The band at 181 cm−1 corresponds to the U-O bending fundamental and the weaker band at 443 cm−1 is related to the U-F lattice vibration which are consistent with those of UO2F2 obtained by Armstrong et al. [21]. These results demonstrate the formation of UO2F2.
The reaction mechanism is expressed as follows:
|
|
(4) |
|
|
(5) |
|
|
(6) |
The products obtained under different fluorination times at 573 K were analyzed by SEM to observe the morphology changes. Fig. S2 (Supporting information) shows the SEM images of fluorination products obtained at different duration. It can be seen that UO3 presents a spherical particle with size of about 1 µm. UO3 was fluorinated for 30 min, according to the XRD result, (NH4)3UO2F5 with size of about 3 µm is formed. A truncated octahedral composed of four hexagons and ten quadrilaterals is observed in Fig. S2b. After 60 min of the reaction, according to the XRD result, (NH4)3UO2F5 is decomposed to NH4(UO2)2F5, and NH3 and HF are released. Thus, a small number of pores are observed on the surface of the particles (Fig. S2c). When the reaction proceeds for 420 min, the product is UO2F2 based on the XRD result. It can be observed from Fig. S2d that the formation of pores appears on the surface of the particles due to the release of NH3 and HF, which indicates that large amounts of NH3 and HF have been released.
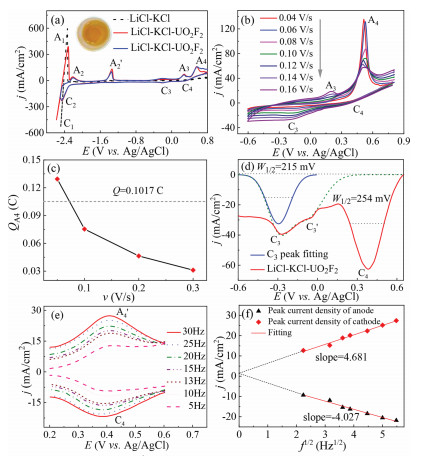
Then the electrode reaction of UO22+ was studied in LiCl-KCl melts on Mo electrode at 773 K using cyclic voltammetry (CV) shown in Fig. 2a. In the black line, peaks C1 and A1 are attributed to the deposition and dissolution of metallic Li. While UO22+ was added into LiCl-KCl melts, the color of the molten salt change from colorless to yellow shown in the inset of Fig. 2a, which is exactly the color of UO22+ dissolved in molten salt. In the red line, four new anodic peaks, A2, A2', A3 and A4, are observed at −2.21 V, −1.42 V, 0.27 V and 0.54 V, respectively. Only three cathodic peaks, C2, C3 and C4, are observed at −2.45 V, −0.31 V and 0.32 V, respectively. The redox couple C4/A4 may be correlated with the soluble/soluble redox process of UO22+/UO2+.
|
|
(7) |
The C3/A3 couple pertains to the formation of UO2 and its re-oxidation.
|
|
(8) |
The C2/A2 couple is ascribed to the reduction of UO2 to U metal and oxidation of U metal, and A2′ corresponds to the dissolution of U to U3+ [22, 23].
Fig. 2b presents the CV curves of LiCl-KCl-UO22+ (0.24 wt%) melts at various scan speeds. For the redox peaks of C3/A3, with the increase of the scan rate, the cathodic/anodic peak currents increase and the cathodic/anodic peak potentials have a significant negative/positive shift which shows that the Eq. 9 is not a reversible process. However, for the redox peaks of C4/A4, with the increase of the scan rate, the cathodic peak current increases and anodic peak current decreases. It can be seen that when the scan rate is 0.04 V/s and 0.06 V/s, the oxidation peak A3 is not observed. A4 is related to the UO2+ to disproportionate into UO2 (monolayer) and it has a sharp shape and a large peak current. When the scan rate reaches 0.08 V/s, peak A3 appears, and the peak current of A4 decreases rapidly, the peak potential shifts negatively, and the peak become widens. When the scan rate increases from 0.1 V/s to 0.16 V/s, the peak current of A3 continued to increase, the peak current of A4 gradually decreases, and peak A4 became wider.
This phenomenon may be caused by the disproportionation reaction of UO2+.
|
|
(9) |
At low scan rate, the measurement time is relatively long, the formedUO2+ has enough time to generate UO22+ and UO2 by the disproportionation Eq. 9, and the concentration of UO2+ decreases, which results in that the current peaks C3 and A3 related to the reduction and oxidation of UO2+ are not obvious. As the scan rate increases, the disproportionation reaction time is reduced, and the amount of UO2 generated by the disproportionation reaction gradually decreases, the peak current of the oxidation peak A4 gradually decrease and oxidation peak A3 gradually appears.
The electrode area is 0.3768 cm2. Assuming that a layer of UO2 was deposited on the electrode surface, the electric quantity of A4 which was integrated of the peak area required by disproportionation reaction is at least 0.102 C. To obtain the electric quantity passed during oxidation reaction, the current and oxidation time related to the peak A4 in Fig. 2b was integrated, and then the relationship of quantity of electricity versus scan rate was plotted, as shown in Fig. 2c. It can be seen that when the scan rate is relatively low, the electric quantity passing through the oxidation peak A4 is close to that required to theoretically deposit a single layer of UO2. As the scan rate increases, the electric quantity passing through peak A4 gradually decreases, which meant the amount of UO2 deposited at A4 gradually decreases. This is consistent with the analysis result in Fig. 2b and further proves that the existence of oxidation peak A4 is correlated with the formation of UO2 by the disproportionation reaction of UO2+.
To further illustrating the electrochemical reactions correlated with peaks C3 and C4, the square wave voltammetry (SWV) was used to measure the number of electron-transferred during the two electrochemical reactions. Fig. 2d shows the SWV curve when reduction reaction of UO22+ occurs on W electrode. In the measured potential range, three reduction peaks (C3, C3′ and C4) are observed and then the number of electrons transferred obtained by Eq. 10.
|
|
(10) |
where W1/2 is the half-peak width; R is ideal gas constant; T is absolute temperature; F is Faraday constant; and n is the number of electrons transferred.
Since the appearance of peak C3', which may be related to the nucleation of UO2 [24], will interfere with the calculation result peak C3, the Gaussian fitting was performed to eliminate the influence. Using Eq. 10, the number of electron transfer attributed to the peak C3 is 1.09, close to 1. Thus, the reaction correlated with peak C3 is the reduction reaction of UO2+ to UO2 via a one-step involving one electron.
And the calculated number of electron-transferred from the reduction peak of C4 is 0.92, close to 1, which means the reaction pertaining to peak C4 is that UO22+ is reduced to UO2+ in a one-step with the exchange of one-electron. Fig. 2d shows the SWV curves of LiCl-KCl-UO2F2 melts at various frequencies. As shown in Fig. 2e, a pair of obvious redox peaks A4'/C4 appears at around −0.40 V, and their shape is flat and symmetrical, which indicates that the redox reaction is a reversible reaction in a soluble/soluble system. Plotting the peak current density and the square root of the frequency, a good linear relationship indicates that the redox reaction is controlled by diffusion (Fig. 2f). Thus, the diffusion coefficient of UO22+ can be calculated using Eq. 11 [25].
|
|
(11) |
where C0 is concentration of UO22+ in the molten salt (C0 = 9.804 × 10⁻⁵ mol/cm3); D is diffusion coefficient (cm2/s); n is numbers of electrons transfer (n = 1); f is frequency; ESW is amplitude of SWV (ESW = 0.1 V).
The calculated diffusion coefficient of UO22+ at 773 K is 6.22 × 10⁻⁵ cm2/s, which has the same order of magnitude with the literature (1.54 × 10⁻⁵ cm2/s) obtained on platinum electrode at 858 K [18].
According to the electrochemical results, it is feasible for the formation of UO2 by molten electrolysis. Thus, potentiostatic electrolysis was performed to form UO2 at −0.8 V for 8 h. The change of current with time was recorded, as shown in Fig. 3a. A strong current appears at the beginning (inset), which might be related to the formation and growth of UO2 nuclei. Before 1500 s, the current fluctuated at −20 mA, meaning the formation of UO2. However, with the proceeding, the concentration of UO22+ decreases, leading to the decrease of the absolute value of current. When the I-t curve became steady and close to background current about 2 mA, it could be considered that the run is completed.
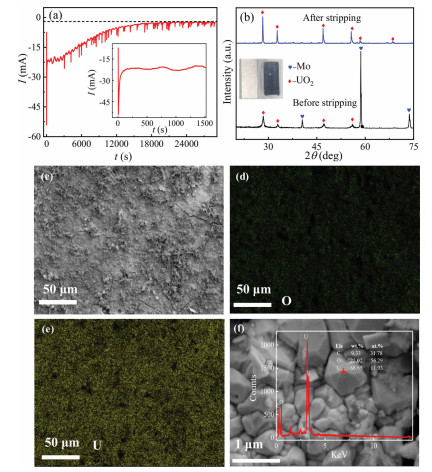
The XRD spectra of the product gained shown in Fig. 3b indicates the formation of UO2 successfully and the color of the Mo plate changes from metallic luster to black, as shown in inset of Fig. 3b. After stripping off the UO2 from the electrode, the diffraction peaks in XRD spectra shown in Fig. 3b became stronger and sharper, showing the deposited UO2 has a high crystallinity. The morphology and element distribution were characterized, as shown in Figs. 3c-f, the UO2 is unevenly distributed on the electrode surface in a dendritic state. EDS analysis also proved the formation of UO2. Before and after the run, the concentration of U in the melts was analyzed by ICP-AES and the extraction efficiency was calculated using Eq. 12. The calculated result indicated that after 8 h electrolysis, the extraction of UO2 can reach 98.53%.
|
|
(12) |
where η is extraction efficiency; C1 and C2 are the initial and final concentrations of UO22+ in the melts, respectively.
In order to electrochemically form UO2 using UO3 as raw material, the formation of UO2F2 by the fluorination reaction of UO3 and NH4HF2 and its mechanism were firstly studied using XRD, Raman and fluorescence. The results revealed the formation of UO2F2, and the mechanism was inferred to be comprised of the following three process UO3(s) + 3NH4HF2(s) → (NH4)3UO2F5 → NH4(UO2)2F5(s) → 2UO2F5(s). Then, the electrochemical formation of UO2 was studied using CV and SWV, which illustrated UO22+ could be reduced to UO2 via a two-step single electron exchange process with diffusion-controlled. The diffusion coefficient of UO22+ was estimated to be 6.22 × 10⁻⁵ cm2/s. The disproportionation reaction of UO2+ was observed, and the relationship between the disproportionation reaction and scan rate was discussed. In addition, UO2 was prepared employing potentiostatic electrolysis at −0.8 V for 8 h in LiCl-KCl-UO2F2 melt. XRD and SEM-EDS results indicated UO2 with micron-sized octahedral structure was formed, and the extraction efficiency of UO2 calculated by ICP-AES could reach 98.53%. The feasibility of UO2 prepared using UO3 as raw material was proved.
The authors declare that they have no known competing financial interests or personal relationships that could have appeared to influence the work reported in this paper.
The work was financially supported by the National Natural Science foundation of China (Nos. U2167215, 22076035, 21876034, 11875116 and 21790373), and the Fundamental Research Funds for the Central Universities (No. 3072021CFJ1001).
Supplementary material associated with this article can be found, in the online version, at doi:10.1016/j.cclet.2022.02.069.
D.W. Yang, Y.L. Liu, T.Q. Yin, et al., Electrochim. Acta 353 (2020) 136449. doi: 10.1016/j.electacta.2020.136449
Y.K. Zhong, Y.L. Liu, K. Liu, et al., Nat. Commun. 12 (2021) 5777. doi: 10.1038/s41467-021-26119-9
D.W. Yang, S.L. Jiang, Y.L. Liu, et al., Sep. Purif. Technol. 281 (2022) 119853. doi: 10.1016/j.seppur.2021.119853
S. Vavilov, T. Kobayashi, M. Myochin, J. Nucl. Sci. Technol. 41 (2004) 1018-1025. doi: 10.1080/18811248.2004.9726326
J.L. Willit, W.E. Miller, J.E. Battles, J. Nucl. Mater. 195 (1992) 229-249. doi: 10.1016/0022-3115(92)90515-M
B.R. Westphal, J.J. Park, J.M. Shin, et al., Sep. Sci. Technol. 43 (2008) 2695-2708. doi: 10.1080/01496390802122139
Y.S. Yang, Y.H. Kang, H.K. Lee, Mater. Chem. Phys. 50 (1997) 243-247. doi: 10.1016/S0254-0584(97)01943-3
Y. Sakamura, T. Inoue. T. Iwai, H. Moriyama, J. Nucl. Mater. 340 (2005) 39-51. doi: 10.1016/j.jnucmat.2004.11.002
S. Kitawaki, T. Nagai, N. Sato, J. Nucl. Mater. 439 (2013) 212-216. doi: 10.1016/j.jnucmat.2013.03.017
K. Jiang, V. Smolenski, A. Novoselova, et al., Electrochim. Acta 318 (2019) 194-201. doi: 10.1016/j.electacta.2019.06.075
Y.C. Liu, Y.L. Liu, L. Wang, et al., J. Nucl. Mater. 542 (2020) 152475. doi: 10.1016/j.jnucmat.2020.152475
B.N. Wani, S.J. Patwe, U.R. Rao, K.S. Venkateswarlu, J. Fluorine Chem. 44 (1989) 177-185. doi: 10.1016/S0022-1139(00)83937-8
J.R. Chalkley, J. Less Common Met. 3 (1961) 98-109. doi: 10.1016/0022-5088(61)90002-9
T. Nagai, T. Fujii, O. Shirai, H. Yamana, J. Nucl. Sci. Tech. 41 (2004) 690-695. doi: 10.1080/18811248.2004.9715534
T. Nagai, A. Uehara, T. Fujii, O. Shiral, H. Yamana, J. Nucl. Sci. Tech. 43 (2006) 1511-1516. doi: 10.1080/18811248.2006.9711247
I. Uchida, J. Niikura, S. Toshima, J. Electroanal. Chem. 124 (1981) 165-177. doi: 10.1016/S0022-0728(81)80294-X
M. Schlechter, J. Kooi, R. Billiau, R.A. Charlier, G.L. Dumont, J. Nucl. Mater. 15 (1965) 189-200. doi: 10.1016/0022-3115(65)90180-7
F. Caligara, L. Martinot, G. Duyckaerts, J. Electroanal. Chem. 16 (1968) 335-340. doi: 10.1016/S0022-0728(68)80081-6
J.Y. Lee, J.Y. Oh, K. Putri, M. Baik, J.I. Yun, J. Radioanal. Nucl. Chem. 312 (2017) 221-231. doi: 10.1007/s10967-017-5233-y
Y. Sihn, J.I. Yun, W. Lee, J. Radioanal, Nucl. Chem. 308 (2016) 413-423. doi: 10.1007/s10967-015-4428-3
D.P. Armstrong, R.J. Jarabek, W.H. Fletcher, Appl. Spectrosc. 43 (1989) 461-467. doi: 10.1366/0003702894203002
Y.K. Zhong, K. Liu, Y.L. Liu, et al., J. Electrochem. Soc. 166 (2019) D276-D282. doi: 10.1149/2.0201908jes
H.M. Li, R.G. Liu, W. Han, et al., Electrochimi. Acta 400 (2021) 139474. doi: 10.1016/j.electacta.2021.139474
D. Han, C. She, J. Peng, et al., J. Electrochem. Soc. 165 (2018) 301-306. doi: 10.1149/2.0971807jes
E.P. Parry, R.A. Osteryoung, Anal. Chem. 37 (1965) 1634-1637. doi: 10.1021/ac60232a001

Figure 1 (a) XRD patterns of products obtained at 573 K for 30 min, 60 min, 120 min, 420 min. (b) Fluorescence spectrum and (c) Raman spectrum.

Figure 2 CV curves of UO22+ at (a) 0.1 V/s and (b) various scan speed. (c) The relationship of electricity amount and scan speed. (d) SWV curve of UO22+ at 20 Hz. (e) Various frequencies, and (f) fitting line of peak current density versus square root of frequency (f1/2).

 扫一扫看文章

扫一扫关注我们
 DownLoad:
 下载:
下载:
