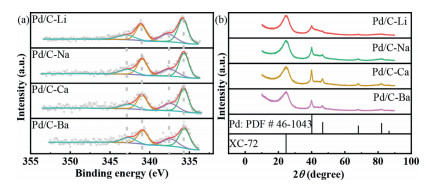
Figure 1.
(a) X-ray photoelectron spectroscopy (XPS) graphic of Pd 3d for these four catalysts with peak fitting of the Pd(Ⅱ) and Pd(0), and (b) X-ray diffraction (XRD) graphic of these four catalysts with PDF card.
Revealing the true origin of size-dependent Pd/C catalytic behavior towards formic acid decomposition
Qinglei Meng , Xian Wang , Meiling Xiao , Zhao Jin , Junjie Ge , Changpeng Liu , Wei Xing

Hydrogen is becoming increasingly attractive as an alternative energy source to fossil fuels, with highly efficient H2 storage and transportation technologies being urgently necessitated [1-3]. Among the proposed technologies [4, 5], storing hydrogen energy in small organic molecules such as formic acid (FA) [6, 7] has been highlighted as a promising route. To date, formic acid is the only hydrogen storage organic molecule that could release hydrogen at room temperature [8]. Furthermore, FA possesses a high hydrogen release capacity (0.052 kg H2/L compared with 0.040 kg H2/L of U.S. Department of Energy (DOE) 2020 target), making it highly competitive among the hydrogen storage technologies [9, 10].
To date, Pd based catalysts are experimentally revealed to exhibit the most promising FA decomposition (FAD) behavior, further supported by density functional theory (DFT) calculations and proved by 13C nuclear magnetic resonance (NMR) characterization. Lots of efforts have been devoted to further optimizing the catalytic behavior of Pd, with Ag and Au [11, 12] found to be extremely useful in optimizing the electronic structure of Pd towards highly efficient FAD, in line with DFT calculation [13]. Meanwhile, ternary catalysts with introduction of the third earth abundant elements have also been fabricated to reduce the precious metal usage in the FAD catalysts [14-17].
Another pathway for preparing appropriate catalysts towards FAD is to optimize the Pd catalyst itself by altering the electronic structure by adjusting the Pd particle size or modulating the carrier effect via tuning the catalyst support [18]. It is known that catalysts loaded on carbon supports show superb activity compared to others [19-23], with N-doped [24] and B-doped [8] carbon supports exhibiting even better performance. Interestingly, almost all of the best-behaved catalysts contain a high portion of ionic Pd on the surface. For instance, the Pd(Ⅱ) contents in Pd/NC [25] and PdAu alloy [26] are about 60%, which are much larger than that of Pd/C [27] (40%), and the increase in Pd(Ⅱ) content on surface takes the same trending to the increase in catalytic activity.
Although the positive correlation between the performance of Pd(Ⅱ) can be summarized by comparing the reports in literature, systematic studies have been carried out only since 2017. To look into the particle size effect of Pd/C catalysts, Lu's group [28] prepared a series of Pd/C catalysts at different particle sizes, they observed clear particle size dependent behavior of the Pd/C catalysts towards FAD. Cai's group [29] and Xing's group [27] also carried out independent study on the size effect of Pd towards FAD. A general consensus has been reached among these studies, i.e., the smaller the particle size, the higher the intrinsic activity of Pd towards FAD. This is the so-called size-dependent effect in FAD. Although the size-dependent catalysis behavior is assured, the underlying reason for such phenomenon is still ambiguous. For instance, the catalysts at different sizes were prepared by controlling the different variables, i.e., the reduction temperature, reduction agents, and pH, which may lead to differences in not only particle sizes, but also on Pd surface valence states and exposed facets. It is known for long in catalysis that nanoparticles with different sizes and different exposed facets possess different coordination numbers and surface relaxation states, which results in different binding energies and activities in sensitive catalytic reactions [30, 31]. Therefore, it is urgent to reveal the underlying reason for the size-dependent behavior of FAD on Pd, by separating the valence state effect, size effect and the facet effect. However, such endeavor is expected to be extremely challenging, since the three effects are deeply intermingled.
We begin our study by wondering whether there exists a way to separate the surface valence states, particle size, and exposed facets effects on the Pd/C. Taking the synthesis of Pd/C through ethylene glycol (EG) reduction as example, we firstly used Nernst equation (Eq. 1) to look into the reaction variables by only considering the first step of EG oxidation. The redox equation is shown in Eq. 2 and the specific Nernst equation is shown in Eq. 3. It is clear that changing the catalyst synthesis temperature can drastically affect the redox reaction thermodynamically, while pH had no effect on the redox property. However, during synthesis of the catalyst, as EG is both reactant and solute, the concentration of water should not be ignored as it could dilute the concentration of EG. Given that the pH-adjustment agent is typically dissolved in water, thus, more water will be introduced into the preparation process when the pH is tuned to a higher value. Hence, a decrease in the redox thermodynamic potential will be gained, thereby conferring EG with lower reducing capability and leads to formation of Pd sites with higher average valence. Besides, the larger the pH, the faster the precipitation rate and the slower the ripening rate of the nanoparticles. These facts in combine will result in a smaller and more uniform nano-catalyst. Such deduction matches well with our recent work [27], where particle sizes ranging from 16.2 nm to 2.5 nm were obtained by adjusting the solution pH from 4 to 11, with an increase in Pd(Ⅱ) content from 28% to 40% observed. Therefore, according to Nernst equation, at the same reaction temperature, particle size and average surface Pd valence states are controlled independently by pH and water concentration, respectively. This suggests the possibility of separating the specific effects of size and Pd valence states by developing a method to adjust only the particle size without changing the average valence state.
|
|
(1) |
|
|
(2) |
|
|
(3) |
Achieving such goal means to neither alter the concentration of water nor the temperature during preparation of the catalyst, to avoid any disturbance during the synthesis process of the catalysts. Given such strict confinement, we chose the cation dipole adjustment method to synthesize catalysts at different sizes. Specifically, by changing the cation in the pH-adjustment agent, a slight difference in the dipole leads to micro-disturbance at the reduction interface. The larger the charge density of the cationic dipoles, the larger the affinity between the cation and Pd(OH)x precursor at the interface, thereby inhibiting the adsorption of Pd atom on the surface, leading to dipole dependent growth and ripening rate of the nanoparticles. In this way, the Pd nanoparticle size can be successfully tuned without disturbing the Pd surface valence states.
Based on the above, microwave-assisted reduction was conducted in ethylene glycol with different pH-adjustment agents (LiOH, NaOH, Ca(OH)2, Ba(OH)2) containing the same concentration of hydroxyl (1 mol/L), and the reduction pH was adjusted to 10.8. Fig. S1 (Supporting information) clearly demonstrates the effectiveness in particle size regulation by varying the cation dipoles. For cations in the same group, smaller cation radius and larger charge density leads to a smaller particle size, ascribable to the strong affinity between the cation and the nanoparticles, as predicted above and depicted in Scheme S1 (Supporting information). For cations in different groups, though the Ca2+ and Ba2+ have larger charge density, the catalysts prepared by these cations still possessed larger size, mainly ascribable to the smaller amounts of cations introduced, where the concentrations of the divalent cations are only half that of the monovalent cations. Hence, although the divalent cations possessed larger charge density, they are insufficient in protecting the formed Pd nanoparticles.
We next probed into the surface valence states of Pd by carrying out XPS characterizations (Fig. 1a). Interestingly, despite the significant difference in particle size (3.0-6.5 nm), all four catalysts exhibit similar electron binding energies and Pd(0) to Pd(Ⅱ) ratios (Table S1 in Supporting information). The fixed Pd(0) (67% ± 1%) and Pd(Ⅱ) (33% ± 1%) content on the catalyst surface unambiguously demonstrates the success of the cation dipole method in tunning the particle sizes without influencing the surface valence states of the catalysts.
Based on these catalysts, the size effect can be revisited. Considering that the size effect is typically originated from surface relaxation, strain effect and varied chemical properties of different exposed lattice facets, the physical structures of these catalysts were characterized by XRD, as shown in Fig. 1b. The peak at 24.5° is assigned to Vulcan XC-72, and the other peaks at 40.1°, 46.7°, 68.1° and 82.0° are assigned to (111), (200), (220) and (311) facets of fcc Pd crystal, respectively. The well-matched peak positions indicate that no strain effect exists among these catalysts, while these catalysts possess multicrystal fabric that gives priority to different crystal face orientations. Furthermore, combining the size distribution and XRD data, it can be inferred that the particles with larger size and non-uniform distribution possess more high index facets orientation, while there are few high index facets orientation in the small particles. This phenomenon could be attributed to both the thermodynamically and kinetically instability of high-index facets [32], which makes the growth of the particles always along the low-index facets, especially to those small particles with high surface energy. Thus, the ratio of high-index facets orientation could be higher in large particles.
CO-stripping was further used to titrate the total sites exposed on the surface of the catalysts. Due to the sensitivity of CO-oxidation to the size-dependent effect, the oxidation peak position of CO-stripping can be used to determine the chemical properties of each site, as shown in Fig. 2. The specific oxidation area has been shown in Fig. S2 (Supporting information) by subtracting the second cyclic voltammetry curve (black base line) from the first cycle for confirming the oxidation peak and the number of active sites.
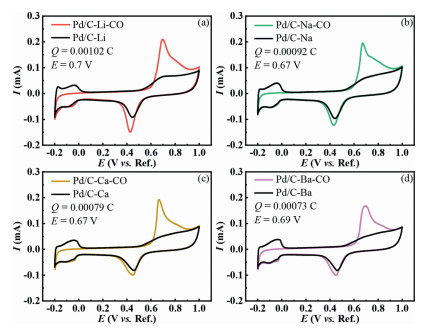
Interestingly, we notice that the catalysts with higher content of high index facets orientation, i.e., the Pd/C-Na and the Pd/C-Ca catalysts, are more active towards CO oxidation, with CO stripping peak potential negatively shifted by 30 mV.
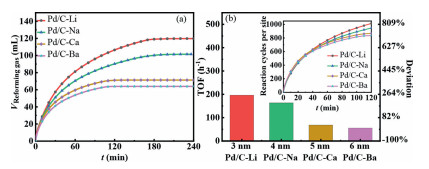
We then tested the FAD behavior of the different catalysts, with intrinsic performance evaluated by the counting turnover frequency (TOF) at each site, with surface sites number titrated by CO-stripping. The tests and normalized results are shown in Fig. 3, and the comparation of TOF between catalysts in this work with different catalysts in literature is shown in Table 1.
 DownLoad:
CSV
DownLoad:
CSV

|
From Table 1, it could find that catalysts in this work could exhibit competitive performance to those reported Pd/C and alloy catalysts [33-35], so that this research could be very representative to FAD over Pd catalysts. Interestingly, by normalizing the actual performance by number of sites, the reaction rates of these four catalysts were found to be nearly the same in the initial 40 min, which indicated that the H2 production rate is neither size sensitive nor facet sensitive. Thus, by combining the above results with those reports on the size-dependent effect in FAD, it can be concluded that the site intrinsic activity of the different catalysts does not change along with the change in the particle size, while the observed size dependent behavior in literature can be ascribed to the altering in Pd surface valence states, as observed in our recent work [27]. Although the content of Pd(Ⅱ) can promote the activity and was previously related to the particle size, the unlock of linkage between particle size and Pd surface valence states confirmed that this relationship is unnecessary.
However, the formic acid dehydration reaction, i.e., the formation of CO and H2O as the final product, holds another story. As shown in Fig. 3b, an obvious divergence in H2 production rate is noted after 50 min, indicative of the surface blockage by CO. This could be attributed to the varied formic acid dehydration rate on different catalysts. Notably, the deviation of TOF between Pd/C-Li and Pd/C-Ba in terms of dehydrogenation reaction, calculated based on the performance between 100 min to 120 min, was as large as 252%, indicative the much faster dehydration rate and thereby the blockage of the surface on Pd/C-Ba. Interestingly, the deactivation of the catalysts, i.e., the dehydration reaction rate is found to increases with the increase in particle size of the four catalysts. Hence, the above results indicate a size effect rather than the facets effect during the formic acid dehydration, which is unfavorable. DFT calculations have confirmed that the dehydration process occurs mainly over the adjacent Pd(0) sites [27], which are abundant in face sites of the large particles. Hence, the improvement of stability in small particles could be attributed to the large proportion of corner sites and edge sites with few adjacent dehydration sites. As electronic structure dependent catalysts with uncontrolled size have been reported before, catalysts with controlled size should be developed to confirm whether the electronic structure is relevant or only the size-effect plays a dominant role in formic acid dehydration.
In conclusion, a cation dipole adjustment method was developed to study the size effect of Pd on the FAD. The previously intermingled particle size and surface valence state effect on catalysis was successfully deconvoluted due to the merit of cation dipole adjustment strategy. By combining the XRD data and oxidation potential of CO-stripping, no necessary relationship could be established between the facet orientation and the FAD performance. Based on these conditions, the widely known size-dependent behavior was divided into the size-effect, surface valence effect and the facets-effect. Accordingly, the specific relationship was confirmed for both formic acid dehydrogenation and formic acid dehydration. For the catalysts with different sizes and facets orientations, less than 5% deviation in TOF was obtained for the first 20 min, indicating that the intrinsic activity of FAD is not sensitive to the Pd nanoparticle size when the size ranges from 3.0 nm to 6.5 nm. Combining with the results in literature, it is concluded that the site intrinsic activity for H2 production is only affected by the Pd surface valence states. However, the formic acid dehydration was sensitive to particle size, where larger particles lead to faster dehydration and thereby faster deactivation towards H2 generation.
Based on the above results, the optimization direction of the catalysts can be summarized clearly. Surface valence states adjustment can be used to increase the site intrinsic activity of the catalysts in formic acid dehydrogenation. Although the size effect was confirmed to be not useful in improving the site intrinsic activity, a decrease in size could increase the utilization efficiency and inhibit the formic acid dehydration. The methods used to separate the specific effects in this work can provide a more exact mode for discussion of affected factors, and can also provide a way to adjust the particle size without changing the electronic structures, which would be very useful in different catalytic areas.
The authors have no completing interests to declare.
The work is supported by the National Natural Science Foundation of China (No. 21733004), the Strategic Priority Research Program of the Chinese Academy of Sciences (No. XDA21090400) and the Natural Science Foundation of Jilin Province (Nos. 20190201300JC, 20200201001JC).
Supplementary material associated with this article can be found, in the online version, at doi:10.1016/j.cclet.2022.02.026.
S. Niaz, T. Manzoor, A.H. Pandith, Renew. Sustain. Energy Rev. 50 (2015) 457–469. doi: 10.1016/j.rser.2015.05.011
A.F. Dalebrook, W. Gan, M. Grasemann, S. Moret, G. Laurenczy, Chem. Commun. 49 (2013) 8735–8751. doi: 10.1039/c3cc43836h
U. Eberle, M. Felderhoff, F. Schuth, Angew. Chem. Int. Ed. 48 (2009) 6608–6630. doi: 10.1002/anie.200806293
A. Boddien, F. Gartner, C. Federsel, et al., Angew. Chem. Int. Ed. 50 (2011) 6411–6414. doi: 10.1002/anie.201101995
S. Enthaler, J.V. Langermann, T. Schmidt, Energy Environ. Sci. 3 (2010) 1207–1217. doi: 10.1039/b907569k
A. Boddien, H. Junge, Nat. Nanotechnol. 6 (2011) 265–266. doi: 10.1038/nnano.2011.70
B. Loges, A. Boddien, H. Junge, M. Beller, Angew. Chem. Int. Ed. 47 (2008) 3962–3965. doi: 10.1002/anie.200705972
K. Jiang, K. Xu, S. Zou, W.B. Cai, J. Am. Chem. Soc. 136 (2014) 4861–4864. doi: 10.1021/ja5008917
B. Loges, A. Boddien, F. Gärtner, H. Junge, M. Beller, Top. Catal. 53 (2010) 902–914. doi: 10.1007/s11244-010-9522-8
Target Explanation Document: Onboard Hydrogen Storage for Light - Duty Fuel Cell Vehicles, The United States Department of Energy, 2017 https://www.energy.gov/eere/fuelcells/downloads/target-explanation-document-onboard-hydrogen-storage-light-duty-fuel-cell.
K. Tedsree, T. Li, S. Jones, et al., Nat. Nanotechnol. 6 (2011) 302–307. doi: 10.1038/nnano.2011.42
W. Hong, M. Kitta, N. Tsumori, et al., J. Mater. Chem. A. 7 (2019) 18835–18839. doi: 10.1039/C9TA06014F
J.S. Yoo, F. Abild-Pedersen, J.K. Nørskov, F. Studt, ACS Catal. 4 (2014) 1226–1233. doi: 10.1021/cs400664z
Z.L. Wang, J.M. Yan, Y. Ping, et al., Angew. Chem. Int. Ed. 52 (2013) 4406–4409. doi: 10.1002/anie.201301009
C. Hu, S.W. Ting, K.Y. Chan, W. Huang, Int. J. Hydrogen Energy 38 (2013) 8720–8731. doi: 10.1016/j.ijhydene.2013.04.151
M. Yurderi, A. Bulut, M. Zahmakiran, M. Kaya, Appl. Catal. B 160-161 (2014) 514–524. doi: 10.1016/j.apcatb.2014.06.004
Z.L. Wang, Y. Ping, J.M. Yan, H. Wang, Q. Jiang, Int. J. Hydrogen Energy 39 (2014) 4850–4856. doi: 10.1016/j.ijhydene.2013.12.148
M. Zacharska, L.G. Bulusheva, A.S. Lisitsyn, et al., ChemSusChem 10 (2017) 720–730. doi: 10.1002/cssc.201601637
N. Wang, Q.M. Sun, R.S. Bai, et al., J. Am. Chem. Soc. 138 (2016) 7484–7487. doi: 10.1021/jacs.6b03518
H. Dai, B. Xia, L. Wen, et al., Appl. Catal. B 165 (2015) 57–62. doi: 10.1016/j.apcatb.2014.09.065
P. Stathi, M. Louloudi, Y. Deligiannakis, Energy Fuels 30 (2016) 8613–8622. doi: 10.1021/acs.energyfuels.6b01729
Y. Zhao, L. Deng, S.Y. Tang, et al., Energy Fuels 25 (2011) 3693–3697. doi: 10.1021/ef200648s
M. Martis, K. Mori, K. Fujiwara, W.S. Ahn, H. Yamashita, J. Phys. Chem. C 117 (2013) 22805–22810. doi: 10.1021/jp4069027
X. Wang, Q.L. Meng, L.Q. Gao, et al., Int. J. Hydrogen Energy 44 (2019) 28402–28408. doi: 10.1016/j.ijhydene.2019.05.083
Q. Wang, N. Tsumori, M. Kitta, Q. Xu, ACS Catal. 8 (2018) 12041–12045. doi: 10.1021/acscatal.8b03444
Z.H. Xing, Z.L. Guo, X.Y. Chen, P. Zhang, W.S. Yang, Catal. Sci. Technol. 9 (2019) 588–592. doi: 10.1039/C8CY02402B
Q. Lv, Q.L. Meng, W.W. Liu, et al., J. Phys. Chem. C 122 (2018) 2081–2088. doi: 10.1021/acs.jpcc.7b08105
J.J. Li, W. Chen, H. Zhao, et al., J. Catal. 352 (2017) 371–381. doi: 10.1016/j.jcat.2017.06.007
S. Zhang, B. Jiang, K. Jiang, W.B. Cai, ACS Appl. Mater. Interfaces 9 (2017) 24678–24687. doi: 10.1021/acsami.7b08441
M. Shao, A. Peles, K. Shoemaker, Nano Lett. 11 (2011) 3714–3719. doi: 10.1021/nl2017459
K.J.J. Mayrhofer, B.B. Blizanac, M. Arenz, et al., J. Phys. Chem. B 109 (2005) 14433–14440. doi: 10.1021/jp051735z
M.H. Wu, Z.B. Zhang, X.Z. Xu, et al., Nature 581 (2020) 406–410. doi: 10.1038/s41586-020-2298-5
Q. Zhu, N. Tsumori, Q. Xu, Chem. Sci. 5 (2014) 195–199. doi: 10.1039/C3SC52448E
Y.L. Qin, J. Wang, F.Z. Meng, L.M. Wang, X.B. Zhang, Chem. Commun. 49 (2013) 10028–10030. doi: 10.1039/c3cc46248j
S.L. Zhang, S.J. Li, J.Y. Wang, et al., Int. J. Hydrogen Energy 46 (2021) 34727–34736. doi: 10.1016/j.ijhydene.2021.08.063

Figure 1 (a) X-ray photoelectron spectroscopy (XPS) graphic of Pd 3d for these four catalysts with peak fitting of the Pd(Ⅱ) and Pd(0), and (b) X-ray diffraction (XRD) graphic of these four catalysts with PDF card.

Figure 2 CO-stripping test of the series of Pd/C catalysts (a) Pd/C-Li, (b) Pd/C-Na, (c) Pd/C-Ca, (d) Pd/C-Ba at a scan rate of 20 mV/s, along with CO oxidation peak and the oxidation charge for counting surface sites.

Figure 3 (a) Time course of reforming gas from 5 mL 1.1 mol/L formic acid and 0.8 mol/L sodium formate by carrying out the catalytic reaction over 20 mg of these catalysts at 303 K. (b) TOF and comparation deviation calculated by the performance between 100 min to 120 min with normalizing the time course of gas by the num of the surface sites shown in illustration.
Table 1. Comparation of TOF between catalysts in this work with different catalysts in literature.
|
|
 下载: 导出CSV

 扫一扫看文章

扫一扫关注我们