Scheme 1.
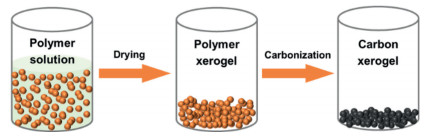
Schematic illustration of the fabrication procedure for the NO-CX catalyst, which is simple, low-cost, and efficient in producing highly active carbon catalysts towards H2O2 production.
N, O-coupling towards the selectively electrochemical production of H2O2
Shuaishuai Xu , Yang Gao , Tao Liang , Lipeng Zhang , Bin Wang

Hydrogen peroxide (H2O2) is an important and environmentally friendly oxidant [1, 2]. It has found a wide range of applications in medical disinfection, pulp and textile bleaching, wastewater treatment, chemical synthesis, and semiconductor cleaning [3, 4]. The production methods of H2O2 include the anthraquinone (AQ) process, direct synthesis, and electrochemical production. The current industrial synthesis of H2O2 is carried out by the AQ process, which accounts for 95% of H2O2 production [5]. However, it involves a series of hydrogenation and oxidation steps in organic solvents, followed by extraction and distillation to obtain a concentrated solution of H2O2. This process is associated with considerable energy consumption and requires large infrastructures [6]. In addition, large-scale centralized production involves additional transportation to the place of use. Direct synthesis of H2O2 with the aid of catalysts is possible to solve these problems, which requires catalysts with high activity and selectivity and involves a mixture of H2 and O2, which has a risk of explosion [7].
Differing from the above-mentioned methods, electrochemical production provides a green, economical, safe, and environmentally friendly way to prepare H2O2 via the cathode reduction of O2. However, it is a complex process, for example, the oxygen reduction reaction (ORR) can produce H2O via the 4e− pathway (O2 + 4H+ + 4e− → 2H2O), or desired H2O2 via the 2e− pathway (O2 + 2H+ + 2e− → H2O2) [1, 3]. Therefore, it requires the promotion of the 2e− ORR pathway and prevention of the decomposition of H2O2. Noble metals and their alloys (such as Au [8], Au-Pd [9], Pt-Hg [10] and Pd-Hg [11]) are the most effective catalysts for the electrochemical production of H2O2 due to their low overpotential and high H2O2 selectivity. However, the high cost and low reserves of precious metals limit the large-scale application [12].
Carbon-based nanomaterials have been considered as promising alternative electrocatalysts for the electrochemical production of H2O2 due to their abundant earth reserves, flexible tunable structures, and high electrochemical stability [13-15]. Extensive efforts have been devoted to the development of carbon-based electrocatalysts such as carbon nanotubes (CNTs) [16, 17], graphene [18], carbon black [19, 20], ordered mesoporous carbon [21], and heteroatom-doped carbons [22-26]. For example, Cui et al. found that the carbon atoms adjacent to oxygen functional groups (such as C–O–C) can serve as the active sites for the 2e− ORR pathway [16]. In another representative work, Baek et al. reported that quinone-enriched carbon materials exhibited high selectivity and activity for H2O2 production [27]. However, these classic works mainly focus on the effect of oxygen-related sites on catalytic performance and the dual-doping effect has rarely been investigated. Furthermore, it is still challenging to obtain carbon-based electrocatalysts with both high activity and selectivity at a low cost for the electrochemical production of H2O2.
To prepare highly active carbon catalysts for the electrochemical production of H2O2 at a low cost, we propose a simple but efficient method to prepare an N, O co-doped carbon-based catalyst (N, O co-doped carbon xerogel, NO-CX) using the widely used polyacrylonitrile (PAN) as the precursor. The NO-CX catalyst exhibits both high activity and selectivity, especially delivering greater than 90% H2O2 selectivity over a potential range of 0.2–0.6 V and a high H2O2 productivity of 1410 mmol gcat−1 h−1. Furthermore, the density functional theory calculations reveal that N, O-coupling can effectively induce the redistribution of surface charge and lower the thermodynamic energy barrier of the 2e− ORR pathway, suggesting the cooperative effect brought by the additional nitrogen atom.
The NO-CX catalyst was prepared by high-temperature pyrolysis as shown in Scheme 1. Briefly, 0.6 g PAN and 0.5 g dicyandiamide were added to 9 mL DMF and stirred for 12 h to form a homogeneous solution. The solution was then dried in an oven at 60 ℃ for 48 h to obtain a PAN-based polymer xerogel. Subsequently, the obtained PAN-based polymer xerogel was annealed using a tube furnace in an Ar atmosphere. The sample was first annealed at 550 ℃ with a heating rate of 2 ℃/min and maintained for 4 h. The temperature was then increased to 1000 ℃ at a rate of 5 ℃/min and held for 1 h before cooling. Finally, the NO-CX catalyst was obtained. As a control, the N, O co-doped carbon particle (NO-CP) catalyst was obtained under the same carbonization conditions as above. The difference here was that 0.6 g PAN and 0.5 g dicyandiamide were mixed evenly by grinding them in a mortar, instead of in solution.
Scanning electron microscopy (SEM) images were acquired from a Hitachi S4800 field-emission SEM system. Transmission electron microscopy (TEM), high-angle annular dark-field scanning TEM (HAADF-STEM), and element mapping images were acquired from field-emission TEM (FEI Tecnai G2 F20 U-TWIN). The Fourier transform infrared (FT-IR) spectra were recorded on a Perkin-Elmer Spectrum One spectrometer. The N2 adsorption/desorption isotherms were measured on an ASAP 2020 physisorption analyzer. The Brunauer–Emmett–Teller (BET) method and the non-local density functional theory (NLDFT) pore model were used to analyze the specific surface area and pore size distribution, respectively. Raman spectra were collected from a Renishaw inVia Raman microscope. X-ray photoelectron spectroscopy (XPS) measurements were carried out on an ESCALAB250Xi apparatus with an Al Kα X-ray source and all the binding energy was calibrated according to the C 1s peak of 284.6 eV.
All electrocatalytic measurements were performed in a three-electrode cell using a Bio-logic VMP potentiostat workstation at ambient temperature. A rotating ring-disk electrode (RRDE, PINE Research Instrumentation) with a glassy carbon electrode (0.2475 cm2 area) and a Pt ring electrode was used as the working electrode. A Pt foil (1 cm2) was used as the counter electrode (CE) and an Ag/AgCl (Saturated KCl) electrode was selected as the reference electrode (RE). All potentials in this study were referred to RHE, E(RHE) = E(Ag/AgCl) + 0.059 pH + 0.199. All of the potentials were 95% iR corrected. To prepare the catalyst ink, 2.5 mg of catalyst was dispersed in 1.04 mL of solution containing 0.6 mL of ethanol, 0.4 mL of water, and 40 µL of 5 wt% Nafion solution, followed by ultrasonication for 60 min to form a homogeneous ink. Then, 10 µL of the catalyst ink was pipetted onto the glassy carbon electrode and dried at room temperature. The catalyst loading was about 0.10 mg/cm2. The electrocatalytic measurements were performed in an O2-saturated 0.1 mol/L KOH electrolyte. RRDE measurements were carried out by linear sweep voltammetry (LSV) at a scan rate of 10 mV/s at 1600 rpm while holding the potential of the Pt ring electrode at 1.2 V. During the stability test, the electrolyte was replaced with fresh O2-saturated 0.1 mol/L KOH solution every 2.5 h to suppress the interference from the accumulated H2O2 in the electrolyte. The H2O2 selectivity was calculated using the equation: H2O2 (%) = 200 × (Ir/N)/(Id + Ir/N), and the electron transfer number (n) at the disk electrode was calculated using n = 4 × Id/(Id + Ir/N), where Ir is the ring current, Id is the disk current, and N is the collection efficiency (0.37).
The production of H2O2 was performed in an H-type electrolyzer with Nafion 117 membrane as a separator. The NO-CX catalyst was coated on a piece of carbon paper with a mass loading of 0.1 mg/cm2 to serve as the working electrode (WE). The polarization curves were obtained by the LSV method at a scan rate of 50 mV/s. The chronopotentiometry test was carried out under a constant current density of 10 mA/cm2 to evaluate the long-term stability of catalysts.
The H2O2 yields in the electrolytes were determined by the cerium sulfate Ce(SO4)2 titration method. The yellow-colored Ce4+ would be transformed into the colorless Ce3+ when reduced by H2O2 according to Eq. 1. Then, the concentration of Ce4+ can be determined by ultraviolet-visible spectroscopy.
|
|
(1) |
Therefore, the concentration of H2O2 (M) was calculated by the following Eq. 2:
|
|
(2) |
where M(Ce4+) is the mole of consumed Ce4+.
All the calculations were conducted using the Vienna ab initio simulation package (VASP) [28, 29] based on density functional theory (DFT) [30] and the projector-augmented wave (PAW) [31, 32] method. The electronic exchange and correlation effects were described by the generalized-gradient approximation (GGA) with the Perdew-Burke-Ernzerhof (PBE) functional [33]. To ensure the convergence for the total energy, a plane-wave cutoff energy of 450 eV with Fermi-level smearing of 0.05 eV was used. The Brillouin zone was sampled with Monkhorst-Pack k-point meshes of 4 × 1 × 1. The spin-polarization and van der Waals corrections [34] were used in all the calculations. Besides, geometry optimizations were performed until the force of the system converges to 0.02 eV/Å and the energies were converged within 10–5 eV. All the nanoribbons were built as three-dimensional periodic structures, and vacuum layers were set around 16 and 20 Å in the y- and z-directions, respectively.
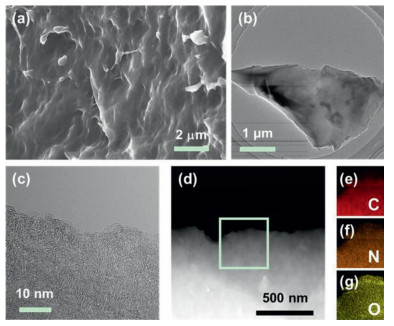
The morphology of the N, O co-doped carbon-based catalysts was first characterized using SEM and TEM (Figs. 1a-c and Fig. S1 in Supporting information). An irregular particle with a rough surface is observed, which shows a turbostratic graphitic structure formed during the carbonization process. Obviously, there are several characters we can see from the images: since there is no metal involved during the preparation process, we could establish a clear relationship between the carbon structure and its catalytic performance without affecting by the potential trace metals that usually exist in carbon nanotubes; the rough surface endows the carbon with a surface area of 371 m2/g as tested and shown in the following text, which increases the efficient area for catalytic reactions. Moreover, the HAADF-STEM image and its corresponding element distribution images show that C, N, and O elements are uniformly distributed in the NO-CX catalyst (Figs. 1d-g), demonstrating the successful dual-doping of the carbon materials.
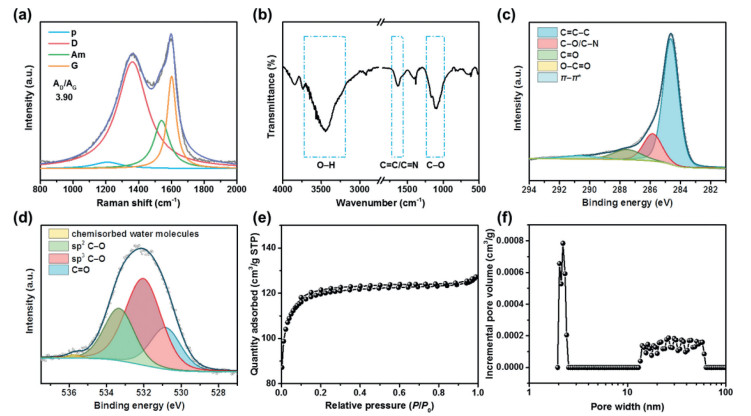
Further characterization was conducted to investigate the structural and chemical features of NO-CX. As shown in Fig. 2a, the Raman spectrum of NO-CX was deconvoluted into four peaks at 1210, 1360, 1540, and 1600 cm−1, which correspond to p, D, Am, and G bands, respectively. The D band is usually related to the defects in graphitic carbon, while the G band is a characteristic feature of graphitic carbon [35, 36]. The area ratio of the D to G band (AD/AG) of NO-CX is 3.90, indicating a turbostratic carbon-dominated feature that corresponds to the observation in the HRTEM image. As shown in Fig. 2b, the FT-IR spectrum of NO-CX shows a broad peak at around 3450 cm−1, which corresponds to the O–H stretching mode. The absorption peak at 1630 cm–1 is ascribed to the C=C/C=N stretching vibration, while the peaks at 1096 and 1171 cm–1 are attributed to C–O stretching vibrations of C–O–C and C–O–H, respectively. The surface chemical feature of the NO-CX catalyst was further investigated using XPS. The XPS spectrum of C 1s (Fig. 2c) was fitted into five peaks, which are assigned to C=C—C (286.4 eV), C—O/C—N (285.8 eV), C=O (287.5 eV), O—C=O (289.2 eV), and π-π* satellite peak (290.6 eV). The O 1s XPS spectrum of NO-CX was deconvoluted into four chemical forms, which correspond to C=O (530.8 eV), sp3 C—O (532.0 eV), sp2 C—O (533.3 eV), and chemisorbed water molecules (535.7 eV) (Fig. 2d). XPS data reveal that C—O is the main chemical state of oxygen, which is in accord with the result of the FT-IR spectrum. The N 1s XPS spectrum was deconvoluted into four nitrogen species, including pyridinic N (398.3 eV), pyrrolic N (399.6 eV), graphitic N (400.9 eV), and oxidic N (402.6 eV) (Fig. S2 in Supporting information). Furthermore, N2 adsorption/desorption measurement was performed to study the pore structure of NO-CX. As displayed in Fig. 2e, N2 adsorption/desorption isotherms of NO-CX exhibit a small hysteresis loop, suggesting the presence of mesopore. The NLDFT pore size distribution curve (Fig. 2f) demonstrates that the NO-CX catalyst has a hierarchical porous structure. The as-obtained surface area of 371 m2/g and the N, O-co-doping are desirable to the electrochemical production of H2O2.
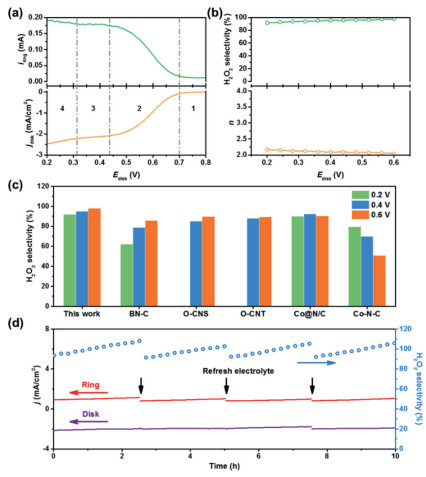
To investigate the electrocatalytic activity and selectivity of the NO-CX sample during the electrochemical production of H2O2, linear sweep voltammetry (LSV) was conducted on a rotating ring-disk electrode (RRDE) at 1600 rpm in an O2-saturated 0.1 mol/L KOH solution. The ring electrode was held at 1.2 V to oxidize the H2O2 generated at the disk electrode. Fig. 3a shows the oxygen reduction current at the disk electrode and the synchronously detected H2O2 generation ring current for the NO-CX catalyst with a mass loading of ~0.1 mg/cm2. As shown in Fig. 3b, the H2O2 selectivity and electron transfer numbers (n) were plotted against the applied disk potential. The NO-CX catalyst shows high selectivity to H2O2, especially delivering greater than 90% H2O2 selectivity over a potential range of 0.2–0.6 V. It is noteworthy that the selectivity of NO-CX is superior to recently reported carbon-based electrocatalysts, such as B, N co-doped porous carbon (BN-C) [37], O-doped carbon nanosheet (O-CNS) [36], and oxidized CNTs (O-CNT) [16], and even surpasses some metal-based electrocatalysts including Co nanoparticles supported on N-doped carbon (Co@N/C) [38] and Co-N-C [39] catalysts (Fig. 3c), indicating its excellent electrochemical performance for H2O2 generation. To deeply analyze the electrochemical behavior of NO-CX in the electrochemical production of H2O2, the LSV curves (Fig. 3a) were divided into four regions. In the kinetic-controlled region (Region 1), the reaction rate of ORR is kinetically controlled, and the disk current and ring current increase slightly with the decrease of the disk potential. Subsequently, in the mixed kinetic-diffusion controlled region (Region 2), both the disk current and ring current rapidly increase as the disk potential decreases, indicating that the reduction of oxygen and the generation of H2O2 accelerate simultaneously. The standard electrode potential of the 2e− ORR pathway at pH 13 is 0.691 V vs. RHE, which corresponds to the initial potential of disk and ring currents. In the diffusion-controlled area (Region 3), a small current platform appears at the disk current and could be seen as mainly originating from 2e−ORR. When the potential further decreases to Region 4, the further reduction of H2O2 in the disk electrode leads to the increase of disk current and the decrease of H2O2 selectivity. Furthermore, the operational stability of NO-CX was also conducted on RRDE. Fig. 3d demonstrates that both the disk current and ring current are stable and the H2O2 selectivity can hold above 90% during the 10 h operation. It should be noted that the ring current and H2O2 selectivity exhibit an increasing trend, which is derived from the gradual accumulation of generated H2O2 in the electrolyte and subsequently the reduction of H2O2 in the Pt ring electrode during operation. After replacing the electrolyte with fresh O2-saturated 0.1 mol/L KOH solution, the H2O2 selectivity can be recovered, indicating the good stability of NO-CX.
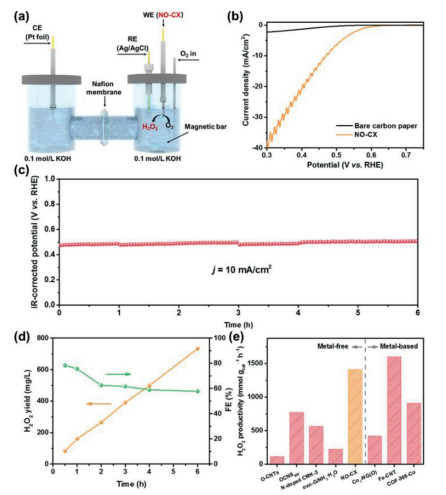
To evaluate the H2O2 production performance of catalysts in real devices, we coated NO-CX on carbon paper (mass loading: 0.1 mg/cm2) and tested it in an H-type electrochemical cell (Fig. 4a). Fig. 4b shows the catalytic performance of NO-CX during bulk electrolysis. The long-term stability test was performed using the chronopotentiometry method at a fixed current density of 10 mA/cm2 for 6 h (Fig. 4c) and cerium sulfate titration was used to quantify the amount of produced H2O2. As observed in Fig. 4d, the H2O2 yield of NO-CX linearly increases with the operation time, suggesting the constant production of H2O2. The Faraday efficiency (FE) of H2O2 production achieves a maximum value of 78.3% at the initial 0.5 h and subsequently decreases, which can be attributed to the accelerated reduction rate of peroxide with the H2O2 accumulation and the decomposition of H2O2 in an alkaline electrolyte over time [40]. As shown in Fig. 4e, NO-CX shows a H2O2 productivity of 1410 mmol gcat−1 h−1, which is superior to many recently reported metal-free electrocatalysts and even comparable to the metal-based electrocatalyst (Table S1 in Supporting information), indicating its excellent H2O2 production activity.
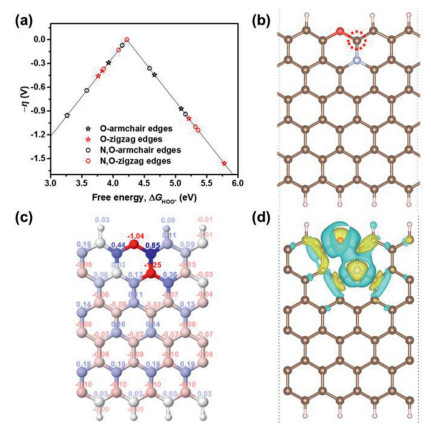
Although it is still challenging to determine the exact atomic structure of NO-CX from current experimental techniques, DFT calculations provide a powerful tool to investigate the catalytic mechanism of NO-CX in the electrochemical production of H2O2. As shown in Fig. S3 (Supporting information), molecular models of O-doped graphene nanoribbons with armchair or zigzag edges were constructed by considering four types of oxygen-containing functional groups such as carboxyl, ether, carbonyl, and hydroxyl groups. By introducing N atoms to the sites adjacent to C atoms next to the oxygen-containing functional groups, the molecular models of N, O co-doped graphene nanoribbons were obtained (Fig. S4 in Supporting information). In these molecular models, the dominant nitrogen species are pyridinic N and graphitic N, which is in accord with the N 1s XPS spectrum of NO-CX (Fig. S2). Fig. 5a shows the volcano plot of O-doped and N, O co-doped graphene networks in the electrochemical production of H2O2 by using the adsorption Gibbs free energy of HOO (∆GHOO*) as a descriptor. The overpotential of H2O2 generation shows an obvious decrease after introducing N atoms into O-doped graphene structures, and the minimum overpotential is only 0.001 V, indicating the effectiveness of N, O-coupling. The most active site as labeled on the N, O co-doped graphene shown in Fig. 5b locates at the edge C site adjacent to an ether group and a graphitic N atom as modulated in our calculations. To further understand the origin of the most active site on the optimum N, O co-doped graphene structure, the electronic properties of this structure are calculated. As shown in Fig. 5c, the Bader charge distribution reveals that the edge C atom adjacent to the co-doped N and O atoms has a positive charge (0.85), which can facilitate the adsorption of HOO [41]. In addition, the differential charge density distribution of N, O co-doped graphene is displayed in Fig. 5d. With the incorporation of N and O atoms into the graphene structure, the interaction of N and O atoms induces the redistribution of surface charge and generates the most active site with a negligible overpotential. Although defects are not considered in the modeling, they unavoidably exist in the carbon materials obtained by pyrolyzing polymers and have been reported with a positive impact on the catalytic performance [42]. Works focusing on the identification of active defect structures may further promote the catalytic properties of carbon catalysts, but it is beyond the capability of this xerogel material system because the preparation of control carbons with identified defect type, number, and distribution is very challenging.
Apart from the chemical features above-mentioned, the pore structure of N, O co-doped carbon also matters. As a comparison, we prepared N, O co-doped carbon particles (NO-CP) by directly mixing PAN and dicyandiamide, followed by carbonization (Fig. S5 in Supporting information). As shown in Figs. S6-S8 (Supporting information) and Table S2 (Supporting information), the NO-CP catalyst shows an approximate AD/AG value, similar elemental composition, and similar chemical binding forms with NO-CX, indicating their similar graphitic structure and chemical features. However, the NO-CP catalyst only has a BET-specific surface area of 14.6 m2/g (Fig. S9 in Supporting information), which is much lower than that of NO-CX (371 m2/g). In terms of electrocatalytic performance, the NO-CP catalyst delivers a lower H2O2 selectivity than NO-CX (Fig. S10 in Supporting information), which can be attributed to the difference in pore structure and reveals the importance of structural design for electrocatalytic performance.
In summary, this work provided a low-cost but efficient way to prepare a highly selective carbon catalyst for H2O2 production; in the meantime, the effect of N, O-coupling is demonstrated experimentally and theoretically. The obtained catalyst exhibited a high H2O2 selectivity of 98% at 0.6 V, greater than 90% H2O2 selectivity over a potential range of 0.2–0.6 V, and a high H2O2 production rate of 1410 mmol gcat−1 h−1, indicating its excellent electrocatalytic performance for H2O2 electrocatalysis. Based on DFT calculations, we could ascribe the origin of the high activity to the coupling effect between N and O atoms, which can effectively induce the redistribution of surface charge and generate the active edge C site adjacent to an ether group and a graphitic N atom. This work may shed light on the design and preparation of highly efficient carbon-based electrocatalysts through simple synthetic approaches for the electrochemical production of H2O2.
The authors declare that they have no known competing financial interests or personal relationships that could have appeared to influence the work reported in this paper.
The authors acknowledge the National Natural Science Foundation of China (No. 52073020) and the China Postdoctoral Science Foundation Funded Project (No. 2021M690801).
Supplementary material associated with this article can be found, in the online version, at doi:10.1016/j.cclet.2022.01.057.
S.C. Perry, D. Pangotra, L. Vieira, et al., Nat. Rev. Chem. 3 (2019) 442–458. doi: 10.1038/s41570-019-0110-6
Y. Sun, L. Han, P. Strasser, Chem. Soc. Rev. 49 (2020) 6605–6631. doi: 10.1039/D0CS00458H
S. Yang, A. Verdaguer-Casadevall, L. Arnarson, et al., ACS Catal. 8 (2018) 4064–4081. doi: 10.1021/acscatal.8b00217
M. Melchionna, P. Fornasiero, M. Prato, Adv. Mater. 31 (2019) 1802920. doi: 10.1002/adma.201802920
Y. Yi, L. Wang, G. Li, H. Guo, Catal. Sci. Technol. 6 (2016) 1593–1610. doi: 10.1039/C5CY01567G
J.M. Campos-Martin, G. Blanco-Brieva, J.L. Fierro, Angew. Chem. Int. Ed. 45 (2006) 6962–6984. doi: 10.1002/anie.200503779
J.K. Edwards, S.J. Freakley, A.F. Carley, C.J. Kiely, G.J. Hutchings, Acc. Chem. Res. 47 (2014) 845–854. doi: 10.1021/ar400177c
Y. Lu, Y. Jiang, X. Gao, W. Chen, Chem. Commun. 50 (2014) 8464–8467. doi: 10.1039/C4CC01841A
J.S. Jirkovsky, I. Panas, E. Ahlberg, et al., J. Am. Chem. Soc. 133 (2011) 19432–19441. doi: 10.1021/ja206477z
S. Siahrostami, A. Verdaguer-Casadevall, M. Karamad, Nat. Mater. 12 (2013) 1137–1143. doi: 10.1038/nmat3795
A. Verdaguer-Casadevall, D. Deiana, M. Karamad, et al., Nano Lett. 14 (2014) 1603–1608. doi: 10.1021/nl500037x
B. Wang, X. Cui, J. Huang, R. Cao, Q. Zhang, Chin. Chem. Lett. 29 (2018) 1757–1767. doi: 10.1016/j.cclet.2018.11.021
Y. Bu, Y. Wang, G.F. Han, et al., Adv. Mater. (2021) 2103266.
L. Chen, X. Xu, W. Yang, J. Jia, Chin. Chem. Lett. 31 (2020) 626–634. doi: 10.1016/j.cclet.2019.08.008
P.C. Shi, J.D. Yi, T.T. Liu, et al., J. Mater. Chem. A 5 (2017) 12322–12329. doi: 10.1039/C7TA02999C
Z.Y. Lu, G.X. Chen, S. Siahrostami, et al., Nat. Catal. 1 (2018) 156–162. doi: 10.1038/s41929-017-0017-x
A. Yu, G. Ma, L. Zhu, et al., Nanoscale 13 (2021) 15973–15980. doi: 10.1039/D1NR04176B
H.W. Kim, M.B. Ross, N. Kornienko, et al., Nat. Catal. 1 (2018) 282–290. doi: 10.1038/s41929-018-0044-2
K.H. Wu, D. Wang, X. Lu, et al., Chem 6 (2020) 1443–1458. doi: 10.1016/j.chempr.2020.04.002
E. Murawski, N. Kananizadeh, S. Lindsay, A.M. Rao, S.C. Popat, J. Power Sources 481 (2021) 228992. doi: 10.1016/j.jpowsour.2020.228992
Y.L. Wang, S.S. Li, X.H. Yang, et al., J. Mater. Chem. A 7 (2019) 21329–21337. doi: 10.1039/C9TA04788C
F. Hasché, M. Oezaslan, P. Strasser, T.P. Fellinger, J. Energy Chem. 25 (2016) 251–257. doi: 10.1016/j.jechem.2016.01.024
L. Han, Y. Sun, S. Li, et al., ACS Catal. 9 (2019) 1283–1288. doi: 10.1021/acscatal.8b03734
J.S. Lim, J.H. Kim, J. Woo, et al., Chem 7 (2021) 1–17. doi: 10.1016/j.chempr.2020.12.021
J.J. Xu, C.H. Xiao, S.J. Ding, Chin. Chem. Lett. 28 (2017) 748–754. doi: 10.1016/j.cclet.2016.12.006
K. Dong, J. Liang, Y. Wang, et al., Angew. Chem. Int. Ed. 60 (2021) 10583–10587. doi: 10.1002/anie.202101880
G.F. Han, F. Li, W. Zou, et al., Nat. Commun. 11 (2020) 2209. doi: 10.1038/s41467-020-15782-z
G. Kresse, J. Hafner, Phys. Rev. B 47 (1993) 558–561. doi: 10.1103/PhysRevB.47.558
G. Kresse, J. Furthmüller, Phys. Rev. B 54 (1996) 11169–11186. doi: 10.1103/PhysRevB.54.11169
P. Hohenberg, W. Kohn, Phys. Rev. 136 (1964) B864–B871. doi: 10.1103/PhysRev.136.B864
P.E. Blöchl, Phys. Rev. B 50 (1994) 17953–17979. doi: 10.1103/PhysRevB.50.17953
G. Kresse, D. Joubert, Phys. Rev. B 59 (1999) 1758–1775.
J.P. Perdew, K. Burke, M. Ernzerhof, Phys. Rev. Lett. 77 (1996) 3865–3868. doi: 10.1103/PhysRevLett.77.3865
S. Grimme, J. Comput. Chem. 27 (2006) 1787–1799. doi: 10.1002/jcc.20495
H. Yu, L. Shang, T. Bian, et al., Adv. Mater. 28 (2016) 5080–5086. doi: 10.1002/adma.201600398
S. Chen, T. Luo, K. Chen, et al., Angew. Chem. Int. Ed. 60 (2021) 16607–16614. doi: 10.1002/anie.202104480
S. Chen, Z. Chen, S. Siahrostami, et al., J. Am. Chem. Soc. 140 (2018) 7851–7859. doi: 10.1021/jacs.8b02798
J. Wu, A. Mehmood, G. Zhang, et al., ACS Catal. 11 (2021) 5035–5046. doi: 10.1021/acscatal.0c05701
B.Q. Li, C.X. Zhao, J.N. Liu, Q. Zhang, Adv. Mater. 31 (2019) 1808173. doi: 10.1002/adma.201808173
Y. Sun, L. Silvioli, N.R. Sahraie, et al., J. Am. Chem. Soc. 141 (2019) 12372–12381. doi: 10.1021/jacs.9b05576
N. Yang, L. Li, J. Li, W. Ding, Z. Wei, Chem. Sci. 9 (2018) 5795–5804. doi: 10.1039/C8SC01801D
Z. Wang, Q.K. Li, C. Zhang, et al., ACS Catal. 11 (2021) 2454–2459. doi: 10.1021/acscatal.0c04735

Scheme 1 Schematic illustration of the fabrication procedure for the NO-CX catalyst, which is simple, low-cost, and efficient in producing highly active carbon catalysts towards H2O2 production.

Figure 1 The morphology and component characterization of the NO-CX catalyst. (a) SEM, (b) TEM, (c) HRTEM, and (d) HAADF-STEM images of NO-CX. (e-g) EDS mapping images of C, N, and O for NO-CX, respectively.

Figure 2 Structural characterization of the NO-CX catalyst. (a) Raman spectrum, (b) FT-IR spectrum, (c) C 1s and (d) O 1s XPS spectra, (e) N2 adsorption/desorption isotherms, and (f) pore size distribution curve of NO-CX.

Figure 3 Electrochemical tests of NO-CX as the catalyst for synthesizing H2O2. (a) LSV curves of disk electrode and ring electrode in O2-saturated 0.1 mol/L KOH solution for NO-CX. (b) The n and H2O2 selectivity of NO-CX as a function of the disk potential. (c) The H2O2 selectivity of NO-CX and reference catalysts at different potentials. (d) Stability test of NO-CX at a fixed disk potential of 0.3 V. The electrolyte was refreshed every 2.5 h to remove the accumulated H2O2 in the electrolyte.

Figure 4 H2O2 production performance of NO-CX in the H-type electrolyzer. (a) Schematic illustration of the H-type electrolyzer. (b) IR-corrected polarization curve of NO-CX in an H-cell electrolyzer. (c) Chronopotentiometry curve of NO-CX at a fixed current density of 10 mA/cm2 in O2-saturated 0.1 mol/L KOH solution. (d) H2O2 yield and FE of NO-CX as a function of time at the stability test of (c). (e) Comparison of H2O2 productivity on NO-CX and other recently reported electrocatalysts.

Figure 5 Theoretical simulation of the N, O-coupling effect on the electrochemical production of H2O2 in a carbon skeleton. (a) The volcano plot of overpotential η versus ΔGHOO* for the electrochemical production of H2O2. (b) The structure of N, O co-doped graphene nanoribbon with the best activity. The brown, pink, blue, and red balls denote C, H, N, and O atoms, respectively. (c) Bader charge distribution and (d) differential charge density distribution of N, O co-doped graphene. For the Bader charge distribution, the color of balls represents the value of the Bader charge, which increases gradually from red to blue. For the differential charge density distribution, yellow and blue isosurfaces show electron gain and electron loss, respectively. The isosurface level of (d) is 0.02 e/Å3.

 扫一扫看文章

扫一扫关注我们
 DownLoad:
 下载:
下载: