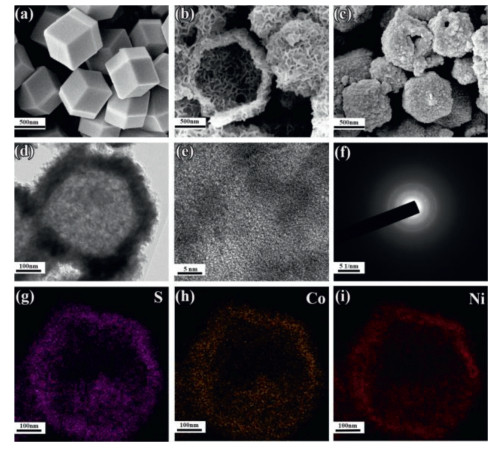
Figure 1.
SEM images of (a) ZIF-67, (b) Ni-Co LDH and (c) Am-NCS. (d, e) TEM and HRTEM images of Am-NCS. (f) SAED image of Am-NCS. (g-i) The elemental mappings of Am-NCS.
Amorphous Ni-Co-S nanocages assembled with nanosheet arrays as cathode for high-performance zinc ion battery
Na Li , Guangmeng Qu , Xixi Zhang , Shunshun Zhao , Chenggang Wang , Gang Zhao , Peiyu Hou , Xijin Xu

The lithium-ion batteries are famous for high energy density and long cycling life which currently dominate the commercial secondary battery market including consumer electronics, electric vehicles and aerospace applications [1-4]. However, flammable organic electrolytes and rare lithium resources limit their wide applications. Recently, aqueous batteries have attracted intense interests because of their inherent safety and low cost, especially for low reduction potential of alkaline zinc anode (−1.2 V vs. SHE), which is emerging as one of the most promising alternatives to electrochemical energy storage [5]. In addition, the ionic conductivity of aqueous electrolyte (~1 S/cm) is much higher than that of non-aqueous electrolyte (~1–10 mS/cm), which endows the battery with an outstanding rate capability [6-8].
Zn//Ni alkaline zinc batteries have many advantages, such as outstanding power density, high discharge voltage platform and environmental friendliness. Nowadays, Ni(OH)2 and NiO are mostly used as active cathode materials in alkaline zinc batteries [9, 10]. However, the poor stability, unsatisfactory conductivity and volume expansion limit their wide applications. Many ways, including constructing multi-shell nanostructures, one-dimensional nanoarrays or 3D skeleton structures, have been used to solve the volume expansion for high-performance Ni-based cathode materials [11-13]. The assembly of vertically arranged nanoarrays with many gaps facilitates the diffusion of ions and the full contact between the electrode material and the electrolyte. Besides, the amorphous phase provides larger proportion of random alignment bonds in the unsaturated electronic configuration than the crystal, which facilitates the adsorption of the reactants [14-17]. Furthermore, the amorphous structure accelerates the charge transfer between the active center and the reaction intermediate. Bovine et al. synthesized MOF-derived amorphous V2O5 and carbon (a-V2O5@C) composites, where amorphous V2O5 is uniformly distributed in the carbon framework [18]. The amorphous structure endows V2O5 more isotropic Zn2+ diffusion pathways and active sites, which leads to the rapid migration and high specific capacity of Zn2+ and remarkable electrochemical properties of a-V2O5@C composite. What is more, nickel/cobalt sulfides have the advantages of high theoretical capacitance, abundant raw materials and environment-friendly as well as high intrinsic conductivity [19-21].
Herein, we successfully designed and synthesized hollow Am-NCS nanocages (abbreviated as Am-NCS in short) by ion exchange method with ZIF-67 as the self-template [22-24]. On one hand, the amorphous structure of synthesized Am-NCS not only accelerates the charge transfer but also have the isotropic OH− diffusion pathways, further enhancing the rate performance. On the other hand, nanosheets-assembled hollow structures alleviate the volume expansion during the intercalated process of OH-, as well as providing large electrolyte contact areas, thus increasing specific capacity and cycling stability [25-28]. Therefore, the synthesized Am-NCS deliver a high capacity of 160 mAh/g at 2 A/g with excellent rate performance of 130 mAh/g at 20 A/g. The energy density of the as-prepared Am-NCS//Zn battery is up to 254.2 Wh/kg with a highest power density of 3.28 kW/kg. What is more, the long cycle stability could be reached 7000 cycles, even at a high current density of 10 A/g, illustrating the high stability of Am-NCS//Zn battery.
Methylimidazole (2-mIM), methanol, ethanol, Ni(NO3)2·6H2O, Co(NO3)2·6H2O, KOH are supplied by Aladdin Reagent Company (China). The morphologies and microstructures of the materials were observed by field emission scanning electron Microscope (QUANTA 250 FEG) and transmission electron microscope (JEOL JEM-2100F). The chemical states were characterized by C-ray photoelectron spectroscopy (XPS) with X-ray energy dispersive spectrometer (XPS). The Raman spectra of the materials were measured by HORIBA LabRAM HR 800 under 514 nm excitation light source. The electrochemical measurements were carried out on CHI660 electrochemical workstation.
All reagents are used directly without further purification. 1 mmol (0.291 g) of Co(NO3)2·6H2O was dissolved in 25 mL of methanol to obtain solution A, and 4 mmol of 2-methylimidazole (0.328 g) was dissolved in 25 ml of methanol to obtain solution B. Solution B was poured into solution A and stirred continuously for 1 hour and stand at room temperature for 24 h. Then it was centrifuged and washed several times with methanol to obtain a purple precipitate, which was dried at 60 ℃ for 12 h in vacuum.
Synthesis of Ni-Co layered double hydroxides (Ni-Co LDH): 76 mg ZIF-67 was dispersed into 10 mL of ethanol to obtain solution C with continuously stirred and ultrasound assisted. 0.152 g of Ni(NO3)2·6H2O was dissolved into 50 mL of ethanol to obtain solution D. Solution C was mixed with solution D and stirred continuously for 1 h. Then it was centrifuged and washed several times with ethanol to obtain a light purple Ni-Co LDH, then dried at 60 ℃ for 12 h in vacuum.
Synthesis of Am-NCS: The as-obtained Ni-Co LDH was vulcanized by S powder at 250 ℃ for 2 h (1 ℃/min) with a mass ratio of 1:2 under atmosphere, and then the final product of Am-NCS was collected. And the Am-NCO was prepared under the same conditions except for without S powder added.
Furthermore, comparative experiments were conducted, in which the concentration of the first step ion-exchange nickel-alcohol nitrate solution is half (AM-Ni0.5CoS), and the ratio of the second step ion-exchange material to sulfur powder is adjusted to 1:1.5 (AM-NiCoS1.5), and the curing temperature is adjusted to 350 ℃ (AM-NiCoS-350 ℃).
The electrochemical measurements were carried out both in three-electrode system and full cell. Platinum plate and Hg/HgO electrode were used as counter electrode and reference electrode, respectively. The work electrode was prepared by the following method: A mixture of 70% Am-NCS, 20% acetylene black and 10% PVDF was prepared to produce a uniform paste. Then the paste was coated with a carbon cloth collector (1.0 cm × 3.0 cm) and dried for 6 h at vacuum. The electrolyte is 3.0 mol/L potassium hydroxide aqueous solution. CHI660D electrochemical workstation was used for cyclic voltammetry (CV), electrochemical impedance spectroscopy (EIS) and electrostatic discharge (GCD) measurements. The electrochemical test was carried out with zinc sheet as counter electrode and reference electrode, Am-NCS as positive electrode, 3.0 mol/L potassium hydroxide and 0.03 mol/L zinc acetate as electrolyte.
A typical ZIF-67 with rhomboid dodecahedron structure, as shown in Fig. 1a and Fig S1a (Supporting information), exhibits the uniform sizes of 600–700 nm. It is obvious that the Ni-Co LDHs (Fig. 1b and Fig S1b in Supporting information) well inherits the polyhedron structure from ZIF-67, which composites by huge amounts of ultrafine nanoparticles remaining hollow structures. Then these hollow structures were further preserved after calcination, as recorded in Fig. 1c and Fig S1c (Supporting information), Am-NCS shows rough surfaces with many small particles dispersed on the shell, indicating that vulcanization process induces the reconstruction of the structures. Additionally, Fig. 1d confirms the nanocage-like hollow structures of Am-NCS, which are composited by many ultrafine nanoparticles. The ultrafine nanoparticles effectively increase the specific surface areas providing more electroactive sites for electrochemical applications. The nanocage-like hollow structures not only greatly shorten the distance of ion diffusion path, but also prevent the structural damage and ensure the long life of the structure. HRTEM (Fig. 1e) further reveals that no distinct lattice fringes are observed, and the weak crystalline is further proved by the SAED image in Fig. 1f, indicating the amorphous characteristics of Am-NCS. The elemental mappings in Figs. 1g-i clearly show the homogeneous distributions of Ni, Co and S elements, proving the successful synthesis of bimetallic sulfides. The elemental compositions of Am-NCS are further conformed by EDS spectrum (Fig. S2 in Supporting information), among which the C and O originate from the residual during calcination.
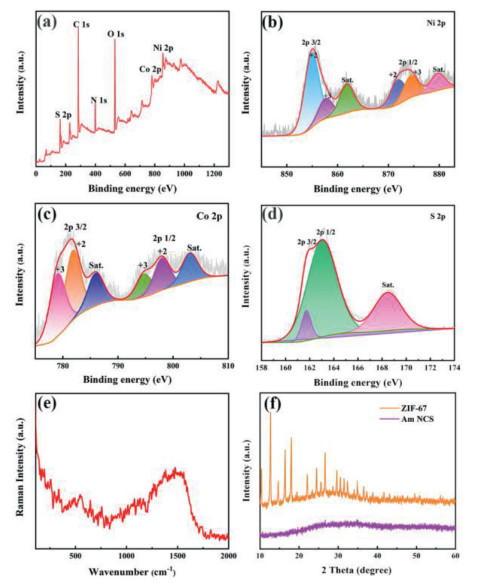
The compositions and valence states of Am-NCS are characterized by X-ray Photoelectron Spectroscopy (XPS), as shown in Fig. 2, from which the peaks corresponding to Ni 2p, Co 2p, S 2p, O 1s, N 1s and C 1s are clearly observed (Fig. 2a). Ni 2p spectrum in Fig. 2b could be fitted by two spin-orbit doublets (2p1/2 and 2p3/2) and two shakeup satellites (denoted as Sat.). The peaks at 855.2 and 873.4 eV correspond to the Ni2+, and the peaks at 857.1 and 871.6 eV are ascribed to the Ni3+ [29]. For Co 2p in Fig. 2c, the binding energies at 778.5 and 794.6 eV are attributed to Co3+ and the binding energies at 780.0 and 796.3 eV are indexed to Co2+ [30]. In the S 2p spectrum (Fig. 2d), the peaks located at 162.5 and 161.3 eV are ascribed to S 2p1/2 and 2p3/2, respectively, and the peak at 169.0 eV is shakeup satellite peak [31]. The wider and weaker Raman peaks in Fig. 2e indicate the poor crystallinity and amorphous characteristic of the Am-NCS. There is no obvious diffraction peak of XRD for Am-NCS, as recorded in Fig. 2f, further illustrating the amorphous characteristic of the Am-NCS.
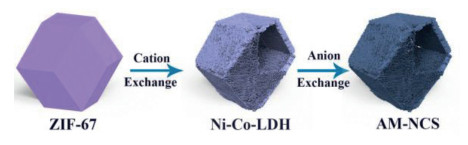
As schematically illustrated in Fig. 3, the Ni2+ ions are hydrolyzed and produced protons when Ni(NO3)2 is added, which will etch the ZIF-67 template through the protonation of the 2-mim ligand. Then, the Co2+ ions released from ZIF-67 MOFs will co-precipitate with Ni2+ ions to form Ni-Co LDH. With continuous etching, the ultrafine nanosheets of Ni-Co LDH will be formed on the surface of ZIF-67 composited hollow structures. Finally, the Am-NCS is obtained by annealing the Ni-Co LDH precursor in a tubular furnace at atmosphere with S powder as the sulfur source. The kinetic equilibrium between shell growth and acid etching of the template may be the key factor for the formation of hollow nanolayer structures [32, 33].
In Fig. 4a, the electrochemical properties of Am-NCS are investigated by three-electrode configuration. Two redox peaks at 0.2 V and 0.5 V are observed in CV curves. With the increase of scanning rate, the oxidation peak shifts to the high potential and the reduction peak to the low potential. The CV curves (Fig. 4b) show that the Am-NCS has the largest area, indicating the largest specific capacitance. Fig. 4c shows that the specific capacity values are as high as 160, 151, 141, 135 and 131 mAh/g at 2, 5, 10, 15 and 20 A/g, respectively. GCD curves (Fig. 4d) show that the specific capacity of the Am-NCS is 117.5 mAh/g larger than those of Am-NiCoS-350, Am-NiCoS1.5 and Am-Ni0.5CoS. The rate capabilities recorded in Fig. 4e exhibit that the specific capacity of Am-NCS is remained about 82.5% of the initial at a high current density of 20 A/g, which is superior than Am-NiCoS-350, Am-NiCoS1.5 and Am-Ni0.5CoS.
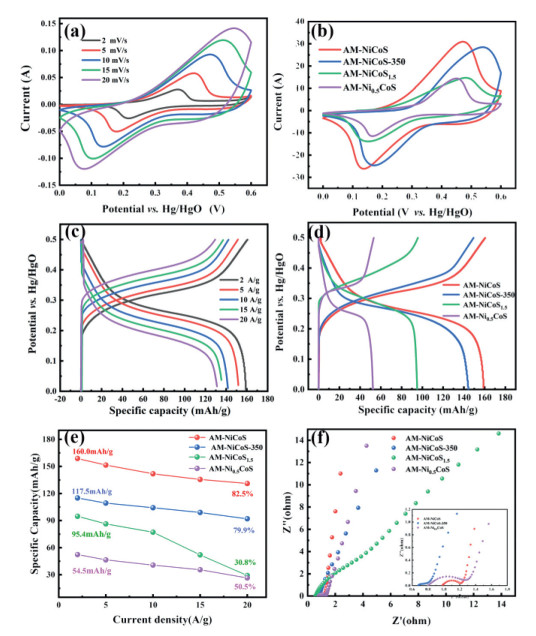
Electrochemical Impedance Spectroscopy (EIS) are conducted and recorded in Fig. 4f. The value of charge transfer resistance (Rct) for Am-NCS are 0.13 Ω far smaller than Am-NiCoS-350, Am-NiCoS1.5 and Am-Ni0.5CoS, as displayed in Fig. S3 (Supporting information). It is demonstrated that the Am-NCS has higher charge transfer kinetics at the electrode electrolyte interface than others. The smaller Rct indicates the better dispersibility of the material and the close bonding with the substrate, resulting in a higher capacity [34]. Therefore, the EIS measurements testify that the Am-NCS electrode exhibits more favorable charge transfer kinetics than other samples.
To explore the crucial role of Am-NCS cathode in rechargeable alkaline AZIBs, the Am-NCS//Zn was assembled by using Am-NCS as cathode, zinc foil as anode and non-woven fabric as separator, as depicted in Fig. 5a The Faraday redox process can be deduced as follows:
|
|
(1) |
|
|
(2) |
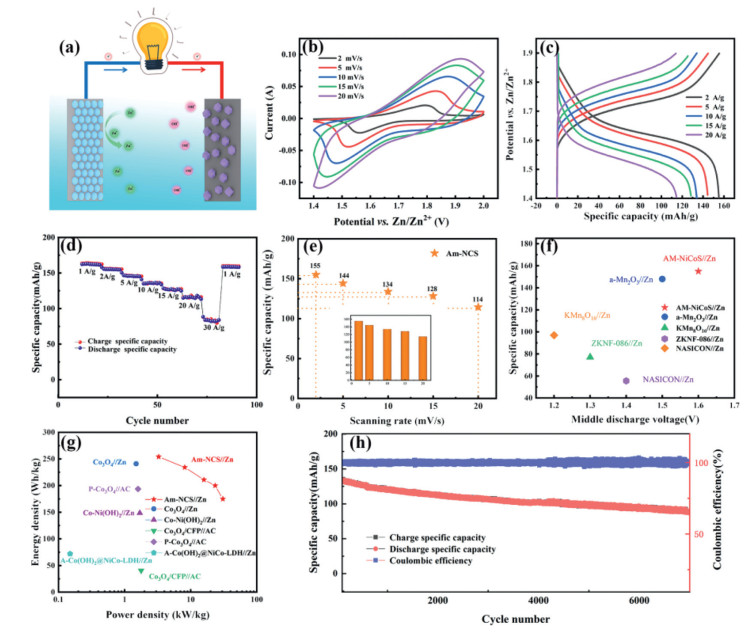
CV curves in Fig. 5b show that the peak currents increase gradually without significant deformation as the scanning rates increase, signifying that the Am-NCS//Zn enjoys outstanding rate performance and reversibility by virtue of fast reaction kinetics and optimized interface characteristics. To gain further insight into the storage mechanism of electrode, there is a typical way of is used to analyzing analyze the CV data at various sweep rates according to the following equation [35].
|
|
(3) |
where the measured current i obeys a power law relationship with the sweep rate v. Both a and b are adjustable parameters, with b values determined from the slope of the plot of logi versus logv, as described in the following:
|
|
(4) |
In particular, the coefficient b varies in the range of 0.5–1.0, so there are two well-defined conditions, namely, b = 0.5 and b = 1.0. The b value of 0.5 is indicative of a diffusion-controlled insertion process, while the b value of 1.0 is representative of a surface capacitive process [36]. According to the linear relationship between logi and logv plots (Eq. 4), as shown in Fig. S6 (Supporting information), the b values of redox peaks are calculated as 0.67 (peak 1) and 0.68 (peak 2) as shown in Fig. S6, respectively, This suggests that the electrochemical kinetic of Am-NCS electrode is related to both diffusion-controlled process and capacitive effects, but however the diffusion-controlled behavior is the dominant process. As depicted in Fig. S7 (Supporting information), the capacitive contribution is about 45.21% of the total stored charges at 5 mV/s, and the ratio of the capacitive contribution increases with the increment of the scan rates, as record in Fig. S8 (Supporting information). The capacitive contribution can be reached 90.28% at 20 mV/s, and confirming the electrochemical performances are determined by capacitive-kinetics process [37, 38].
GCD curves in Fig. 5c manifest that the specific capacitance of Am-NCS//Zn are as high as 155, 144, 133, 128, 114 mAh/g at 2, 5, 10, 15 and 20 A/g, respectively. Rate performance in Fig. 5d shows that the discharge specific capacities are 160, 154, 146, 135, 127, 114 and 83 mAh/g, when the current densities are 1, 2, 5, 10, 15, 20 and 30 A/g, respectively. When the current density returns to 1 A/g, the reversible discharge specific capacity of the Am-NCS is retained at 160 mAh/g, indicating the good rate capabilities [39, 40]. Fig. 5e shows that the capacities of Am-NCS//Zn are as high as 155, 144, 134, 128 and 114 mAh/g at 2, 5, 10, 15 and 20 mV/s corresponding well with the calculating values of GCD. Fig. 5f indicates that Am-NCS//Zn has a higher capacity than previous reported batteries, such as a-Mn2O3//Zn [41], KMn8O16//Zn [42], ZKNF-086//Zn [43] and NASION//Zn [44]. Besides, Am-NCS//Zn deliver higher energy densities and power densities as shown in Fig. 5g (254.2 Wh/kg at 3.28 kW/kg, based on the cathode mass loading), compared to the recent works such as Co3O4//Zn [45], Co-Ni(OH)2//Zn [46], A-Co(OH)2@NiCo-LDH//Zn [47], P-Co3O4//Zn [48] and Co3O4/CFP//AC [49]. The stability of Am-NCS//Zn is also conducted, as shown in Fig. 5h, its capacity remains 62.5% of the initial after 7000 cycles. The high cycle stability may also be related to the unique morphology and crystallinity of the samples: (1) The layered nanostructure with a layer of nanosheets on the surface effectively prevents the aggregation or separation of particles during the cycle test; (2) The electroactive amorphous materials are activated during the first several hundred cycles, which also endows the high stability of the NiCoS nanometer layer; (3) The amorphous structure withstand large structural changes in the charge-discharge cycle test, thus achieving high stability.
In summary, the hollow Am-NCS were successfully designed and synthesized via ion exchange method with ZIF-67 as the self-template The amorphous hollow Am-NCS shows a remarkable capacity of 160 mAh/g at 2 A/g In addition, the assembled Am-NCS//Zn has an impressive specific capacity (155 mAh/g at 2 A/g) and a capacitance retention of 62.5% after 7000 cycles at 10 A/g. An impressive energy density of 254.2 Wh/kg can be achieved at the power density of 3.28 kW/kg. The excellent electrochemical performance is mainly attributed to its unique hollow structure and amorphous structure. This work provides a new strategy for the design and synthesis of high-performance cathode materials for AZBs.
The authors declare that they have no known competing financial interests or personal relationships that could have appeared to influence the work reported in this paper.
This work was supported by the Independent Cultivation Program of Innovation Team of Ji'nan City (No. 2019GXRC011), and National Natural Science Foundation of China (No. 51802177) and Natural Science Foundation of Shandong Province (No. ZR2020QE062).
Supplementary material associated with this article can be found, in the online version, at doi:10.1016/j.cclet.2021.10.084.
C. Shen, X.Li, N Li, et al., ACS Appl. Mater. Interfaces10 (2018) 30.
Q. Fang, J. Zhou, A. Pan, et al., ACS Energy Lett. 3 (2018) 2480–2501. doi: 10.1021/acsenergylett.8b01426
A. Konarov, N. Voronina, J. Jo, et al., ACS Energy Lett. 3 (2018) 2620–2640. doi: 10.1021/acsenergylett.8b01552
F. Ming, H. Liang, Y. Lei, et al., ACS Energy Lett. 3 (2018) 2602–2609. doi: 10.1021/acsenergylett.8b01423
H. Pan, Y. Shao, P. Yan, et al., Nat. Energy1 (2016) 16039. doi: 10.1038/nenergy.2016.39
C. Xia, J. Guo, Dr. P. Li, et al., Angew. Chem. Int. Ed. 57 (2018) 3943–3948. doi: 10.1002/anie.201713291
P. Zhang, Y. Li, G. Wang, et al., Adv. Mater. 31 (2019) 1806005. doi: 10.1002/adma.201806005
Y. Fu, Q. Wei, G. Zhang, et al., Adv. Energy Mater. 8 (2018) 1801445. doi: 10.1002/aenm.201801445
G. Xiang, G. Qu, X. Xu, et al., Inorg. Chem. Front. 6 (2019) 2135–2141. doi: 10.1039/c9qi00653b
X. Wang, M. Li, Y. Wang, et al., J. Mater Chem. A3 (2015) 8280–8283. doi: 10.1039/C5TA01947H
A. Magasinski, P. Dixon, B. Hertzberg, et al., Nat. Mater. 9 (2010) 353–358. doi: 10.1038/nmat2725
S. Karuturi, J. Luo, C. Cheng, et al., Adv. Mater. 24 (2012) 4157–4162. doi: 10.1002/adma.201104428
S. Zheng, Q. Li, H. Xue, et al., Natl. Sci. Rev. 7 (2020) 305–314. doi: 10.1093/nsr/nwz137
Q. Wang, F. Gao, B. Xu, et al., Chem. Eng. J. 327 (2017) 387–396. doi: 10.1016/j.cej.2017.06.124
D. Cheng, Q. Zhong, J. Wang, et al., Adv. Mater. Interfaces6 (2019) 1900858. doi: 10.1002/admi.201900858
P. Wang, C. Li, W. Wang, et al., Chin. Chem. Lett. 29 (2018) 612–615. doi: 10.1016/j.cclet.2018.01.051
Y. Zhang, P. Wang, Y. Yin, et al., Chem. Eng. J356 (2019) 1042–1051. doi: 10.1016/j.cej.2018.09.131
S. Deng, Z. Yuan, Z. Tie, et al., Angew Chem. Int. Ed. 59 (2020) 22002–22006. doi: 10.1002/anie.202010287
C. Dai, P. Chien, J. Lin, et al., ACS Appl. Mater. Interfaces5 (2013) 12168–12174. doi: 10.1021/am404196s
W. Liu, J. Hao, C. Xu, et al., Chem. Commun. 53 (2017) 6872–6874. doi: 10.1039/C7CC01064H
N. Li, X. Guo, X. Tang, et al., Chin. Chem. Lett. 33 (2022) 462–465. doi: 10.1016/j.cclet.2021.05.012
Y. Zhang, P. Wang, Y. Yin, et al., Carbon150 (2019) 378–387. doi: 10.1016/j.carbon.2019.05.048
L. Zhou, Z. Zhuang, H. Zhao, et al., Adv. Mater. 29 (2017) 170156.
G. Qu, C. Li, P. Hou, et al., Nanoscale12 (2020) 4686–4694. doi: 10.1039/c9nr09991c
S. Zheng, Y. Ru, H. Xue, et al., Chin. Chem. Lett. 20 (2021) 6353.
S. Xiong, H. Zeng, Angew Chem. Int. Ed. 51 (2012) 949–952. doi: 10.1002/anie.201106826
G. Qu, X. Zhang, G. Xiang, Chin. Chem. Lett. 31 (2020) 2007–2012. doi: 10.1016/j.cclet.2020.01.040
L. Jin, H. Pang, Chin. Chem. Lett. 31 (2021) 2300–2304.
X. Zhang, G. Qu, Z. Wang, et al., Appl. Surf. Sci. 512 (2020) 145621. doi: 10.1016/j.apsusc.2020.145621
L. Yang, X. Lu, S. Wang, et al., Nanoscale3 (2020) 1–49.
X. Li, G. Qu, X. Xu, et al., J. Nanoelectron Optoe. 15 (2020) 1–5. doi: 10.1166/jno.2020.2741
X. Xu, F. Nosheen, X. Wang, Chem. Mater., 28 (2016) 6313–6320. doi: 10.1021/acs.chemmater.6b02586
Y. Zeng, X. Wang, H. Wang, et al., Chem. Commun. 46 (2010) 4312–4314. doi: 10.1039/c0cc00706d
P. Sun, N. Li, C. Wang, et al., J. Power Sources427 (2019) 56–61. doi: 10.1016/j.jpowsour.2019.04.062
H. Lindström, S. Södergren, A. Solbrand, et al., J. Phys. Chem. 39 (1997) 7717–7722.
J. Wang, J. Polleux, J. Lim, et al., J. Phys. Chem. 40 (2007) 14925–14931. doi: 10.1021/jp074464w
P. Hu, T. Wang, J. Zhao, et al., ACS Appl. Mater Interfaces7 (2018) 26396–26399.
G. Xiang, Y. Meng, G. Qu, et al., Sci. Bull. 65 (2020) 443–451. doi: 10.1016/j.scib.2020.01.004
G. Qu, P. Sun, G. Xiang, et al., Appl. Mater. Today20 (2020) 100713. doi: 10.1016/j.apmt.2020.100713
P. Sun, W. He, H. Yang, et al., Nanoscale10 (2018) 19004–19013. doi: 10.1039/c8nr04919j
B. Jiang, C. Xu, C. Wu, et al., Electrochim. Acta229 (2017) 422–428. doi: 10.1016/j.electacta.2017.01.163
J. Cui, X. Wu, S. Yang, et al., Front. Chem. 6 (2018) 352. doi: 10.3389/fchem.2018.00352
M. Chae, J. Heo, H. Kwak et al., J. Power Sources337 (2017) 204–211. doi: 10.1016/j.jpowsour.2016.10.083
G. Li, Z. Yang, Y. Jiang, et al., Nano Energy25 (2016) 211–217. doi: 10.1016/j.nanoen.2016.04.051
X. Wang, F. Wang, L. Wang, et al., Adv. Mater. 28 (2016) 4904–4911. doi: 10.1002/adma.201505370
C. Xu, J. Liao, C. Yang, et al., Nano Energy30 (2016) 900–908. doi: 10.1016/j.nanoen.2016.07.035
Y. Wang, T. Wang, J. Lei, et al., Inorg. Chem. Front. 8 (2021) 3325–3335. doi: 10.1039/d1qi00191d
F. Yang, K. Zhang, Z. Cen, et al., J. Alloy. Compd. 879 (2021) 160439. doi: 10.1016/j.jallcom.2021.160439
L. Sui, X. Shi, T. Deng, et al., J. Energy Chem. 37 (2019) 7–12. doi: 10.1016/j.jechem.2018.11.009

Figure 1 SEM images of (a) ZIF-67, (b) Ni-Co LDH and (c) Am-NCS. (d, e) TEM and HRTEM images of Am-NCS. (f) SAED image of Am-NCS. (g-i) The elemental mappings of Am-NCS.

Figure 2 XPS spectra of Am-NCS: (a) Survey scan; High-resolution scan of the (b) Ni 2p, (c) Co 2p and (d) S 2p. (e) Raman image of Am-NCS. (f) XRD patterns of ZIF-67 template and Am-NCS.

Figure 4 The electrochemical characterization of Am-NCS electrode: (a) CV curves at different scanning rates; (b) CV curves of different samples; (c) GCD curves of the Am-NCS electrode at different scanning rates from 2 mV/s to 20 mV/s; (d) GCD curves, (e) capacities curves and (f) EIS of Am-NiCoS, AM-NiCoS-350, AM-Ni0.5CoS and AM-NiCoS1.5.

Figure 5 (a) Schematic illustration of the AZBs based on Am-NCS cathode and Zn anode. (b) CV curves of the as-assembled Am-NCS//Zn with different scan rates ranging from 1.4 V to 2.0 V. (c) GCD curves of the Am-NCS//Zn at different current densities. (d) Rate capabilities of as-assembled Am-NCS//Zn at different current densities. (e) Rate capabilities of Am-NCS at different scan rates. (f) The midpoint voltage and specific capacity of Am-NCS//Zn in comparison with recently reported energy storage systems. (g) Ragone plot of Am-NCS//Zn. (h) Cycling performance of the Am-NCS//Zn at 10 A/g.

 扫一扫看文章

扫一扫关注我们
 DownLoad:
 下载:
下载:
