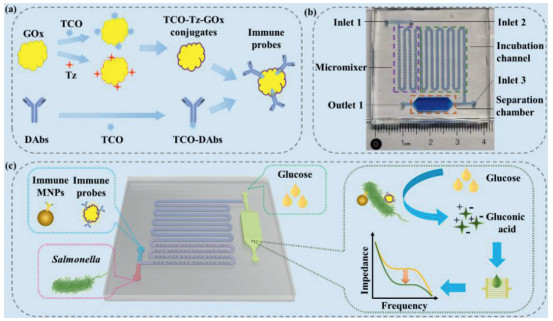
Scheme 1.
(a) The synthesis of the immune enzymatic probes. (b) The structure of the microfluidic chip. (c) The mechanism of the impedance biosensor for rapid and sensitivedetection of Salmonella typhimurium.
A microfluidic biosensor for rapid detection of Salmonella typhimurium based on magnetic separation, enzymatic catalysis and electrochemical impedance analysis
Yingjia Liu , Dong Jiang , Siyuan Wang , Gaozhe Cai , Li Xue , Yanbin Li , Ming Liao , Jianhan Lin

Foodborne pathogenic bacteria have been a serious threat to social public health and economic development [1, 2]. Among these bacteria, Salmonella is one of the leading causes for foodborne diseases [3, 4]. At present, the gold standard method for detection of Salmonella is culture, which is sensitive and accurate, but takes a long time [5]. Polymerase chain reaction (PCR) is widely used as the recommended method due to its high sensitivity and short time, but it requires complex nucleic acid extraction [6, 7]. Enzyme-linked immunosorbent assay (ELISA) is another recommended method and featured with rapid detection and high throughput [8], however, it lacks sufficient sensitivity [9]. Thus, simple, rapid and sensitive methods are urgently needed to strengthen risk monitoring and ensure food safety.
In the past decade, many biosensors have been reported for rapid detection of Salmonella, including electrochemical [10, 11], optical [12], quartz crystal microbalance [13, 14], and surface-enhanced Raman scattering [15, 16], etc. As one important type of electrochemical biosensor, impedance biosensor has attracted great attention owing to high sensitivity, low cost and miniaturized size [17]. So far, impedance biosensors have often relied on the electrochemical reaction on the electrode surface via complex electrode modification procedures and multiple solid-liquid phase reactions [18, 19]. Recently, some modification-free impedance biosensors have been developed by introducing different nature enzymes and nanozymes to amplify the impedance signals. Urease was often reported to develop impedance biosensors because it could catalyze urea (high impedance) into ammonium carbonate (low impedance) [20]. MnO2 in various morphological structures was also used as catalase mimic for the development of impedance biosensors since it could react with H2O2 (high impedance) to produce Mn2+ (low impedance) [21]. Very recently, glucose oxidase (GOx) has been introduced into impedance biosensing of bacteria due to its ability to catalyze glucose (high impedance) into gluconic acid (low impedance) and H2O2 (high impedance) [22, 23]. To further improve the sensitivity of biosensors, some emerging nanomaterials, such as mesoporous silica nanocomposites [24, 25] and metal-organic frameworks [26], were reported for signal amplification. Besides, the click chemical reaction between 1, 2, 4, 5-tetrazine and trans-cyclooctene has also been demonstrated with significant advantages, including their high reaction rate and biocompatibility [27, 28].
With rapid development of microfabrication technology, microfluidic chips have been widely used for automatic detection of pathogenic bacteria by integrating mixing, separation, washing, reaction and detection onto one single chip [29-31]. As the key component of microfluidic chip, micromixers often have a great impact on the sensitivity of microfluidic biosensors. The micromixers with staggered asymmetric herringbone grooves at the top or bottom of their microchannels have been verified to promote the transverse flow, increase the local vorticity and achieve effective mixing [32, 33]. Therefore, it might be promising to develop impedance biosensors combining microfluidic chips with click chemistry and enzymatic catalysis for rapid, sensitive and automatic detection of foodborne pathogens.
In this study, a microfluidic biosensor was developed for rapid and sensitive detection of S. typhimurium based on magnetic separation, enzymatic catalysis and electrochemical impedance analysis. Immune probes were synthesized based on click chemical reaction between tetrazine-sulfo-NHS ester (Tz) and trans-cyclooctene-PEG4-NHS ester (TCO) (Scheme 1a). As shown in Scheme 1c, the bacterial sample, the immune magnetic nanoparticles (MNPs), and the immune enzymatic probes were simultaneously injected into the microfluidic chip, continuous-flow mixed by the micromixer with staggered asymmetric herringbone convexes, and sufficiently incubated in the serpentine incubation channel. The MNP-bacteria-probe complexes formed through immunological reaction between the anti-S. typhimurium capture antibodies (on the magnetic nanoparticles) and the anti-S. typhimurium detection antibodies (on the probes) and the target bacteria. Then, the complexes were magnetically captured in the separation chamber under an external magnetic field, followed by washing with 600 μL deionized water to remove the sample background, the excessive probes and the residual inorganic ions. Finally, glucose with high impedance was injected into the chamber and oxidized by the GOx on the complexes to produce H2O2 with high impedance and gluconic acid with low impedance, which were measured using the interdigitated microelectrode and the electrochemical impedance analyzer to determine the amount of the target Salmonella cells.
The microfluidic chip is a key part of this biosensor. As shown in Scheme 1b, it is mainly composed of three parts: (1) The micromixer with twelve groups of six staggered asymmetric herringbone convexes for continuous-flow mixing of the bacterial samples, MNPs and probes; (2) the serpentine incubation channel (width: 1 mm, height: 0.425 mm, length: 20 mm) for sufficient reaction to form the MNP-bacteria-probe complexes; (3) the separation chamber (length: 15 mm, width: 5 mm, height: 4 mm) for magnetic separation of the complexes under the external magnetic field and effective catalysis of glucose. Each convex includes two orthogonal cuboids which intersection is at one third of the channel. The width and height of the cuboids are 0.5 mm and 0.3 mm, respectively. The space between each two convex is 0.5 mm.
The microfluidic chip was fabricated using 3D printing and surface plasma bonding. The 3D mold for the microfluidic chip was drawn in stl format using the Solidworks software (Dassault Systèmes SolidWorks Corporation, Waltham, MA, USA) and printed using the Objet 30 3D printer. Then, the prepolymer of PDMS and the curing agent were mixed at the ratio of 10:1 and poured into the mold, followed by curing at 65 ℃ for 12 h after degassing for 15 min in vacuum to remove the bubbles. Finally, the PDMS replica was peeled off and bonded to the glass slide after surface plasma treatment and aged at 65 ℃ overnight to obtain the microfluidic chip.
Impedance measurements of the catalysate were conducted using the interdigitated microelectrode from LinkZill (Hangzhou, China). As shown in Fig. S1 (Supporting information), the microelectrode includes five pairs of comb electrodes with the comb width of 100 μm and the comb length of 2 mm. Each comb electrode has thirty-five pairs of finger electrodes with the finger length of 150 μm, the finger width of 20 μm and the finger gap of 20 μm. Besides, the microelectrodes were fabricated on the flexible polyethylene naphthalate (PEN) substrate to reduce the cost (~ $2 for each). For all the impedance measurements, a sinusoidal alternating potential with an amplitude of 5 mV, a direct-current bias of 0 V and a frequency range of 1 Hz to 5 MHz was applied on the microelectrode, and the bode plots were recorded to analyze the electrochemical impedance data.
To establish the calibration curve of this biosensor, different concentrations of target bacteria in pure cultures were detected using this biosensor. First, 200 µL of the target bacterial culture (each concentration from 1.6 × 10² CFU/mL to 1.6 × 10⁶ CFU/mL), 20 µg of the immune MNPs and 25 µg of the immune enzymatic probes were injected into the microfluidic chip, respectively. This procedure was conducted at the same flow rate of 15 µL/min using precise syringe pumps (Pump 11 elite, Harvard Apparatus, Holliston, MA, USA). After mixing by the micromixer and incubation in the serpentine incubation channel, the MNP-bacteria-probe complexes formed. They were captured in the separation chamber by applying an external magnetic field using two repelling Neodymium-Iron-Boron magnets. Following by washing with 100 µL of PBST (PBS containing 0.05% Tween 20) to remove the unboned probes and 600 µL of deionized water to remove the chemical ions in the separation chamber. Then, 100 µL of glucose (50 mmol/L) was injected to the separation chamber and catalyzed by the GOx on the complexes for 30 min. Finally, 20 μL of the supernatant was transferred onto the microelectrode for impedance measurement, which was conducted on the IM6 electrochemical workstation (ZAHNER, Kronach, Bavaria, Germany) with the Thales analysis software. The normalized impedance (ΔZ) at the characteristic frequency of 10.08 kHz was used to determine the concentration of target bacteria and described as Eq. 1.
|
|
(1) |
where, Zs and Zc are the impedance of the sample and the control (glucose) at the characteristic frequency, respectively.
To verify the practicability of this biosensor for detection of Salmonella in real foods, the chicken meats were purchased from the local supermarket. First, 25 g of chicken meats were added into 225 mL of sterile PBS and homogenized (BagMixer, Interscience, Mourjou, France) for 4 min followed by standing for 5 min to obtain the supernatant. Then, different concentrations of S. typhimurium were added into the supernatant to obtain the spiked chicken meat samples containing target bacteria ranging from 1.6 × 10² CFU/mL to 1.6 × 10⁶ CFU/mL. Finally, the spiked chicken samples were detected using this biosensor.
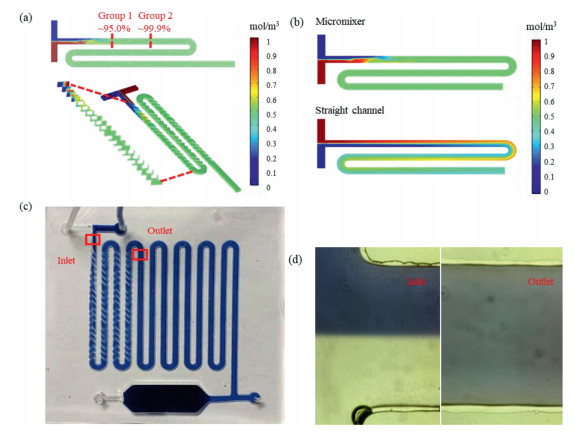
The micromixer played an important role in the immunoreaction between the target bacteria and the MNPs/probes. To better understand the performance of the micromixer, the COMSOL software was employed to simulate the micromixer and the mixing efficiency (Ms) was used to evaluate the mixing effect [34], which can be described as Eq. 2.
|
|
(2) |
where Ci is the concentration of the point i, Cm is the mean concentration of all the points in the cross section, and n is the number of the points at the cross section. As shown in Fig. 1a, the mixing efficiency of two fluids reaches 99.99%, i.e., complete mixing, when they flow through the second group of the staggered asymmetric herringbone convexes at the flow rate of 150 μL/min. To verify the mixing effect of these convexes, this micromixer and the same straight channel were simulated and compared. As shown in Fig. 1b, it takes a much shorter distance to completely mix two fluids in the micromixer than the straight channel. To further demonstrate, the blue dye and deionized water were simultaneously injected into the chip at the flow of 30 µL/min using syringe pumps (Pump 11 Elite, Holliston, MA, USA). As shown in Fig. 1c, the blue dye was separated from the deionized water at the inlet and rapidly mixed in the micromixer. The photos of the inlet and outlet were taken using the fluorescent inverted microscope (Eclipse Ti, Nikon, Kyoto, Japan) with a high-speed camera. As shown in Fig. 1d, it can be clearly seen that the blue dye is deep and separate from the deionized water at the inlet of the micromixer and they are fully mixed with light blue color at the outlet. The photos were further processed using the ImageJ software. The calculated results show that the mixing efficiency at the outlet of the micromixer is up to 95%.
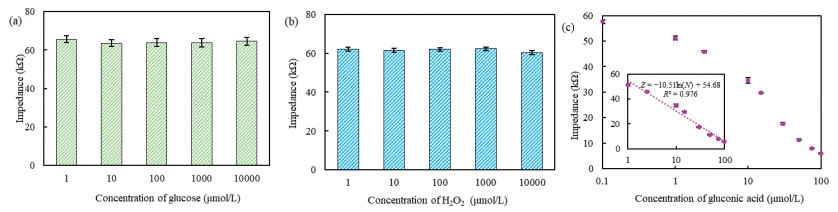
The mechanism of this biosensor was based on the impedance change induced by the glucose oxidase to catalyze glucose (high impedance) into gluconic acid (low impedance) and H2O2 (high impedance). To prove the concept of this biosensor, the electrochemical impedance spectra (EIS) for different concentrations of glucose, H2O2 and gluconic acid were measured. As shown in Figs. 2a and b, the impedance for different concentrations of glucose and H2O2 from 1 μmol/L to 10 mmol/L almost remains about 65 kΩ and closes to that for deionized water, verifying that their impedance does not change with their concentration. As shown in Fig. 2c, the impedance at the characteristic frequency of 10.08 kHz decreases from 57.7 kΩ to 6.0 kΩ when the concentration of gluconic acid increases from 0.1 μmol/L to 100 μmol/L, and a linear relationship between the impedance (Z) at characteristic frequency and the concentration of gluconic acid (N) from 1 μmol/L to 100 μmol/L is found and can be described by Z = −10.51 ln(N) + 54.68. This is because more gluconate ions and hydrogen ions are present in the solution to increase its conductivity while the concentration of gluconic acid increases. Besides, after the MNP-bacteria-probe complexes were formed, the separation chamber was washed with deionized water. To check if the residuals were effectively removed, the impedance of deionized water was first measured as control. Then, different volumes (100–700 μL) of the deionized water were used to wash the complexes. Finally, an additional 100 μL of the deionized water was injected and collected, followed by measuring its impedance for comparison. As shown as Fig. S2 (Supporting information), when 600 μL or more deionized water was used to wash the complexes, the impedance of the collected deionized water (83.10 kΩ) was very close to that of the original deionized water (84.22 kΩ), indicating that ~ 99% of the residuals were washed away. Therefore, gluconic acid in the catalysate is the only substance responsible for the impedance change.
The microelectrode played an important role in the development of this biosensor. In our previous studies, another simple interdigitated microelectrode with the finger width and gap of 15 μm was fabricated on the glass substrate using photolithography and wet-etching with a high cost (~ $10 for each) and used for impedance measurement of ammonium carbonate, which was the catalysate of urease-urea system in the development of our previous impedance biosensors. To compare their performance, the impedance measurement for different concentrations (1–100 μmol/L) of gluconic acid was conducted. As shown in Fig. S3 (Supporting information), the impedance of both microelectrodes has a good linear relationship with the concentration of gluconic acid. However, the slope for this microelectrode is larger than that of previous one, indicating that the sensitivity of this microelectrode is higher due to more pairs of this microelectrode.
To understand the measured impedance data, the equivalent circuit was used to simulate this biosensor using the ZSimpWin software. The equivalent circuit is showed in Fig. S4a (Supporting information), which includes three elements: solution resistor (Rs), double layer capacitor (Cdl) and dielectric capacitor (Cdi). Rs stands for the resistance of the bulk electrolyte solution; Cdl stands for the effect of the charge at the electrode-solution interface; Cdi stands for the dielectric characteristics of the electrolyte solution. To further investigate the fitting of this equivalent circuit, the measured impedance data for 100 μmol/L gluconic acid were compared with the calculated data through the equivalent circuit. As shown in Fig. S4b (Supporting information), both the magnitude and phase angle of the measured data fit well with those of the calculated one, indicating this equivalent circuit is suitable for simulation of this biosensor. In the low frequency range from 3 Hz to 400 Hz, the impedance gradually decreases since it is dominated by the double-layer capacitor. In the medium frequency range from 400 Hz to 100 kHz, the impedance remains stable since it is dominated by the solution resistor. In the high frequency range from 100 kHz to 2.5 MHz, the impedance decreases again since it is dominated by the dielectric capacitor. In this study, the change of the catalysate's ionic concentration (solution resistance) is the main factor to the impedance change, and thus the characteristic wavelength of 10.08 kHz was selected to analyze the relationship between the impedance and the bacterial concentration.
The flow rate, the amount of the immune enzymatic probes, the concentration of glucose and the time for enzymatic reaction were also important factors to the sensitivity of this impedance biosensor. The detailed procedures for their optimization can be found in Supporting information. As shown in Fig. S5 (Supporting information), the optimal flow rate of 10 μL/min, the optimal amount of 25 μg for the immune enzymatic probes, the optimal concentration of 50 mmol/L for glucose and the optimal time of 30 min for enzymatic catalysis could be obtained and were used in this study.
To better interpret the impedance data, different concentrations of gluconic acid ranging from 1 μmol/L to 100 μmol/L were measured using the microelectrode and the impedance data were used to simulate the elements of the equivalent circuit. The results are shown in Table S1 (Supporting information), compared with the control (50 mmol/L glucose), the solution resistor has shown a significant relative change from 19.6% at 1 μmol/L to 92.0% at 100 μmol/L. However, the double-layer capacitor is almost unchanged and the dielectric capacitor only has slight increases from 1.4% at 1 μmol/L to 6.0% at 100 μmol/L. Besides, the average standard deviations of Rs, Cdl and Cdi are 2.9%, 4.2% and 3.8% respectively, indicating the suitability of this equivalent circuit to simulate this biosensor.
To determine unknown bacterial concentration, different concentrations of the target bacteria from 1.6 × 10² CFU/mL to 1.6 × 10⁶ CFU/mL were detected using this impedance biosensor at optimal conditions to establish the calibration model. The electrochemical impedance spectra were shown in Fig. 3a. The impedance decreases with the concentration of target bacteria. To obtain the calibration model, the normalized impedance (ΔZ) at the characteristic frequency of 10.08 kHz was plotted with the concentration (C) of target bacteria. As shown in Fig. 3b, the normalized impedance has a linear relationship with the bacterial concentration and could be expressed as ΔZ = 0.0476 ln(C) + 0.1393 (R2 = 0.9889). The lowest detection limit of this biosensor was calculated as 73 CFU/mL based on three times of signal-to-noise ratio. The high sensitivity of this impedance biosensor is mainly attributed to the following aspects: (1) The effective reaction of the target bacteria with the immune MNPs and immune enzymatic probes through the efficient mixing and sufficient incubation in the microfluidic chip, (2) the amplification of the impedance signals using the immune enzymatic probes with a load of GOx, and (3) the sensitive measurement of the impedance using the microelectrode.
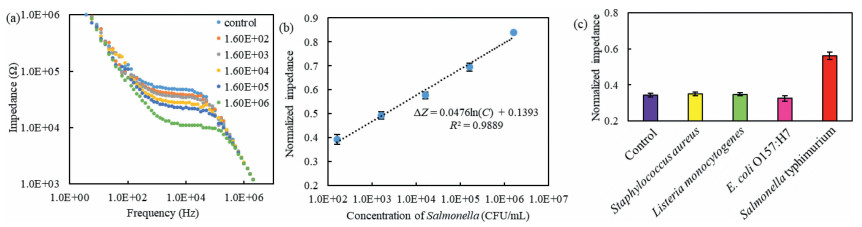
To investigate the specificity of this impedance biosensor, E. coli O157:H7, Listeria monocytogenes and Staphylococcus aureus were used as non-target bacteria. The negative control (PBS), target bacteria and non-target bacteria at the concentration of 1.6 × 10⁴ CFU/mL were detected using this biosensor. As shown in Fig. 3c, the normalized impedance for target bacteria (0.5616) is significantly larger than the non-target bacteria (0.3254 for E. coli, 0.3483 for Listeria and 0.3491 for Staphylococcus) and negative control (0.3438), indicating that this biosensor has a good specificity due to the specific capture and detection antibodies against the target bacteria.
To further investigate the feasibility of this impedance biosensor for detection of S. typhimurium in real samples, the spiked chicken meat samples containing S. typhimurium from 1.6 × 10² CFU/mL to 1.6 × 10⁶ CFU/mL were detected using this biosensor. The recovery of target bacteria was calculated as the ratio of the normalized impedance for each spiked sample to that for its original culture. As shown in Table S2 (Supporting information), the normalized impedance for each spiked sample is close to that for the original culture. Besides, the recoveries for different concentrations of target bacteria from 1.6 × 10² CFU/mL to 1.6 × 10⁶ CFU/mL range from 96.6% to 105.7% with the coefficient of variation from 0.5% to 4.6%, indicating this biosensor has good practicability.
In this study, a microfluidic biosensor based on magnetic separation, enzymatic catalysis and impedance analysis was successfully developed for rapid and sensitive detection of Salmonella. Under the optimal conditions, this biosensor was able to detect Salmonella as low as 73 CFU/mL in 1 h. The glucose-GOx system was demonstrated with the ability to result in obvious impedance change and could be used for impedance biosensor development. The mixing, incubation, separation, washing and catalysis were integrated into one single microfluidic chip and carried out automatically. It reduces the requirement on well-trained technicians and enhances the consistence on bacteria detection. This biosensor has the potential to be extended for detection of other targets by using their specific antibodies.
The authors declare no conflict of interest.
This study was supported by Walmart Foundation (No. SA17031161). The authors would like to thank Walmart Food Safety Collaboration Center and LinkZill company for their great support.
Supplementary material associated with this article can be found, in the online version, at doi:10.1016/j.cclet.2021.10.064.
S.P. Oliver, Foodborne Pathog. Dis. 16 (2019) 439–440. doi: 10.1089/fpd.2019.29012.int
D. Dewey-Mattia, K. Manikonda, A.J. Hall, et al., MMWR Surv. Summ. 67 (2018) 1–11.
European Food Safety Authority, European Food Safety Authority, European Ctr. Dis. Prevention & Co., EFSA J. 15 (2017) 5077.
F. Boelaert, A. Stoicescu, G. Amore, et al., EFSA J. 19 (2021) 6406.
N.F.D. Silva, J. Magalhaes, C. Freire, C. Delerue-Matos, Biosens. Bioelectron. 99 (2018) 667–682. doi: 10.1016/j.bios.2017.08.019
M. Amiri, A. Bezaatpour, H. Jafari, R. Boukherroub, S. Szunerits, ACS Sens. 3 (2018) 1069–1086. doi: 10.1021/acssensors.8b00239
Y. Liu, H.B. Zhou, Z.W. Hu, et al., Biosens. Bioelectron. 94 (2017) 131–140. doi: 10.1016/j.bios.2017.02.032
W.B. Valderrama, E.G. Dudley, S. Doores, C.N. Cutter, Crit. Rev. Food Sci. Nutr. 56 (2016) 1519–1531. doi: 10.1080/10408398.2013.775567
K.M. Lee, M. Runyon, T.J. Herrman, R. Phillips, J. Hsieh, Food Control 47 (2015) 264–276. doi: 10.1016/j.foodcont.2014.07.011
M.R. Hasan, T. Pulingam, J.N. Appaturi, et al., Anal. Biochem. 554 (2018) 34–43. doi: 10.1016/j.ab.2018.06.001
L. Xu, H. Peng, Y. Shao, B. Wang, F. Zhang, Sci. Agric. Sin. 51 (2018) 1192–1201.
L.J. Wang, T.Y. Liao, H. Zhou, et al., Anal. Biochem. 615 (2021) 114068. doi: 10.1016/j.ab.2020.114068
L.J. Wang, R.H. Wang, F. Chen, et al., Food Chem. 221 (2017) 776–782. doi: 10.1016/j.foodchem.2016.11.104
A. Fulgione, M. Cimafonte, B. Della Ventura, et al., Sci. Rep. 8 (2018) 16137. doi: 10.1038/s41598-018-34285-y
J.Y. Ding, Q.Q. Lin, J.M. Zhang, et al., Anal. Bioanal. Chem. 413 (2021) 3801–3811. doi: 10.1007/s00216-021-03332-5
C.J. Wei, M. Li, X.H. Zhao, Front. Microbiol. 9 (2018) 114068.
Y.F. Shen, L.Z. Xu, Y.B. Li, Compr. Rev. Food Sci. Food Saf. 20 (2021) 149–197. doi: 10.1111/1541-4337.12662
M.Y. Tsai, N. Creedon, E. Brightbill, et al., Appl. Phys. Lett. 111 (2017) 073701. doi: 10.1063/1.4986190
J.C. Soares, A.C. Soares, V.C. Rodrigues, et al., ACS Appl. Mater. Interfaces 11 (2019) 46645–46650. doi: 10.1021/acsami.9b19180
Q. Chen, F.C. Huang, G.Z. Cai, M.H. Wang, J.H. Lin, Sens. Actuators B: Chem. 258 (2018) 447–453. doi: 10.1016/j.snb.2017.11.087
L. Xue, R.Y. Guo, F.C. Huang, et al., Biosens. Bioelectron. 173 (2021) 112800. doi: 10.1016/j.bios.2020.112800
M. Xu, R.H. Wang, Y.B. Li, Talanta 148 (2016) 200–208. doi: 10.1016/j.talanta.2015.10.082
Y.C. Fu, Z. Callaway, J. Lum, et al., Anal. Chem. 86 (2014) 1965–1971. doi: 10.1021/ac402550f
L.P. Zhang, S. Zhou, L. Xie, et al., Small 17 (2021) 2100141. doi: 10.1002/smll.202100141
B. Kong, J. Tang, Y.Y. Zhang, et al., Nat. Chem. 8 (2016) 171–178. doi: 10.1038/nchem.2405
X.J. Liu, Y.C. Zhao, F. Li, Biosens. Bioelectron. 173 (2021) 2100141.
B. Ran, Y.L. Xianyu, M.L. Dong, et al., Anal. Chem. 89 (2017) 6114–6120.
Y.L. Xianyu, J. Wu, Y.P. Chen, et al., Angew. Chem. Int. Ed. 57 (2018) 7503–7507. doi: 10.1002/anie.201801815
X.H. Zhao, M. Li, Y. Liu, Microorganisms 7 (2019) 381. doi: 10.3390/microorganisms7100381
J.P. Ma, S.M.Y. Lee, C.Q. Yi, C.W. Li, Lab Chip 17 (2017) 209–226. doi: 10.1039/C6LC01049K
G. Xing, W. Zhang, N. Li, Q. Pu, J.M. Lin, Chin. Chem. Lett. (2021), doi: 10.1016/j.cclet.2021.08.073.
V.J. Shenoy, C.E. Edwards, M.E. Helgeson, M.T. Valentine, BioTechniques (2021), doi: 10.2144/btn-2021-0009.
A.G. Hadjigeorgiou, A.G. Boudouvis, G. Kokkoris, Chem. Eng. J. 414 (2021) 128775. doi: 10.1016/j.cej.2021.128775
J. Li, G.D. Xia, Y.F. Li, J. Chem. Technol. Biotechnol. 88 (2013) 1757–1765. doi: 10.1002/jctb.4044

Scheme 1 (a) The synthesis of the immune enzymatic probes. (b) The structure of the microfluidic chip. (c) The mechanism of the impedance biosensor for rapid and sensitivedetection of Salmonella typhimurium.

Figure 1 (a) The simulation on the micromixer. (b) The comparison of the micromixer with the straight channel. (c) The mixing effect of the blue ink and deionized water in the microfluidic chip. (d) The photos of inlet and outlet of the micromixer.

Figure 2 Concept proof of this impedance biosensor. (a) The impedance for different concentrations (1 μmol/L-10 mmol/L) of glucose (n = 3). (b) The impedance for different concentrations (1 μmol/L -10 mmol/L) of H2O2 (n = 3). (c) The linear relationship between the impedance and the concentration of gluconicacid (n = 3).

 扫一扫看文章

扫一扫关注我们
 DownLoad:
 下载:
下载:
