Figure 1.
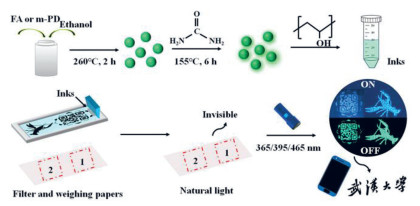
The schematic illustration for the fabrication of CDs and pattern printing (For interpretation of the references to color in this figure, the reader is referred to the web version of this article.).
Blue-to-green manipulation of carbon dots from fluorescence to ultralong room-temperature phosphorescence for high-level anti-counterfeiting
Youfusheng Wu , Xinyi Fang , Jiaqi Shi , Weijing Yao , Wei Wu

In order to cope with the impact of counterfeit goods on the market and safeguard the interests of consumers, it is very necessary to develop an advanced anti-counterfeiting technology [1-3]. The desirable strategy of encoding photoluminescence materials with multicolor and controllable emissions under different stimuli into a security system is beneficial for achieving high-level anti-counterfeiting. Carbon dots (CDs), a new class of photoluminescence (PL) material, have aroused much attention in the photonic anti-counterfeiting field owing to their superior PL properties, tunable emission, low toxicity, good stability, cost-effective and eco-friendly preparation, and so forth [4-7]. More importantly, CDs with tunable PL characteristics of fluorescence (FL) and room-temperature phosphorescence (RTP) are of great significance to construct high anti-counterfeiting level [8]. However, due to the influence of spin-forbidden, π-π stacking interactions, and aggregation, lots of CDs exhibit FL property with low quantum efficiency (QY) and short-term or even no RTP, which restricts their practical security application [9]. It is favored that incorporating CDs into a matrix (such as Polyvinyl alcohol (PVA), PU, clay, boric acid) is beneficial to address above shortcomings and achieve excellent FL and RTP [10-14]. Unfortunately, ultralong RTP lifetime over 10 s is still very difficult to obtain even CDs are fixed in matrixes [15, 16].
To obtain superior optical performances in CDs systems, plenty of molecular precursors are used to prepare CDs by a bottom-top way and the obtained CDs perform different optical properties owing to the effect of functional groups [17, 18]. It is worth noting that the C=N- and C=O-rich molecular precursors are beneficial to endow CDs with excellent optical properties because these functional groups on CDs surface provide new energy level structure. In addition, high reaction temperature (over 220 ℃) also show obvious positive influence on optical properties of CDs owing to high carbonization degree [19]. In this work, the m-phenylenediamine (m-PD) and folic acid (FA) were selected as carbon sources due to their significances in producing N-doped CDs with abundant C=N and C=O groups. As revealed in Fig. 1, the robust FA-CDs and m-PD-CDs were synthesized under high reaction temperature 260 ℃. Low-cost urea was used to immobilize functional groups on CDs surface, resulting in clearly visible blue FL as well as ultralong blue-green and green RTP (to naked eyes ~14 s) for m-PD-CDs and FA-CDs. Importantly, dual-mode security patterns with conversion of FL and RTP were obtained by directly screen-printing method, indicating that full designing on CDs for tunable optical emissions is in favor of the high-level anti-counterfeiting application.
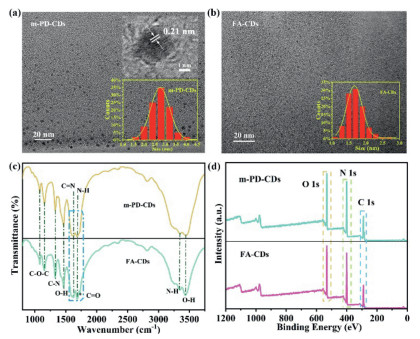
The TEM images and particle size distributions in Figs. 2a and b reveal that m-PD-CDs and FA-CDs nanoparticles depict uniform distributions with the average sizes of 2.8 nm and 1.7 nm based on a statistical result of 100 nanoparticles, respectively. High-solution TEM (HRTEM) in the inset of Fig. 2a indicates that the prepared sample possesses fine lattice fringes with a spacing of 0.21 nm, which is ascribed to the (100) facet of graphitic carbon [20]. As depicted in Fig. 2c, similar absorption bands are observed and corresponding attributions are recorded. The FA-CDs exhibits more obvious C=O stretching vibration band than the m-PD-CDs, which is originated from -COOH of the FA. Full XPS spectra in Fig. 2d indicates that the as-prepared m-PD-CDs and FA-CDs are composed of C, N and O elements. The C, N and O element contents for the m-PD-CDs and FA-CDs samples are 35.57%, 39.3% and 25.13, as well as 41.38%, 26.13% and 32.48%, respectively. The higher N content of the m-PD-CDs sample is ascribed to high N proportion from benzene ring and amidogen of the m-PD precursor. High-solution XPS of C, N and O elements for m-PD-CDs and FA-CDs samples are shown in Fig. S1 (Supporting information). Comparatively, the m-PD-CDs sample has one peak at 286.15 eV of C 1s for the C-N component and another peak at 401.2 eV for graphitic N. In addition, a peak at 533.25 eV for the O 1s is discovered in the FA-CDs sample. The FA-CDs sample performs higher C=O content (531.65 eV) than the m-PD-CDs [21-23]. The XPS results match well with the FTIR consequences and all of them are in accordance with precursor differences.
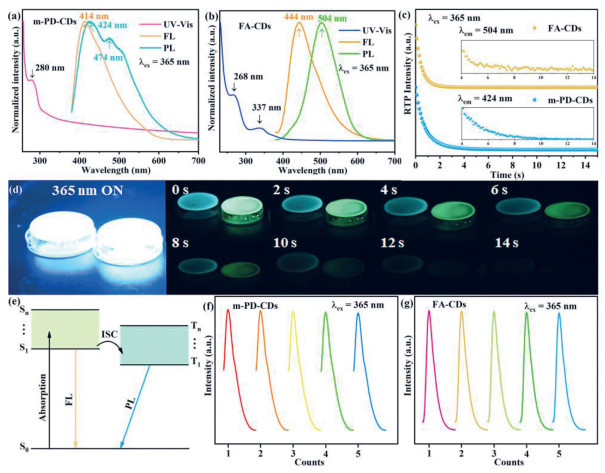
As revealed in Figs. 3a and b, the m-PD-CDs exhibit a clear absorption band peaking at 280 nm and another broadband absorption spreading to visible area, and the FA-CDs has two intense absorption peaks centered at 268 nm and 337 nm, which are ascribed to the π-π* transitions of C=C and C=N bonds and n-π* transitions of C=O bond [9, 24, 25]. The m-PD-CDs and FA-CDs samples both have blue FL emissions upon 365 nm excitation, peaking at 413 and 444 nm, respectively. Differences in PL emission, the m-PD-CDs exhibits blue-green RTP but the FA-CDs shows green RTP, which may be caused by the discrepant effect of interaction force of the C=N/C=O bonds and H atoms. As depicted in Fig. 3c, RTP decay spectra of m-PD-CDs and FA-CDs powders indicate that RTP decay lifetime of m-PD-CDs powders is longer than that of FA-CDs. Moreover, RTP (to naked eyes ~14 s) are obtained by monitoring the afterglow time of PVA films after removal of the 365 nm excitation (Fig. 3d). As shown in Fig. S2 (Supporting information), the m-PD-CDs and FA-CDs samples both perform excitation-dependent FL by increasing the excitation wavelength from 365 nm to 445 nm. Fig. 3e reveals the schematic illustration for FL and RTP emissions in the m-PD-CDs and FA-CDs systems. As excited by light sources, the energy is migrated from the S0 into the upper S1-n. FL emission is achieved through a radiation process back from the S1 to S0. For RTP emission, the intersystem crossing (ISC) process from the S1-n to T1-n is critical and then the energy transfer process from the T1 to S0 is responsible for RTP emission [26]. To assess the photostability of the two CDs, we tested FL spectra through an intermittent testing with an interval time of 2 min and a continuous testing with an increment of 10 min, as display in Figs. 3f and g, Figs. S3a and b (Supporting information). High intensity-retention is obtained even irradiated with 30 min continuously and then hardly decrease in FL intensity is demonstrated by intermittent testing results, indicating that the two CDs have excellent photostability.
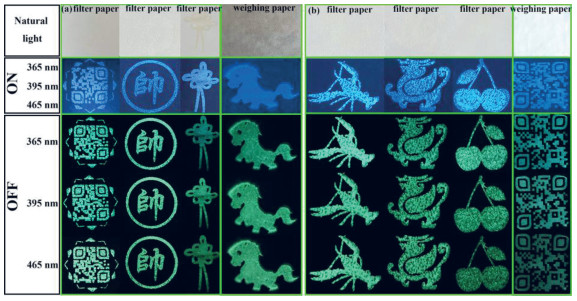
Inspired by excellent FL and RTP properties and photostability of m-PD-CDs and FA-CDs samples, we prepared security inks by separately incorporating m-PD-CDs and FA-CDs samples in PVA solution and then printed them on filter paper and weighing paper by screen-printing method (Fig. 1). In Figs. 4a and b, the printing patterns including QR code, Chinese character and Chinese knot on filter paper, and pony on weighing paper for m-PD-CDs, as well as crayfish, Kylin and cherries on filter paper and QR codes on weighing paper for FA-CDs are invisible to eyes under natural light. Interestingly, no matter which substrate is chosen, all of patterns can be observed with clearly visible blue emissions under the irradiation of 365, 395 and 465 nm lights, while RTP with visible green emissions are obtained after removal of the stimulations. The QR codes on filter paper and weighing paper in Fig. S4 (Supporting information), encoding information of Chinese characters and Chinese poetry, can be identified by a mobile phone (testing device: Honor V10), respectively. It reveals that the m-PD-CDs and FA-CDs samples with the couple of FL and RTP are beneficial to constructing high-level and identifiable anti-counterfeiting application.
In summary, two kinds of CDs carbonization from the FA and m-PD exhibit excellent FL and RTP based on a heating treatment of urea. Ultralong RTP (to naked eyes ~14 s) are obtained in the m-PD-CDs and FA-CDs samples. Tunable blue-to-green emissions from FL to RTP are achieved under the 365 nm, 395 nm and 465 nm excitation and removal of it. Comparatively, the FTIR, XPS and optical properties indicate that the selection of molecule precursors with different functional groups leads to different optical performances. Versatile security patterns with clear blue FL and green RTP emissions demonstrate that the m-PD-CDs and FA-CDs samples with controllable emissions have a wide application prospect in the field of high-level anti-counterfeiting.
The authors declare that they have no known competing financial interests or personal relationships that could have appeared to influence the work reported in this paper.
This work was supported by the Natural Science Foundation of Hubei Province for Distinguished Young Scholars (No. 2019CFA056), the Fundamental Research Funds for the Central Universities and Wuhan University and the Fundamental Research Funds for the Central Universities (No. 2042021kf0226).
Supplementary material associated with this article can be found, in the online version, at doi:10.1016/j.cclet.2021.04.040.
W.J. Yao, Q.Y. Tian, W. Wu, Adv. Opt. Mater. 7(2018) 1801171. doi: 10.1002/adom.201801171
P. Kumar, S. Singh, B.K. Gupta, Nanoscale 8(2016) 14297-14340. doi: 10.1039/C5NR06965C
H.L. Liu, J.H. Xu, H. Wang, et al., Adv. Mater. 31(2019) 1807900. doi: 10.1002/adma.201807900
N. Thirumalaivasan, S.P. Wu, ACS App. Bio. Mater. 3(2020) 6439-6446. doi: 10.1021/acsabm.0c00868
L.Q. Bai, N. Xue, Y.F. Zhao, et al., Nano Res. 11(2018) 2034-2045. doi: 10.1007/s12274-017-1820-z
W.D. Li, Y. Liu, B.Y. Wang, et al., Chin. Chem. Lett. 30(2019) 2323-2327. doi: 10.1016/j.cclet.2019.06.040
H.Q. Song, X.J. Liu, B.Y. Wang, et al., Sci. Bull. 64(2019) 1788-1794. doi: 10.1016/j.scib.2019.10.006
S. Ghosh, H. Ali, N.R. Jana, ACS Sustain. Chem. Eng. 7(2019) 12629-12637.
H.Y. Yang, Y.L. Liu, Z.Y. Guo, et al., Nat. Commun. 10(2019) 1789. doi: 10.1038/s41467-019-09830-6
W. Li, W. Zhou, Z.S. Zhou, et al., Angew. Chem. Int. Ed. 58(2019) 7278-7283. doi: 10.1002/anie.201814629
Y.C. Deng, P. Li, H.Y. Jiang, et al., J. Mater. Chem. C 7(2019) 13640-13646. doi: 10.1039/C9TC04863D
J. Tan, R. Zou, J. Zhang, et al., Nanoscale 8(2016) 4742-4747. doi: 10.1039/C5NR08516K
H.L. Gou, Y.F. Liu, G.Y. Zhang, et al., Nanoscale 11(2019) 18311-18319. doi: 10.1039/C9NR05561D
K. Jiang, Y.H. Wang, C.Z. Cai, H.W. Lin, Chem. Mater. 29(2017) 4866-4873. doi: 10.1021/acs.chemmater.7b00831
Q.J. Li, M. Zhou, Q.F. Yang, et al., Chem. Mater. 28(2016) 8221-8227. doi: 10.1021/acs.chemmater.6b03049
K. Jiang, L. Zhang, J.F. Lu, et al., Angew. Chem. Int. Ed. 55(2016) 7231-7235. doi: 10.1002/anie.201602445
P. Yang, Z.Q. Zhu, T. Zhang, et al., Carbon 146(2019) 636-649. doi: 10.1016/j.carbon.2019.02.028
S.Y. Lu, L.Z. Sui, J.J. Liu, et al., Adv. Mater. 29(2017) 1603443. doi: 10.1002/adma.201603443
K. Jiang, S.Z. Hu, Y.C. Wang, et al., Small 16(2020) 2001909. doi: 10.1002/smll.202001909
F. Yan, Y. Jiang, X. Sun, et al., Nano Res. 13(2019) 52-60. doi: 10.1007/s12274-019-2569-3
H. Wang, P. Haydel, N. Sui, et al., Nano Res. 13(2020) 2492-2499. doi: 10.1007/s12274-020-2884-8
J.J. Liu, S.Y. Lu, Q.L. Tang, et al., Nanoscale 9(2017) 7135-7142. doi: 10.1039/C7NR02128C
B.Y. Wang, J. Li, Z.Y. Tang, et al., Sci. Bull. 64(2019) 1285-1292. doi: 10.1016/j.scib.2019.07.021
H. Ding, J.S. Wei, P. Zhang, et al., Small 14(2018) 1800612. doi: 10.1002/smll.201800612
Z.G. Wang, B.S. Fu, S.W. Zou, et al., Nano Res. 9(2016) 214-223. doi: 10.1007/s12274-016-0992-2
K. Jiang, Y.H. Wang, Z.J. Li, H.W. Lin, Mater. Chem. Front. 4(2020) 386-399. doi: 10.1039/C9QM00578A

Figure 1 The schematic illustration for the fabrication of CDs and pattern printing (For interpretation of the references to color in this figure, the reader is referred to the web version of this article.).

Figure 2 (a) The TEM image (the insets: HRTEM and size distribution) of m-PD-CDs. (b) The TEM image (the inset: size distribution) of FA-CDs. (c) FTIR spectra of m-PD-CDs and FA-CDs. (d) Full XPS spectra of m-PD-CDs and FA-CDs.

Figure 3 (a, b) The UV–vis, FL and PL spectra for m-PD-CDs and FA-CDs under 365 nm excitation, respectively. (c) RTP decay spectra of m-PD-CDs and FA-CDs powders. (d) RTP decay photographs of PVA films for m-PD-CDs (left) and FA-CDs (right). (e) The schematic illustration for FL and PL emissions. (f, g) FL spectra tested with an interval time of 2 min for m-PD-CDs and FA-CDs (For interpretation of the references to color in this figure, the reader is referred to the web version of this article.).

 扫一扫看文章

扫一扫关注我们
 DownLoad:
 下载:
下载:
