Citation:
Meiling Shui, Chao Huang, Peiyu Ma, Wenjie Li, Qun He, Wenlong Wu, Yisheng Tan, Jun Bao. Accelerating C2+ alcohols synthesis from syngas by simultaneous optimizations of CO dissociation and chain growth over CuCo alloy catalyst[J]. Chinese Chemical Letters,
2021, 32(7): 2203-2206.
doi:
10.1016/j.cclet.2020.12.022
Accelerating C2+ alcohols synthesis from syngas by simultaneous optimizations of CO dissociation and chain growth over CuCo alloy catalyst
English
Accelerating C2+ alcohols synthesis from syngas by simultaneous optimizations of CO dissociation and chain growth over CuCo alloy catalyst
National Synchrotron Radiation Laboratory, University of Science and Technology of China, Hefei 230029, China
b.
Hefei National Laboratory for Physical Sciences at the Microscale, Key Laboratory of Strongly-Coupled Quantum Matter Physics of Chinese Academy of Sciences, Key Laboratory of Surface and Interface Chemistry and Energy Catalysis of Anhui Higher Education Institutes, Department of Chemical Physics, University of Science and Technology of China, Hefei 230026, China
c.
State Key Laboratory of Coal Conversion, Institute of Coal Chemistry, Chinese Academy of Sciences, Taiyuan 030001, China
Received Date:
13 September 2020 Accepted Date:
08 December 2020 Revised Date:
12 November 2020 Available Online:
15 July 2021
Abstract:
With regard to the reaction of higher alcohol synthesis (HAS), the optimizations of activity and selectivity towards C2+ alcohol are restricted by the improper equilibrium in two different CO activation pathways and chain growth capacity. Herein, we find that delibrately controlling the compositions of catalysts is an effective strategy to achieve the equilibrium of CO activation pathways and promote the chain growth. As a result, the optimized Cu0.25Co0.75 alloy catalyst can achieve a large proportion of higher alcohol in alcohol products (C2+OH/MeOH = 4.40), together with high CO conversion of 71.27% and space-time-yield of 147.65 g kg−1 h−1. The mechanistic studies suggest that the good performance of Cu0.25Co0.75 catalyst is attributed to the synergistic effect between alloyed Cu and Co.
Higher alcohols (C2+ alcohols) have attracted worldwide interest by virtue of their promising applications in transportation fuels, gasoline additives and chemical intermediates. Generally, higher alcohols are produced from the hydration of corresponding petroleum-derived alkenes [1-3]. However, the scarcity of petroleum resource impedes the sustainable production of higher alcohols in the future. It is highly desirable to develop an alternative pathway to yield higher alcohols [4-6]. In this regard, catalyzing the syngas derived from coal, natural gas, or renewable biomass gas into higher alcohols is regarded as a promising pathway. Nevertheless, the formation of some by-products, such as methanol and hydrocarbons, is inevitable [7, 8]. It is considered that the higher alcohols is generally formed via the CO insertion mechanism, in which the adsorbed CO would be dissociated to form methylene species (−CH2−), followed by the growth of alkyl groups [9-11].
Generally, the CuCo alloy catalyst is considered as one of the most active non-noble metal-based catalysts for higher alcohol synthesis (HAS) reaction [12]. It is well established that Cu is responsible for the non-dissociative adsorption and insertion of CO, while Co works as the active site for CO dissociation and chain growth [12]. What is more, it is thought that high dispersion and intimate contact of metals could boost their synergetic process, thereby favoring the formation of C2+ alcohols [13, 14]. For example, the palygorskite supported Cu-Fe-Co catalyst could exhibit the high conversion of CO (69.1%), while the proportion of higher alcohols in alcohol products was only 57.5% [13]. The Mn-Al oxide supported CuCo alloy catalyst (3Cu-5Co/(Mn-Al)) could exhibit the highest catalytic performance with a CO conversion of 33.4% and C2+ alcohols selectivity towards total alcohols of 57.3% [14]. However, the previously reported bare CuCo catalysts could only achieve the low selectivity towards C2+ alcohols.
In this work, we have synthesized CuCo catalysts by the co-reduction method. The Cu/Co ratios of catalysts were deliberately adjusted. As a result, the optimized Cu0.25Co0.75 catalyst has exhibited the superior HAS activity with high space-time-yield (STY) of total alcohol (147.65 g kg−1 h−1). In particular, the proportion of C2+OH products was 81.5% compared to the total alcohols. The structures of catalysts were characterized by means of advanced techniques and the structure-performance relationship was discussed.
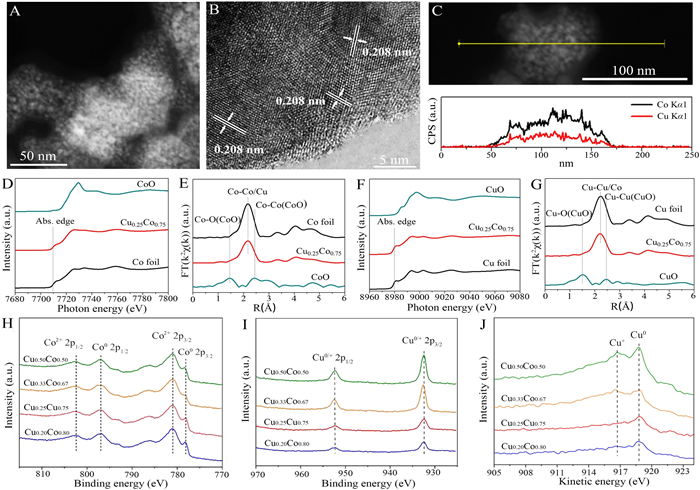
The CuCo precursor was prepared via a wet-chemistry reduction method, and the final CuCo alloy samples were obtained from the activation of precursors at 300 ℃ for 4 h in H2 atmosphere. All of the obtained samples exhibited the consistent X-ray diffraction (XRD) patterns similar to CuCo alloy (PDF# 50-1452, Fig. S1 in Supporting information). Obviously, activation treatment has improved the crystallinity of CuCo. The morphology of CuCo catalysts with different Cu/Co ratios were observed by scanning electron microscopy (SEM). As shown in Fig. S2 (Supporting information), all the CuCo particles show the stacked structure. Furthermore, transmission electron microscopy (TEM) observation shows these particles consist of fine particles with size less than 10 nm (Fig. 1A). High-resolution TEM (HRTEM) image of Cu0.25Co0.75 catalyst shows the lattice parameter of 0.208 nm, which corresponds to the (110) plane of the face-centered-cubic (fcc) CuCo alloy (Fig. 1B). The elemental mapping analysis demonstrates the homogeneous distribution of Cu and Co in the entire sample (Fig. S3 in Supporting information). The consistent line scan intensity further confirm the CuCo alloy structure and no obvious phase segregation occurs (Fig. 1C) [15]. The actual ratios of Cu/Co in the prepared samples are evaluated by inductively coupled plasma-atomic emission spectrometry (ICP-AES, Table S1 in Supporting information).
Figure 1
Figure 1.
(A) TEM, (B) HRTEM, and (C) line-scan profile of Cu0.25Co0.75 catalyst. (D) Co K-edge XAFS and (E) EXAFS spectra of Cu0.25Co0.75. (F) Cu K-edge XAFS and (G) EXAFS spectra of Cu0.25Co0.75. High-resolution XPS of (H) Co 2p and (I) Cu 2p and (J) Cu Auger LMM spectra of CuCo alloy catalysts.
Taking Cu0.25Co0.75 as an example, its fine structure was further analyzed via the X-ray absorption fine structure spectroscopy (XAFS). In Fig. 1D, the absorption edge at Co K edge of Cu0.25Co0.75 is close to that of Co foil (7709 eV), which indicates the metallic states of Co in Cu0.25Co0.75. This conclusion can be further confirmed by the similar oscillation curves between Cu0.25Co0.75 and Co foil (Fig. S4A in Supporting information). The Fourier-transformed extended XAFS (EXAFS) spectrum of Cu0.25Co0.75 just shows one peak at ~2.2 Å, which corresponds to the Co-Co/Cu bonds in Cu0.25Co0.75 (Fig. 1E). No peaks related to the bonds between Co and nonmetals can be probed, further demonstrating the metallic phase of Cu0.25Co0.75. Similar results are also observed at the Cu K-edge of Cu0.25Co0.75 (Figs. 1F and G, Fig. S4B in Supporting information).
To obtain the surface information of samples, X-ray photoelectron spectroscopy (XPS) was performed. The survey profile shows the coexistence of Cu and Co in the sample (Fig. S5 in Supporting information). High-resolution XPS spectra of Co 2p in Fig. 1H shows two prominent peaks at ~802 eV and ~797 eV, which are assigned to the Co2+ 2p1/2 and Co0 2p1/2, respectively. The peaks at ~781 eV and ~778 eV should be assigned to the Co2+ 2p3/2 and Co0 2p3/2, respectively. For Cu 2p XPS spectra of samples, the binding energies at ~952 eV and ~932 eV should correspond to the Cu0/+ 2p1/2 and 2p3/2, respectively (Fig. 1I). To distinguish the Cu0 and Cu+, the Cu Auger LMM analysis was carried out. It can be seen that the Cu0 is prominent, together with less Cu+ (Fig. 1J). The calculated Cu/Co ratios according to the XPS results were listed in Table S2 (Supporting information).
The catalytic HAS performances of the as-prepared CuCo catalysts were evaluated in a fixed-bed reactor under 3.0 MPa of syngas (60 vol% H2, 30 vol% CO and 10 vol% N2) with gas hourly space velocity (GHSV) of 3900 h−1. Table 1 shows the effect of the reaction temperature on the catalytic performances. The CO conversion and total alcohol STY could achieve the maximum values at 250 ℃. The further increasing of the reaction temperature could result in the production decrease of alcohols. In this work, the appropriate reaction temperature (250 ℃) could achieve the balance bewteen reaction rate and thermodynamics. Finally, the optimal performance can be obtained. Both CO conversion and alcohol selectivity are calculated based on a CO2-free basis.
Table 1
Table 1.
Effect of reaction temperature on the catalytic performance of Cu0.25Co0.75 catalyst.a, b
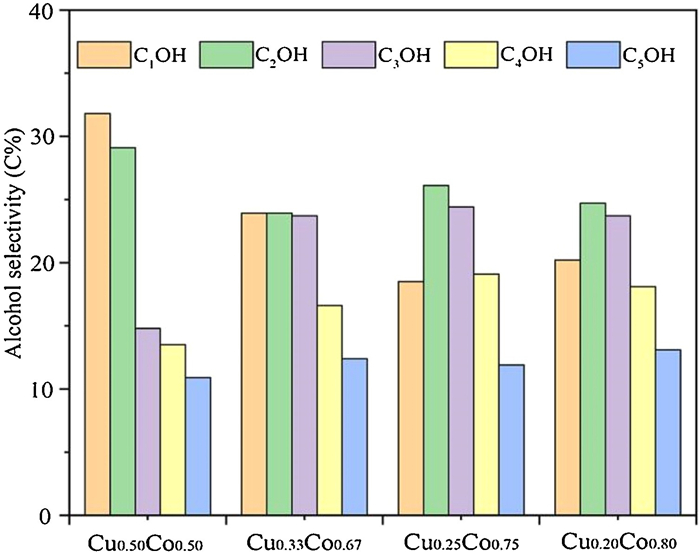
The effect of Cu/Co ratios on the HAS performance is shown in Table 2. The catalytic behaviors show a volcano-shaped function for the ratios. Obviously, the Cu0.25Co0.75 catalyst has exhibited the best performance for HAS. Regarding Cu0.25Co0.75 catalyst, the STY of total alcohols reaches up to 147.65 g kg−1 h−1 with a CO conversion of 71.27% under the mild conditions of 3.0 MPa, 250 ℃ and 3900 h−1. The distributions of alcohol products over catalysts with different Cu/Co ratios are presented in Fig. 2. It can be seen that the Cu0.25Co0.75 catalyst has achieved the highest C2+OH/MeOH ratio of 4.40. These results suggest that the dissociation adsorption of CO over Co species plays an important role in the synthesis of higher alcohols.
Table 2
Table 2.
CO hydrogenation over the catalysts as a function of Cu/Co ratios.a, b
The catalytic performances of some representative catalysts reported are listed in Table S3 (Supporting information). Taking activity and selectivity into considerations, CuCo alloy catalysts prepared in our work show much better catalytic performance in terms of the conversion of CO and the selectivity towards C2+ alcohols.
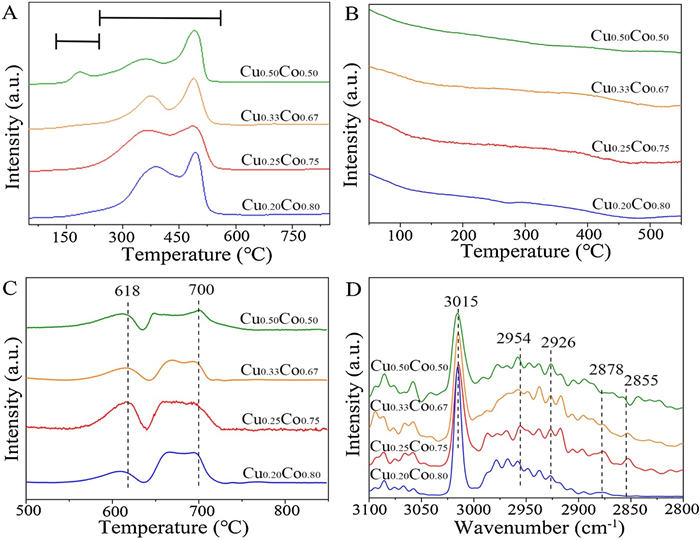
The temperature programmed reduction (TPR) experiments of precursors in H2 atmosphere (H2-TPR) were carried out to explore the reduction information. As shown in Fig. 3A, the peak between 140 ℃ and 220 ℃ is due to the reduction of CuOx to Cu. It is obvious that the peak intensity of CuOx-to-Cu reduction strengthens with the increase of Cu amount. These results are also consistent with the XPS and Auger analyses above. The peaks locate at 220−550 ℃ region should be attributed to the reduction of CoOx to Co [15]. It is worth noting that the Cu0.25Co0.75 catalyst has achieved the lowest reduction temperature among them. This should be attributed to the interaction between Cu and Co by forming CuCo alloy phase. The formed metallic structure of CuCo alloy has also been confirmed by the XAFS resluts (Figs. 1D–G). The CuCo alloy structure was proved to be the catalytic active sites in HAS [3].
Figure 3
Figure 3.
TPR profiles of H2 (A), TPD profiles of CO with temperature of 50-550 ℃ (B), 500-850 ℃ (C), and in-situ DRIFTS spectra (D) for CuCo catalysts with varying molar ratios of Cu/Co.
The normalized temperature programmed desorption (TPD) curves in CO atmosphere (CO-TPD) of the pure Cu and pure Co catalysts are shown in Fig. S6 (Supporting information). For pure Cu, the desorption temperature of CO is less than 410 ℃; while pure Co exhibited a higher desorption temperature of CO more than 500 ℃. TPD curve of the H2-reduced catalysts in He without CO pre-adsorption showed no obvious desorption (Fig. S7 in Supporting information). CO-TPD curves with different Cu/Co ratios are shown in Figs. 3B and C. The low-temperature peaks of the catalysts at about 50−500 ℃ are attributed to the desorption of CO over Cu species (Fig. 3B), and the high-temperature peaks at more than 500 ℃ can be ascribed to the dissociation of the adsorbed CO over Co species (Fig. 3C). When the ratios of Cu/Co increase, the desorbed peak areas of CO-species over Cu species are barely changed, and the slight adsorption of CO occurs on all catalysts. The observed desorption peaks at high temperature indicates that the strong CO adsorption mainly occurs on the Co sites which should contribute to the dissociative adsorption of CO. Obviously, by adjusting the amounts of Cu in catalyst, the Cu0.25Co0.75 catalyst finally exhibits the largest desorption peak area, which implies the non-dissociative adsorption of more CO on Cu0.25Co0.75 catalyst. It is agreed with the obtained highest C2+OH/MeOH ratio for Cu0.25Co0.75 catalyst. In a word, the adsorption of CO over catalysts can be adjusted by regulating the Cu/Co ratios in HAS, thereby controlling the overall catalytic performance [16-18].
To investigate the average carbon chain length and carbon chain growth capacity of hydrocarbon molecules produced, in-situ DRIFTS analyses were performed. As shown in Fig. 3D, the peak at 3015 cm−1 should be related to the formation of gaseous methane (CH4), and the peaks at 2954 cm−1 and 2926 cm−1 should represent the asymmetric CH stretching vibration of the methyl species (−CH3) and methylene species (−CH2−), respectively. The peak at 2878 cm−1 should be attributed to the symmetric CH stretching vibration of the methyl species (−CH3), and the peak at 2855 cm−1 shoud be assigned to the symmetric CH stretching vibration of methylene species (−CH2−). The representative peak area of −CH2− species locates at 2925−2930 cm−1, which signifies the asymmetric extension of −CH2− species. The peak area of −CH3 species is at 2955−2960 cm−1, which represents the asymmetric extension of −CH3 species. The following formula is used to calculate the growth capacity of the carbon chain (Eq. 1):
(1)
The calculated peak area ratios are shown in Table S4. Obviously, Cu0.25Co0.75 catalyst has achieved the highest peak area ratio of (−CH2−)/(−CH3) of 0.8226. The CH2 group can be coupled with the dissociative species of CO to increase the length of the carbon chain. The above results indicate that the growth ability of carbon chain is strongest over Cu0.25Co0.75 catalyst [19-21]. Finally, the fine structures of spent Cu0.25Co0.75 catalyst were explored by XAFS. As can be seen in Fig. S8 (Supporting information), there are no obvious changes of absorption edge and peaks for fresh and spent Cu0.25Co0.75, suggesting the preservation of the robust CuCo alloy structure even after reaction.
In summary, we have successfully developed the CuCo catalysts with varying Cu/Co ratios. As experimentally analyzed, the Cu0.25Co0.75 catalyst with Cu/Co molar ratio of 0.30 has achieved the simultaneous optimization of activity and selectivity towards higher alcohols synthesis in HAS. Based on mechanistic studies, the high activity of Cu0.25Co0.75 catalyst should be attributed to the strong dissociation adsorption of CO and the strong carbon chain growth ability. This work highlighted a promising strategy to design active and selective catalysts for HAS.
Declaration of competing interest
The authors declare that they have no known competing financial interests or personal relationships that could have appeared to influence the work reported in this paper.
Acknowledgments
This work was supported by National Key Research and Development Program of China (Nos. 2017YFA0403402, 2019YFA0405602), National Natural Science Foundation of China (Nos. 21673214, U1732272) and Foundation of State Key Laboratory of Coal Conversion (No. J20-21-902).
Y. Xiang, R. Barbosa, N. Kruse, et al., ACS Catal. 4(2014) 2792-2800. doi: 10.1021/cs500696z
Figure 1
(A) TEM, (B) HRTEM, and (C) line-scan profile of Cu0.25Co0.75 catalyst. (D) Co K-edge XAFS and (E) EXAFS spectra of Cu0.25Co0.75. (F) Cu K-edge XAFS and (G) EXAFS spectra of Cu0.25Co0.75. High-resolution XPS of (H) Co 2p and (I) Cu 2p and (J) Cu Auger LMM spectra of CuCo alloy catalysts.
Figure 3
TPR profiles of H2 (A), TPD profiles of CO with temperature of 50-550 ℃ (B), 500-850 ℃ (C), and in-situ DRIFTS spectra (D) for CuCo catalysts with varying molar ratios of Cu/Co.

 DownLoad:


 下载:
下载:


