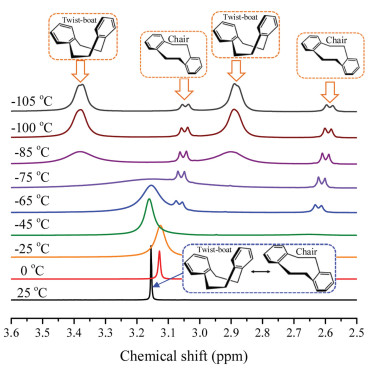
Figure 1.
Temperature-dependent 1H NMR (MHz) spectra of the methylene protons of DBCOD for its related conformation state in twist-boat (TB) and chair (C) forms.
Influence of conformational change of chain unit on the intrinsic negative thermal expansion of polymers
Qiangsheng Sun , Ke Jin , Yuhui Huang , Jia Guo , Thanyada Rungrotmongkol , Phornphimon Maitarad , Changchun Wang

Most materials exhibit positive thermal expansion (PTE), which may lead to deterioration and ultimately device failure due to the stress during temperature cycling [1]. Negative thermal expansion (NTE), as a counterintuitive thermophysical behavior, can be used to tune the coefficient of thermal expansion (CTE) [2, 3]. Up to now, researchers have paid more attention to inorganic materials or small organic molecules during the design and explore of NTE materials, such as oxides [4, 5, 6], cyanides [7, 8, 9, 10], zeolites [11, 12], organic crystalline [13, 14, 15], perovskites [16, 17] and metal-organic framework (MOFs) [18, 19, 20]. The intrinsic NTE polymers have rarely reported, even though practical applications of polymeric materials are limited because of their high positive CTE values [21].
In our early work, a new kind of crosslinked polyarylamide containing dibenzocyclooctadiene (DBCOD) unit was prepared, and we found it had unconventional giant NTE behavior attributed to conformational change of DBCOD [22]. When the temperature is low, DBCOD units mainly present twist-boat (TB) conformation [23, 24, 25], and after absorbing energy, most of them change into the chair (C) conformation. Then, we incorporated carbon nanotubes into the polyacrylamide and reduced crystallinity to enhance the NTE behaviour [26, 27]. By adjusting the amount of DBCOD units, we obtained polymers with negative, zero and positive coefficients of thermal expansion (CTE) [28].
Recently, we directly synthesized a monomer containing DBCOD unit and prepared the first linear polymer that displayed NTE behaviour [29]. The successful synthesis of DBCOD monomer, which inspired us a lot, suggested that we were able to design DBCOD monomers with various functional groups to be assembled into kinds of polymeric materials, extremely expanding the range of applications of NTE materials.
However, in the following work, we found that only a small portion of polymers showed NTE effect, while the majority of polymers did not have NTE behaviors in spite of containing DBCOD units. It was speculated that this phenomenon was due to the fact that the conformation of DBCOD units in these polymers did not undergo a large-scale transformation, and the TB conformation was still dominant after the temperature increased. Our preliminary experimental results found that the relative energy of TB and C conformations would change when substituent groups were introduced in the benzene ring of DBCOD. Here, in order to investigate the inherent law, we designed and synthesized a series of DBCOD derivatives to study the relationship between DBCOD derivative's structure and NTE property of related polymer. After synthesis and characterization, we calculated the related thermodynamic data through density-functional theory (DFT) calculations and then predicted their temperature-dependent expansion behaviours.
For the structures of DBCOD, the coexistence of TB and C conformations can be distinguished by temperature-dependent 1H NMR. The 1H NMR spectra of the methylene protons of DBCOD in the range of −105 ℃ to 25 ℃ in CD2Cl2-CS2 (4:1) is shown in Fig. 1. There is a single signal at δ 3.15 ppm between 0 and 25 ℃, which means the quick transform between TB and C. With temperature decrease, the single signal becomes broader, which means the transform speed decrease. When the temperature decreases to −65 ℃, new sets of peaks (δ 3.07 ppm, δ 3.05 ppm, δ 2.62 ppm, δ 2.60 ppm) appear. TB conformation has two enantiomers that can be distinguished as the TB signal splits into doublet below −85 ℃. At −105 ℃, there is a 83:17 ratio of the two sets of signals: a singlet for TB (δ 3.38 ppm, δ 2.89 ppm) and AA'BB' for C (δ 3.06 ppm, δ 3.04 ppm, δ 2.60 ppm, δ 2.58 ppm), which indicates that TB conformation is the preferred conformation with lower relative energy. Assuming that the relative free energy of TB conformation is 0kcal/mol, the free energy of C conformation is -0.1, -0.2 and -0.3kcal/mol at temperature of 25, 100 and 200 ℃, respectively, which is very close to the energy of TB conformation (Fig. S1 in Supporting information).
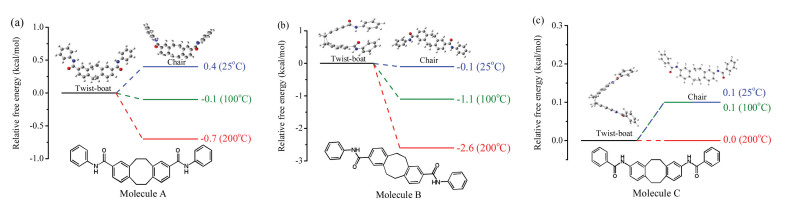
Then, we designed and synthesized six DBCOD-containing molecules with different substituent groups (Molecules A-F, the detailed information was listed in Supporting information) to figure out their conformational relative energies at different temperatures. Molecule A is a cis-amide-containing DBCOD derivative, while Molecule B is a trans-amide-containing DBCOD derivative. Compared to Molecule A, the position of N-H and C=O units of amide group in Molecule C is interchanged. Instead, Molecules D, E, and F are connected with the benzene ring, azo group and ester group, respectively.
As illustrated in Fig. 2, the two conformations of Molecule A and B will undergo interconversion as the temperature rises. The relative free energy of C conformation in Molecule A at 25 ℃ is greater than that of TB conformation (Fig. 2a), so TB conformation is dominant at room temperature [29]. When temperature increases to 100 or 200 ℃, the relative free energy of C conformation of Molecule A is less than that of TB conformation, indicating that the optimal conformation has transformed from TB to C at high temperature. With regard to Molecule B, the relative free energy of C conformation is lower than that of TB conformation at all calculated temperatures, suggesting that the C conformation is preferential conformation at room temperature. With increasing temperature, the proportion of C conformation will enhance as well. Differentially for Molecule C, the free energy of C form is equal to or higher than TB form at all studied temperatures. This data hint that TB should be the dominant form. All above results mean that the substituent groups have obviously influence on the conformer's free energy and the dominant form.
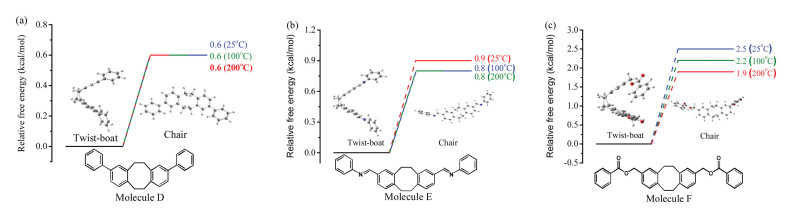
In according with this research line, we further synthesized another series of DBCOD derivatives, and their structure information could be found in Fig. 3. From this figure, interestingly the relative free energy of C form is always much higher than that of TB form at 25, 100, 200 ℃, respectively, which suggests that the remarkable conformational change from TB to C cannot be taken place as temperature goes up.
The detailed relevant theoretical thermodynamic data and volumes of the two conformations of DBCOD and its derivatives were listed in Table 1. The volumes of the two conformations were calculated in terms of the smallest cube that could be inserted according to DFT calculations. It can be seen from volume change in the last two columns that C conformations of Molecule A and Molecule F have smaller volume than their TB conformations. It can be speculated that, for thermal contracting DBCOD derivatives, two conditions should be met, TB conformation turns into C conformation and the volume of C conformation is smaller than that of TB conformation as the temperature increases. For Molecule B, although conformational transformation is able to proceed, the volume of C form is bigger than that of TB form, which is not good for the thermal contraction. For Molecule F, the volume of C form is smaller than that of TB form, but the free energy prohibits the conformational transformation from TB to C. Only Molecule A, which can undergo conformation change and its C form has a smaller volume than TB form, has a negative thermal expansion characteristic. From the above experimental results, we can find that the conformational change of DBCOD unit and the conformational volume are closely related to the type of substituent in the benzene ring of DBCOD.
 DownLoad:
CSV
DownLoad:
CSV

|
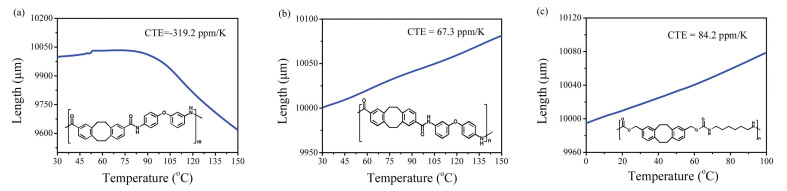
To verify above theoretical results, the related polymers of PA-cis-DBCOD, PA-trans-DBCOD and PU-cis-DBCOD were prepared based on the structures of Molecules A, B and F (Fig. 4). According to the theoretical calculation, the polymer containing Molecule A units (PA-cis-DBCOD) should be thermal shrinkage, while the polymer containing Molecule B (PA-trans-DBCOD) and Molecule F (PU-cis-DBCOD) structure units should show normal thermal expansion. In our experiments, the related polymer powders were dissolved in NMP, and then dripped them onto the silicon wafer substrates. After the solution evaporated, the polymer films were peeled off for thermomechanical analyzer (TMA) test. The TMA curves of three polymers were shown in Fig. 4. The polyacrylamide of PA-cis-DBCOD was obtained by condensation of cis-diacid DBCOD derivative and diamine monomer (Supporting information, 4.1). From the TMA curve, the average thermal expansion coefficient was -319.2 ppm/K within the range of 30~150 ℃, showing the significant negative thermal expansion (Fig. 4a) [29]. The polyarylamide of PA-trans-DBCOD was synthesized by condensation polymerization of trans-diacid DBCOD derivative and diamine monomer (Supporting information, 4.1), and its TMA curve showed that the average thermal expansion coefficient was 67.3 ppm/K within the same temperature range, indicating the normal thermal expansion (Fig. 4b). For the polyurethane of PU-cis-DBCOD obtained by dihydroxymethyl derivative from Molecule F and diisocyanate (Supporting information, 4.2), the average thermal expansion coefficient derived from its TMA curve was 84.2 ppm/K within the range of 0~100 ℃ (Fig. 4c), showing normal thermal expansion as prediction.
In summary, we have calculated the relative energy and volume for the C and TB conformers of DBCOD molecule and its derivatives based on DFT. Our experimental results suggested that two conditions should be met for the thermal contracting DBCOD derivatives as follows: (i) the TB conformation can turn into C conformation as the temperature increases, and (ii) the volume of C conformation is smaller than that of TB conformation. The TMA curves of the related polymers have proven our calculated results. PA-cis-DBCOD displayed thermal contraction, whilst PA-trans-DBCOD and PU-cis-DBCOD showed normal thermal expansion. The thermal expansion properties of the three polymers are in line with the DFT predicted results, which further verifies the positive role of the theoretical calculation, i.e., DFT calculation can give us more information about the thermal behaviour of the polymers. In other words, the calculations enable us to predict and explore new NTE polymers for the specific applications.
The authors declare that they have no known competing financial interests or person relationships that could have appeared to influence the work reported in this paper.
This work was supported by the National Natural Science Foundation of China (Nos. 51633001, 51721002 and 51873040), National Key R&D Program of China (No. 2016YFC1100300) and Shanxi Yanchang Petroleum Group. P. Maitarad thanks the Center of Excellence in Computational Chemistry for facility and computing resources.
Supplementary material related to this article can be found, in the online version, at doi: https://doi.org/10.1016/j.cclet.2020.09.046.
W. Miller, C. W. Smith, D. S. Mackenzie, et al., J. Mater. Sci. 44 (2009) 5441-5451. doi: 10.1007/s10853-009-3692-4
J. Chen, L. Hu, J. X. Deng, et al., Chem. Soc. Rev. 44 (2015) 3522-3567.
K. Takenaka, Sci. Technol. Adv. Mater. 13 (2012) 013001. doi: 10.1088/1468-6996/13/1/013001
T. A. Mary, J. S. O. Evans, T. Vogt, et al., Science 272 (1996) 90-92.
Y. P. Zhang, M. McDonnell, S. A. Calder, et al., J. Am. Chem. Soc. 141 (2019) 6310-6317. doi: 10.1021/jacs.9b00569
N. Shi, A. Sanson, Q. L. Gao, et al., J. Am. Chem. Soc. 142 (2020) 3088-3090. doi: 10.3390/ijms21093088
A. L. Goodwin, M. Calleja, M. J. Conterio, et al., Science 319 (2008) 794-797. doi: 10.1126/science.1151442
J. E. Auckett, A. A. Barkhordarian, S. H. Ogilvie, et al., Nat. Commun. 9 (2018) 4873.
S. J. Hibble, A. M. Chippindale, A. H. Pohl, et al., Angew. Chem. Int. Ed. 46 (2007) 7116-7118. doi: 10.1002/anie.200701246
Q. L. Gao, J. Q. Wang, A. Sanson, et al., J. Am. Chem. Soc. 142 (2020) 6935-6939. doi: 10.1021/jacs.0c02188
D. A. Woodcock, P. Lightfoot, L. A. Villaescusa, et al., Chem. Mat. 11 (1999) 2508-2514.
L. A. Villaescusa, P. Lightfoot, S. J. Teat, et al., J. Am. Chem. Soc. 123 (2001) 5453-5459.
D. Das, T. Jacobs, L. J. Barbour, Nat. Mater. 9 (2010) 36-39. doi: 10.1038/nmat2583
A. D. Fortes, E. Suard, K. S. Knight, Science 331 (2011) 742-746. doi: 10.1126/science.1198640
Z. S. Yao, H. X. Guan, Y. Shiota, et al., Nat. Commun. 10 (2019) 4805.
M. Keshavarz, M. Ottesen, S. Wiedmann, et al., Adv. Mater. 31 (2019) 1900521. doi: 10.1002/adma.201900521
W. T. Chen, C. Ablitt, N. C. Bristowe, et al., Chem. Commun. 2019, 55 (20), 2984-2987. doi: 10.1039/c8cc09614g
D. Dubbeldam, K. S. Walton, D. E. Ellis, et al., Angew. Chem. Int. Ed. 46 (2007) 4496-4499. doi: 10.1002/anie.200700218
Z. H. Chen, G. Gallo, V. A. Sawant, et al., Angew. Chem. Int. Ed. 59 (2020) 833-838. doi: 10.1002/anie.201911632
S. J. Baxter, A. Schneemann, A. D. Ready, et al., J. Am. Chem. Soc. 141 (2019) 12849-12854. doi: 10.1021/jacs.9b06109
D. R. Paul, L. M. Robeson, Polymer 49 (2008) 3187-3204.
X. Y. Shen, C. Viney, E. R. Johnson, et al., Nat. Chem. 5 (2013) 1036-1042.
R. Crossley, A. P. Downing, M. Nogradi, et al., J. Chem. Soc.-Perkin Trans. 1 3 (1973) 205-217.
P. Domiano, P. Cozzini, R. M. Claramunt, et al., J. Chem. Soc.-Perkin Trans. 2 9 (1992) 1609-1620.
M. L. Jimeno, I. Alkorta, J. Elguero, et al., New J. Chem. 22 (1998) 1079-1083.
X. Y. Shen, C. Viney, C. C. Wang, et al., Adv. Funct. Mater. 24 (2014) 77-85. doi: 10.1002/adfm.201301377
X. Y. Shen, T. Connolly, Y. H. Huang, et al., Macromol. Rapid Commun. 37 (2016) 1904-1911. doi: 10.1002/marc.201600045
Y. H. Huang, X. Y. Shen, Z. Wang, et al., Macromolecules 51 (2018) 8477-8485. doi: 10.1021/acs.macromol.8b01890
Z. Wang, Y. H. Huang, J. Guo, et al., Macromolecules 51 (2018) 1377-1385. doi: 10.1021/acs.macromol.7b02705

Figure 1 Temperature-dependent 1H NMR (MHz) spectra of the methylene protons of DBCOD for its related conformation state in twist-boat (TB) and chair (C) forms.

Figure 2 DFT calculations to illustrate the structures and energy differences between twist boat (TB) and chair (C) conformers in (a) Molecule A, (b) Molecule B and (c) Molecule C.

Figure 3 DFT calculations to illustrate the structures and energy differences between twist boat (TB) and chair (C) conformers in (a) Molecule D, (b) Molecule E and (c) Molecule F.

Figure 4 TMA plot of (a) PA-cis-DBCOD film, (b) PA-trans-DBCOD and (c) PU-cis-DBCOD with a heating rate of 2 ℃/min.
Table 1. DFT calculations on TB and C conformers at different temperatures for Molecules A-F and DBCOD.
|
|
 下载: 导出CSV

 扫一扫看文章

扫一扫关注我们