
Scheme 1.
(A) Fabrication of the gold ultramicroelectrode, (B, C) fabrication of the peptide modified electrode for the ECL bioassay of CK2 in aqueous solution (B) and in single cells (C).
Monitoring casein kinase Ⅱ at subcellular level via bio-bar-code-based electrochemiluminescence biosensing method
Lifen Wang , Jiajia Song , Xiaofei Wang , Honglan Qi , Qiang Gao , Chengxiao Zhang

Protein kinase is a kinase enzyme that modifies target proteins by transferring phosphate groups from adenosine 5'-triphosphate (ATP) to OH group of an amino acid side chain in peptides or protein. Protein phosphorylation by kinases is one of the most important posttranslational modification mechanisms in the process of cellular signal transduction, which plays important roles in many fundamental biological processes [1]. Aberrations in protein kinase activities and abnormal protein phosphorylation states can result in a number of diseases, such as diabetes [2], Alzheimer's disease [3], and cancer [4]. Therefore, the development of methods for the detection of protein kinases is of great significance in biological and clinical fields [5-7].
Conventional method for monitoring protein kinase is radiometric assay, which typically relies on transferring the radioactive phosphate (γ-32P) from ATP to the specific substrate peptides in the presence of protein kinases [8, 9]. The γ-32P is not beneficial to environment. Many novel methods, such as colorimetry [10], fluorescence [11, 12], surface-enhanced Raman spectroscopy [13], electrochemistry [14, 15] and electrogenerated chemiluminescence (electrochemiluminescence, ECL), have been reported for the detection of protein kinase. Among them, ECL is receiving increasing attention in analytical chemistry due to its high sensitivity, simplified optical setup and good temporal and spatial control [16-20]. There are usually three strategies in ECL bioassay of protein kinase, including the detection of ECL signal generated from ECL emitter labeled phospho-specific antibodies [21-23], ECL emitter modified gold nanoparticles (AuNPs) [24, 25] or ECL emitter coordinated with metal ion [26-30]. For example, Liu group developed an ECL method for the detection of protein kinase A (PKA) in cell lysates using Au and Pt nanoparticles loaded metal-organic frameworks nanocomposite integrated with the phosphorylated peptide by zirconium cation (Zr4+) [30]. Although good performance was obtained, most of them are applied in the detection of protein kinase in human serum or in cell lysates at high cell population level, which are limited in monitoring subcellular localization of protein kinase in single cells. Therefore, the development of sensitive and selective method for monitoring protein kinase at single cells, especially, at subcellular level, is mportant to understand cell heterogeneity at molecule level and the subcellular localizations of protein kinase.
Here, we presented a highly sensitive ECL method for monitoring protein kinase at subcellular level. Casein kinase Ⅱ (CK2), the most pleiotropic member of the human kinome, was chosen as a model target. A zirconium cation was chosen to mediate between the phosphorylated peptide and phosphorylated signal probe without chemical activation steps. A gold ultramicroelectrode was fabricated and used as base electrode (as shown in Scheme 1A). A bio-bar-code probe (h-DNA/AuNPs/pDNA) was prepared by conjugating phosphorylated DNA (p-DNA, 5'-SH-AAAAAAGTGTGTGTGTGTGTGTGTGTG-P-3') and hairpin DNA (h-DNA, 5'-GCGCAACAAGAGTTCTTTTGAACTCTTGTTGCGCTTTTTSH-3') onto AuNPs for signal amplification. The principle of the ECL method for the detection of CK2 is illustrated in Scheme 1B. The characterization of h-DNA/AuNPs/p-DNA and gold ultramicroelectrode, and the analytical performance for the detection of CK2 were investigated. By virtue of a micromanipulator, the peptide modified gold ultramicroelectrode was precisely penetrated into single cells for the phosphorylation of peptide in the presence of endogenous CK2 and ATP (as shown in Scheme 1C). After the phosphorylation in single cells, the resulting modified electrode was conjugated with h-DNA/AuNPs/p-DNA through Zr4+. Finally, Ru(phen)32+ was intercalated into the groove of h-DNA. ECL emission was recorded in the presence of tripropylamine (TPA). The analytical performance for the detection of CK2 in single cells was studied. To our knowledge, this report is the first to describe the detection of the protein kinase at subcellular level.
Firstly, the h-DNA/AuNPs/p-DNA was synthesized according to reference [31] and characterized using transmission electron microscopy (TEM), UV–vis absorption spectroscopy and fluorescence spectroscopy. As shown in Fig. 1A, spherical mono-dispersed nanoparticles with a size of 18 2 nm were obtained for h-DNA/ AuNPs/p-DNA, which is slightly larger than bare AuNPs, with a size of 15±2 nm in TEM images (Fig. S1 in Supporting information). A layer of approximately 3 nm around the AuNPs can be clearly observed in high resolution TEM images after the DNA enwrapped the AuNPs (Fig. 1A, insert). Fig. 1B shows an absorption peak at 520 nm for AuNPs, an absorption peak at 260 nm for h-DNA and p-DNA, and two absorption peaks at 524 nm and 260 nm for h-DNA/AuNPs/p-DNA. A slight red shift of the absorption peak from 520 nm to 524 nm was obtained for h-DNA/AuNPs/p-DNA compared with AuNPs. The color of the suspension solution of h-DNA/AuNPs/p-DNA was red in the absence and in the presence of 0.01 mol/L MgCl2, but the color of the suspension solution of AuNPs becomes blue in the presence of 0.01 mol/L MgCl2 (Fig. 1C). There is no color change observed for h-DNA/AuNPs/p-DNA after storing one week at 4 ℃ (Fig. S2 in Supporting information). Additionally, the Gibbs free energy (ΔG) was predicted with the computer program RNA Structure version 4.5 [32]. p-DNA cannot be hybridized with each other while there is a one loop for h-DNA (ΔG = -21.9 kcal/mol). –4.5 kcal/mol of ΔG is obtained for the hybridization between p-DNA and h-DNA (Fig. S3 in Supporting information). The good stability and small absolute values of the predicted ΔG suggest that AuNP with multiple p-DNA cannot form into crosslinking structures. The average number of p-DNA and h-DNA on each AuNP was calculated to be 40 and 153 according to the DNA fluorescence-concentration calibration curves (Fig. S4 in Supporting information). These results suggest the successful synthesis of h-DNA/AuNPs/p-DNA.
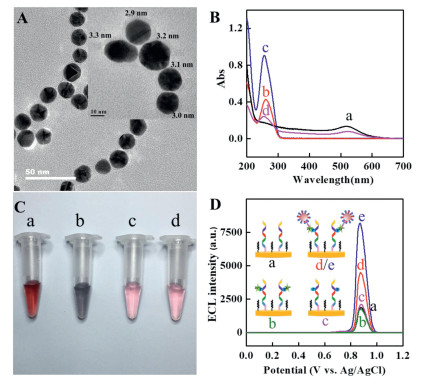
A conventional gold electrode was initially used as the base working electrode to confirm the utility of h-DNA/AuNPs/p-DNA as a carrier for ECL signal reagent for the detection of the CK2. As shown in Fig. 1D, a low ECL signal was obtained in the absence of CK2 (a, 1895 a.u.). The ECL intensity increased from 4533 a.u. (d) to 8184 a.u. (e) for 0.1 U/mL and 0.15 U/mL CK2, respectively. Additionally, a negligible change in ECL intensity was recorded in the absence of h-DNA/AuNPs/p-DNA (b, 1738 a.u.) and in the absence of Zr4+ (c, 2136 a.u.), respectively, compared with the blank. Therefore, the h-DNA/AuNPs/p-DNA can be used as a carrier for the ECL signal reagent for the detection of CK2.
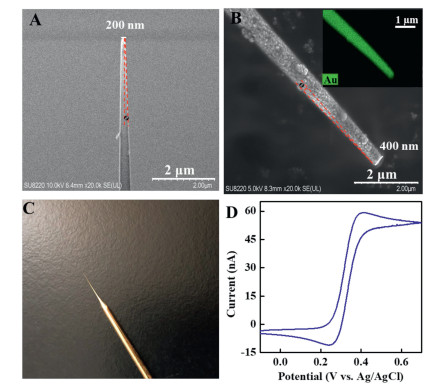
A gold ultramicroelectrode was fabricated in the present study to detect CK2 at subcellular level. The obtained gold ultramicroelectrode was characterized by FE-SEM and electrochemical method. FE-SEM images show an outer diameter of ~200 nm and a taper angle (θ) of 3° for the silanized micropipette (Fig. 2A). After sputtering the gold layer onto the silanized micropipette, the outer diameter increased to 400 nm with a taper angle of 4° (Fig. 2B). The small diameter and sharp taper enabled the gold ultramicroelectrode to penetrate into single cells. Based on the energy-dispersive X-ray spectroscopy element mapping of Au on micropipette using high-angle annular dark-field (HAADF) SEM imaging mode, gold layers did coat the surface of the silanized micropipette (Fig. 2B, insert). A yellow gold layer can be clearly seen from the representative photograph of a gold ultramicroelectrode (Fig. 2C). The cyclic voltammogram (CV) of a gold ultramicroelectrode in 2 mmol/L ferrocenecarboxylic acid shows a typical sigmoid-shape, indicating the microsized property of the prepared gold ultramicroelectrode (Fig. 2D). The relative standard deviation (RSD) of the steady-state current obtained at 5 different gold ultramicroelectrodes was 8.3%, indicating the relatively good reproducibility for the fabrication of the gold ultramicroelectrode. The gold ultramicroelectrode was then used as base working electrode for the fabrication of the peptide modified electrode for the detection of CK2. The results show that a very little ECL signal was obtained in the absence of CK2 and the ECL intensity increased from 66 a.u. (b) to 233 a.u. (c) when the concentration of CK2 increased from 0.02 U/mL to 0.05 U/mL (Fig. S5 in Supporting information). Therefore, the feasibility of the employment of gold ultramicroelectrode as base working electrode is obvious for the detection of CK2.
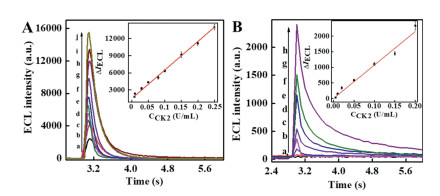
Here, two types of gold electrodes, including conventional gold electrode and gold ultramicroelectrode, were used as base working electrode for the detection of CK2. Experiment conditions including applied potential, the ratio of h-DNA:p-DNA, the diluted ratio of h-DNA/AuNPs/p-DNA and concentration of Ru(phen)32+ were optimized for conventional gold electrode and gold ultramicroelectrode (Figs. S6-S9 in Supporting information). At conventional gold electrodes, +1.0 V of constant potential, 10:1 of the ratio of h-DNA:p-DNA, 1:1000 of the diluted ratio of h-DNA/ AuNPs/p-DNA and 0.1 mmol/L of Ru(phen)32+ were optimized for the detection of CK2. CK2 was quantified by the increased ECL intensity (ΔI = Is – I0), where I0 is the ECL intensity in the absence of CK2 and Is is the ECL intensity in the presence of CK2. The analytical performance for the detection of CK2 at conventional gold electrodes is obtained as shown in Fig. 3A. The linear equation was ΔI = 5.0 × 10⁴ CCK2 (U/mL) + 1468 (R = 0.9982) in the range of 0.008–0.25 U/mL. The detection limit was 0.005 U/mL for CK2, and RSD (n = 5) was 3.2% for 0.03 U/mL CK2. At the gold ultramicroelectrode, +0.85 V of constant potential, 10:1 of the ratio of hDNA:p-DNA, 1:200 of the diluted ratio of h-DNA/AuNPs/p-DNA and 1 mmol/L of Ru(phen)32+ were optimized for the detection of CK2. The analytical performance for the detection of CK2 at peptide modified gold ultramicroelectrode is obtained as shown in Fig. 3B. A very little ECL signal was obtained in the absence of CK2, which is ascribed to the small size of the gold ultramicroelectrode. In the presence of CK2, the ECL intensity increased with the increase of the CK2 concentration in the range of 0.005–0.2 U/mL. As shown in Fig. 3B, the linear equation was ΔI = 1.1 ×10⁴ CCK2 (U/mL) + 2.2 (R = 0.9805) in the range of 0.005–0.2 U/mL. The detection limit was 0.001 U/mL for CK2, and RSD (n = 5) was 12.1% for 0.02 U/mL CK2. Larger RSD obtained at peptide modified gold ultramicroelectrode may be ascribed to small electrode size and large electrode area error [33, 34]. Further work is going on in our lab to improve the performance of the gold ultramicroelectrode. A lower detection limit was obtained at the peptide modified gold ultramicroelectrodes (Table S1 in Supporting information) due to the high sensitivity of h-DNA/AuNPs/p-DNA and low background of the gold ultramicroelectrode.
The peptide modified conventional gold electrodes were used to illustrate the selectivity and the potential applicability in the screeningof inhibitoranddrug.CK2 resultedin anincreaseof theECL intensity (ΔI = 11, 230 a.u.), while interfering proteins did not induce obvious changes in the ECL intensity (PKA, ΔI = 142 a.u.; bovine serum albumin, BSA, ΔI = 342 a.u.; alkaline phosphatase, ALP, ΔI = 327 a.u.) (Fig. S10 in Supporting information). The ECL response for CK2 in the presence of 4, 5, 6, 7-tetrabromobenzotriazole (TBB, a cell-permeable CK2 inhibitor) showed that the ECL intensity decreased with the increase of TBB concentration (Fig. S11 in Supporting information). The IC50 of TBB was estimated to be 0.31 μmol/L. We further monitored CK2 fluctuation in the presence of cisplatin (CDDP, one of the most widely used chemotherapeutic agents [35]) in cell lysates at high cell population. HeLa cells were incubated in cell culture medium in the presence of 10 μmol/LCDDP to activate intracellular CK2 and then the cell lystate was collected for the assay. The ECL intensity in HeLa cell lysate (b, 3687 a.u., Fig. S12 in Supporting information)was obviouslyhigher than in the blank medium (a, 2129 a.u., Fig. S12) and the ECL intensity further increased after HeLa cells were stimulated with CDDP (c, 4842 a.u., Fig. S12). The CK2 concentration in cell lysates at high cell population is calculated to be 0.044 U/mL according to the linear equation in Fig. 3A. After CDDP stimulation, the CK2 concentration increased to0.067U/mL. This suggests that the CK2 concentration is increased by stimulating cells with CDDP. The selectivity and potential application are obvious.
The monitoring of CK2 at subcellular level is of great importance for studying cell energy metabolism and revealing insights into heterogeneous cellular features at molecular level. Figs. 4A and B show representative bright field images of HeLa cells after the peptide modified gold ultramicroelectrode inserting into different regions (cytoplasm and nucleus). Fig. 4C shows the ECL intensity vs. time profiles obtained at different peptide modified gold ultramicroelectrodes after inserting into different subcellular locations of six single cells. It can be clearly seen that the ECL intensity in the subcellular locations of a single HeLa cell was substantially increased compared with the blank cell medium, indicating the presence of CK2 inHeLa cells. A higher ECL intensitywas detectedby inserting the peptide modified gold ultramicroelectrode into the nucleus than that into the cytoplasm of a single HeLa cell. We calculated the intracellular CK2 concentrations in individual cells using a calibration curve of CK2 in Fig. 3B. As shown in Fig. 4D, the concentration of CK2 is around 0.008±0.004U/mL in six single cells by inserting the peptide modified gold ultramicroelectrode into the cytoplasm of HeLa cells and the concentration of CK2 is around 0.012±0.007 U/mL in six single cells by inserting the peptide modified gold ultramicroelectrode into the nucleus of HeLa cells. The concentration of CK2 by inserting the peptide modified gold ultramicroelectrode into the nucleus was slightly higher than that into the cytoplasm of HeLa cells. It should be noted that the outer diameter of the gold ultramicroelectrode is 400 nm and the length of the ultramicroelectrode is 500 μm. When inserting the peptide modified gold ultramicroelectrode into nucleus of HeLa cells with tens of micrometers in size, the peptide modified gold ultramicroelectrode could react with target both in cytoplasm and nucleus. Further work is going to fabricate disk ultramicroelectrode for the detection of target in different subcellular compartments.
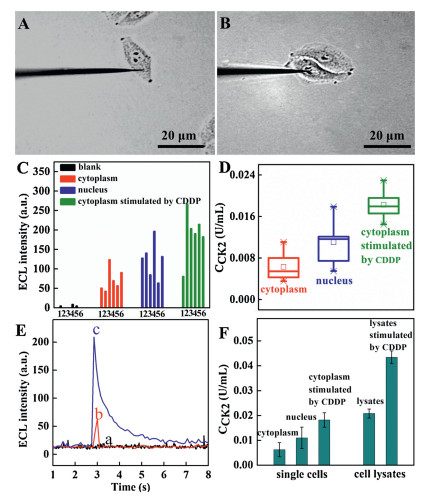
The peptide modified gold ultramicroelectrodes was further used to detect the CK2 fluctuation in cell lysates at high cell population and at subcellular level under CDDP stimulation. In cell lysates at high cell population, the ECL intensity of HeLa cell lysates increased compared with that in the blank medium and the ECL intensity further increased after CDDP stimulation (Fig. 4E). The concentration of CK2 in the cell lysates is calculated to be 0.021±0.002 U/mL according to the linear equation in Fig. 3B. After CDDP stimulation, the CK2 concentration increased to 0.043±0.003 U/mL (Fig. 4F). The RSD was 15.3% for six cell lysates (n = 6). At subcellular level, the ECL intensity by inserting the peptide modified gold ultramicroelectrode into the cytoplasm of HeLa cells as example still increased after CDDP stimulation compared with that before CDDP stimulation. After CDDP stimulation, the concentration of CK2 by inserting the peptide modified gold ultramicroelectrode into the cytoplasm was in range of 0.018±0.004 U/mL in six single cells (Fig. 4F). A noticeable increase in the CK2 concentration was observed when the HeLa cells were stimulated with CDDP both at high cell population and at subcellular level. We compared the concentrations of CK2 in cell lysates with high cell population and different cellular compartments in a single cell. As shown in Fig. 4F, CK2 was present at high level both in HeLa cell lysates from high cell population and from single cells; the average concentration of CK2 in different subcellular locations of a single cell was lower than that in the cell lysate obtained from a large number of cells. This finding is reasonable because the single-cell analysis only measured the level of the target protein at subcellular within one cell, whereas the analysis of cell lysate from a large number of cells measured and averaged large amounts of proteins from all cells.
Additionally, the ECL intensity measured in different cells was slightly different, suggesting apparent cell microheterogeneity at CK2 level. The cell heterogeneity in single cells was assessed by calculating the RSD of the concentration of CK2 in HeLa cells at gold ultramicroelectrode. The RSD of CK2 concentrations by inserting the peptide modified gold ultramicroelectrode into cytoplasm and nucleus measured in different single cells was 42.5% and 39.1% while RSD of standard solutions and cell lysates ranged from 12.1%–15.3%. The RSD of CK2 concentrations measured in different single cells (42.5%, 39.1%) was much larger than that RSD for standard solutions (12.1%) and cell lysates (15.3%). The heterogeneity at CK2 molecule level in single cells is obvious.
In conclusion, we developed a highly sensitive ECL biosensing method for the detection of CK2 at subcellular level. A sensitive and selective "signal on" ECL method was developed for the detection of CK2 with a detection limit of 0.001 U/mL, which is attributed to good sensitivity of the ECL method, small background of the peptide modified gold ultramicroelectrode, the amplification of bio-bar-coded probe and the intercalation of ECL reagents into h-DNA structure. Additionally, combined efficient subcellular phosphorylation in vivo with bio-code-based ECL biosensing method, the ECL method was applied to monitor CK2 at subcellular level without tedious subcellular fractionation. It was found that CK2 was present at high level in the nucleus and cytoplasm of HeLa cells and the concentration of CK2 by inserting the peptide modified gold ultramicroelectrode into the nucleus was higher than that into cytoplasm of HeLa cells. A distinct heterogeneity among CK2 activities in single cells, for the first time, was observed for cellular heterogeneity assessment. The work provides information about the subcellular localizations and microheterogeneity of CK2 at subcellular level, which can be extended to detect other biological molecules at subcellular level.
The authors declare that they have no known competing financial interests or personal relationships that could have appeared to influence the work reported in this paper.
This work was supported by the National Natural Science Foundation of China (Nos. 21775097 and 21775098) and the Fundamental Research Funds for the Central Universities (No. GK201801006).
Supplementary material related to this article canbefound, in the online version, at doi:https://doi.org/10.1016/j.cclet.2020.06.032.
G. Manning, D.B. Whyte, R. Martinez, et al., Science 298 (2002) 1912-1934. doi: 10.1126/science.1075762
N. Musi, M.F. Hirshman, J. Nygren, et al., Diabetes 51 (2002) 2074-2081. doi: 10.2337/diabetes.51.7.2074
A. Salminen, K. Kaarniranta, A. Haapasalo, et al., J. Neurochem. 118 (2011) 460-474. doi: 10.1111/j.1471-4159.2011.07331.x
J. Brognard, T. Hunter, Curr. Opin. Genet. Dev. 21 (2011) 4-11. doi: 10.1016/j.gde.2010.10.012
G. Werlen, B. Hausmann, D. Naeher, et al., Science 299 (2003) 1859-1863. doi: 10.1126/science.1067833
J. Luo, T. Li, M. Yang, Chin. Chem. Lett. 31 (2020) 202-204. doi: 10.1016/j.cclet.2019.05.051
W. Zhang, R. Wang, F. Luo, et al., Chin. Chem. Lett. 31 (2020) 589-600. doi: 10.1016/j.cclet.2019.09.022
J.E. Hutti, E.T. Jarrell, J.D. Chang, et al., Nat. Methods 1 (2004) 27-29. doi: 10.1038/nmeth708
B.T. Houseman, J.H. Huh, S.J. Kron, et al., Nat. Biotechnol. 20 (2002) 270-274. doi: 10.1038/nbt0302-270
S.J. Sun, H.X. Shen, C.H. Liu, et al., Analyst 140 (2015) 5685-5691. doi: 10.1039/C5AN00963D
Y.H. Xu, W. Shi, X.Y. He, et al., Anal. Chem. 89 (2017) 10980-10984. doi: 10.1021/acs.analchem.7b02815
L. Zhang, W. Song, R.P. Liang, et al., Anal. Chem. 88 (2016) 11460-11467. doi: 10.1021/acs.analchem.6b02522
S. He, Y.M.E. Kyaw, E.K.M. Tan, et al., Anal. Chem. 90 (2018) 6071-6080. doi: 10.1021/acs.analchem.7b05417
J.Q. Liu, H. Cheng, D.G. He, et al., Anal. Chem. 89 (2017) 9062-9068. doi: 10.1021/acs.analchem.7b01739
Q. Hu, Q.W. Wang, C.H. Jiang, et al., Biosens. Bioelectron. 110 (2018) 52-57. doi: 10.1016/j.bios.2018.03.030
W.J. Miao, Chem. Rev. 108 (2008) 2506-2553. doi: 10.1021/cr068083a
H. Wei, E.K. Wang, Luminescence 26 (2011) 77-85. doi: 10.1002/bio.1279
Z.Y. Liu, W.J. Qi, G.B. Xu, Chem. Soc. Rev. 44 (2015) 3117-3142. doi: 10.1039/C5CS00086F
Z.X. Shi, G.K. Li, Y.F. Hu, Chin. Chem. Lett. 30 (2019) 1600-1606. doi: 10.1016/j.cclet.2019.04.066
H. Qi, C. Zhang, Anal. Chem. 92 (2020) 524-534. doi: 10.1021/acs.analchem.9b03425
S.H. Xiao, E. Farrelly, J. Anzola, et al., Anal. Biochem. 367 (2007) 179-189. doi: 10.1016/j.ab.2007.05.007
R.P. Liang, C.Y. Xiang, H.F. Zhao, et al., Anal. Chim. Acta 812 (2014) 33-40. doi: 10.1016/j.aca.2013.12.037
X. Liu, M.M. Dong, H.L. Qi, et al., Anal. Chem. 88 (2016) 8720-8727. doi: 10.1021/acs.analchem.6b02070
H.F. Zhao, R.P. Liang, J.W. Wang, et al., Chem. Commun. 51 (2015) 12669-12672. doi: 10.1039/C5CC03678J
S. Xu, Y. Liu, T. Wang, et al., Anal. Chem. 82 (2010) 9566-9572. doi: 10.1021/ac102296g
Z. Zhao, X.M. Zhou, D. Xing, Biosens. Bioelectron. 31 (2012) 299-304. doi: 10.1016/j.bios.2011.10.035
Z.F. Chen, X.X. He, Y.H. Wang, et al., Biosens. Bioelectron. 41 (2013) 519-525. doi: 10.1016/j.bios.2012.09.018
J.Q. Liu, X.X. He, K.M. Wang, et al., Biosens. Bioelectron. 70 (2015) 54-60. doi: 10.1016/j.bios.2015.03.026
Z.H. Wang, Z.Y. Yan, N. Sun, et al., Biosens. Bioelectron. 68 (2015) 771-776. doi: 10.1016/j.bios.2015.02.006
Z.Y. Yan, F. Wang, P.Y. Deng, et al., Biosens. Bioelectron. 109 (2018) 132-138. doi: 10.1016/j.bios.2018.03.004
H.F. Cui, T.B. Xu, Y.L. Sun, et al., Anal. Chem. 87 (2015) 1358-1365. doi: 10.1021/ac504206n
D.H. Mathews, J. Sabina, M. Zuker, et al., J. Mol. Biol. 288 (1999) 911-940. doi: 10.1006/jmbi.1999.2700
R. He, H. Tang, D. Jiang, et al., Anal. Chem. 88 (2016) 2006-2009. doi: 10.1021/acs.analchem.6b00150
Y. Liu, M. Li, F. Zhang, et al., Anal. Chem. 87 (2015) 5531-5538. doi: 10.1021/ac5042999
C. Cheng, Y. Meng, Z. Zhang, et al., J. Mater. Sci. Mater. Med. 30 (2019) 58. doi: 10.1007/s10856-019-6260-8

Scheme 1 (A) Fabrication of the gold ultramicroelectrode, (B, C) fabrication of the peptide modified electrode for the ECL bioassay of CK2 in aqueous solution (B) and in single cells (C).

Figure 1 (A) TEM image of h-DNA/AuNPs/p-DNA; insert: high resolution TEM image of h-DNA/AuNPs/p-DNA. (B) UV–vis absorption spectra of AuNPs (a), h-DNA (b), p-DNA (c) and h-DNA/AuNPs/p-DNA (d). (C) Photographs of different solutions: (a) 200 μL of AuNPs, (b) 180 μL of AuNPs + 20 μL of 0.1 mol/L MgCl2, (c) 200 μL of h-DNA/AuNPs/p-DNA, and (d) 180 μL of h-DNA/AuNPs/p-DNA + 20 μL of 0.1 mol/L MgCl2. (D) ECL intensity vs. potential profiles of the peptide modified conventional gold electrode for the detection of CK2: (a) blank, (d) 0.1 U/mL CK2, (e) 0.15 U/mL CK2, and (b) 0.1 U/mL CK2 in the absence of h-DNA/AuNPs/p-DNA and (c) in the absence of Zr4+ solution. Experimental conditions: 0.1 mol/L PBS (pH 7.4) containing 50 mmol/L TPA with a scan rate of 50 mV/s, PMT, –900 V.

Figure 2 (A) FE-SEM image of the silanized micropipette. (B) FE-SEM image of gold ultramicroelectrode. Insert: the EDX elemental mapping of Au on the ultramicroelectrode. (C) Representative photograph of the gold ultramicroelectrode. (D) CV of 2 mmol/L ferrocenecarboxylic acid on a gold ultramicroelectrode with a scan rate of 10 mV/s.

Figure 3 (A) ECL intensity vs. time profiles for the detection of CK2 using peptide modified conventional gold electrode: (a-j) 0, 0.008, 0.01, 0.03, 0.05, 0.08, 0.1, 0.15, 0.2, 0.25 U/mL. Insert: calibration curve for CK2. Applied potential, +1.0 V. (B) ECL intensity vs. time profiles for the detection of CK2 using peptide modified gold ultramicroelectrode: (a-h) 0, 0.005, 0.01, 0.02, 0.05, 0.1, 0.15, 0.2 U/mL. Insert: calibration curve for CK2. Applied potential, +0.85 V. Experimental conditions: 0.1 mol/L PBS (pH 7.4) containing 50 mmol/L TPA.

Figure 4 (A, B) Representative bright field images of HeLa cells after the peptide modified gold ultramicroelectrode inserting into different regions of cells (A, cytoplasm, B, nucleus). (C) ECL intensity for CK2 in different regions of an individual cell. (D) Box graph summarizing the average intracellular CK2 levels in different regions of six single cells. Upper and lower bars represent the highest and the lowest CK2 concentrations measured with the developed ECL method. (E) Representative ECL intensity vs. time profiles of the peptide modified gold ultramicroelectrode for the detection of CK2 (a) in the absence of cell lysate, in the presence of cell lysate without (b) and with (c) 10 μmol/L CDDP stimulation. (F) Comparison of the concentration of CK2 measured using the developed ECL method in single cells and cell lysates. ECL measurement conditions: 0.1 mol/L PBS (pH 7.4) containing 50 mmol/L TPA and an applied potential of +0.85 V.

 扫一扫看文章

扫一扫关注我们
 DownLoad:
 下载:
下载: