Experimental Center of Advanced Materials, School of Materials Science & Engineering, Beijing Institute of Technology, Beijing 100081, China
b.
Laboratory of Controllable Preparation and Application of Nanomaterials, Technical Institute of Physics and Chemistry, Chinese Academy of Sciences, Beijing 100190, China
c.
CAS Key Laboratory of Cryogenics, Technical Institute of Physics and Chemistry, Chinese Academy of Sciences, Beijing 100190, China
d.
University of Chinese Academy of Sciences, Beijing 100049, China
* Corresponding authors at: Laboratory of Controllable Preparation and Application of Nanomaterials
Received Date:
30 April 2020 Accepted Date:
15 June 2020 Revised Date:
10 June 2020 Available Online:
15 December 2020
Abstract:
In this work, polymethacrylic acid (PMAA)-templated silver nanoclusters (Ag NCs) were developed as the fluorescent probe for the efficient and sensitive detection of adenosine triphosphate (ATP) in a wide range of pH values. The fluorescence intensity of the Ag NCs could keep stable with pH values ranging from 2.5 to 9.3. The detection of ATP was based on the quenching of the fluorescent Ag NCs in the presence of ATP. The fluorescence quenching of the Ag NCs with increasing ATP concentration was studied at pH 2.5, 4.5, 7.0 and 8.5 which involved a wide pH environment in body fluids. The limit of detection (LOD) for ATP was as low as 0.1 mmol/L in an acidic environment with pH of 2.5 and all the linear correlation coefficients were satisfactory under wide-span pH values from 2.5 to 8.5. In addition, the sensitive determination of ATP was also achieved by adding copper ions (Cu2+). The high selectivity and rapid detection process proved that the fluorescent probe had great potential to detect ATP in biological samples under different pH conditions.
Rapid and accurate detection methods are necessary for chemo/biosensing. Recently, various analysis methods have been used for the detection and quantification of analytes, such as electrochemistry [1, 2], surface plasmon resonance [3, 4], surface-enhanced Raman scattering (SERS) [5, 6], mass spectrometry and chromatography [7, 8]. However, some detection methods also face the problems of needing specific equipment, complex testing procedures or poor sensitivity to some extent. To date, fluorescence detection has gained much attention due to simple operation, high selectivity, excellent sensitivity and real-time monitoring [9]. Especially, many kinds of inorganic nanomaterials have been designed as fluorescent probes in aqueous solution or physiological environment [10]. Compared with organic fluorescent dyes or materials, inorganic fluorescent nanomaterials show superior properties such as tunable emission, excellent photostability and good biocompatibility [11-15]. Nevertheless, most fluorescent nanoprobes show pH-dependent fluorescence properties and the fluorescence detection is mostly performed at neutral pH. It is known that pH values largely differ in body fluids, for example, the pH values of gastric juice and intestinal juice are nearly 2.0 and 8.0, respectively [16, 17]. The pH range of lysosomes in tumor cells is about 4.5-5.5 [18]. Therefore, it is necessary to develop a fluorescence detection system which is suitable for a wide pH range.
Adenosine triphosphate (ATP) is a high-energy phosphate compound consisting of adenine, ribose and three phosphate groups. ATP plays an important role in participating in the cell metabolism, intracellular signaling and biochemistry [19-21]. Meanwhile, ATP is crucial in regulating the normal function of living organisms [22-24]. The abnormal level of ATP is associated with the pathogenesis of many clinical diseases, such as local ischemia, hypoglycemia and Parkinson's disease [25, 26]. More importantly, ATP exists in various body fluids with different pH values [27]. So, it is quite significant to study the efficient and sensitive detection of ATP in different pH environment based on the distribution of ATP in the human body.
Herein, we report a rapid, sensitive and selective method for fluorescent detection of ATP under different pH environment with the PMAA-templated silver nanoclusters (Ag NCs). The Ag NCs were adopted as the fluorescent probe based on a series of advantages such as simple preparation, good biocompatibility and rapid detection process. In addition, the fluorescence intensity of the Ag NCs nearly unchanged over a specific pH range. The fluorescence decrease of the Ag NCs occurred with increasing the concentration of ATP. Another method for sensitive detection of ATP was based on the adding of Cu2+. In other words, the fluorescence of the Ag NCs was quenched firstly in the presence of 200 μmol/L Cu2+ while gradually recovered after adding different concentrations of ATP. It is worth noting that this fluorescent probe can detect ATP over a wide pH range and has a good linearity. Therefore, an easy-operated, rapid and sensitive nanoprobe for ATP detection in a wide range of pH was developed. It has great potential for detecting analytes in biological samples in the future.
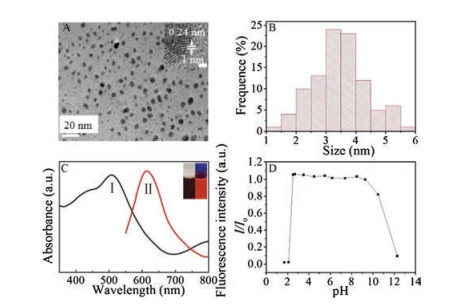
The Ag NCs were synthesized according to the reported method with modification [28]. The preparation process of the Ag NCs and the detection procedures of ATP can be found in Supporting information. The transmission electron microscopy (TEM) and the size distribution histogram of the Ag NCs were shown in Figs. 1 A and B, respectively. The average size of the Ag NCs was approximate 3.5 nm. The high resolution transmission electron microscopy (HRTEM) image (Fig. 1A inset) showed that the lattice spacing of the Ag NCs was 0.24 nm which was consistent with the (111) plane of face-centered cubic structures of silver. The curve I in Fig. 1C showed the ultraviolet absorption spectrum of the Ag NCs and the absorption peak was 510 nm. The emission peak was 615 nm when the excitation wavelength was 510 nm according to curve II. As shown in Fig. 1C (inset), the freshly prepared Ag NCs was dark red under room light and emitted red fluorescence when illuminated by a UV light under excitation at 365 nm. Fig. 1D showed that the fluorescence ratio (I/I0) of the Ag NCs was almost unchanged in the pH range of 2.5-9.3 which was broader than previously reported literature [22, 29, 30]. This result also highlighted that the Ag NCs can be applied for detection during a wider pH range. The fluorescence quenching occurred only under the condition of strong acid or strong base, indicating that the fluorescence of the as-prepared Ag NCs was independent on pH in a wide range.
Figure 1
Figure 1.
(A) The TEM image and HRTEM image (inset) of the Ag NCs. Scale bar: 20 nm and 1 nm (inset). (B) The size distribution histogram of the Ag NCs. (C) Curve I: the UV-vis absorption spectra of the Ag NCs; Curve II: the fluorescence emission spectra of the Ag NCs; Inset: photographs of the Ag NCs aqueous solution under room-light (left) and UV lamp irradiation (right). (D) The fluorescence intensity ratio (I/I0) of the Ag NCs with pH ranging from 1.7 to 12.3. I0 and I represent the fluorescence intensity of the Ag NCs at 615 nm in neutral deionized water and in different pH aqueous solution, respectively.
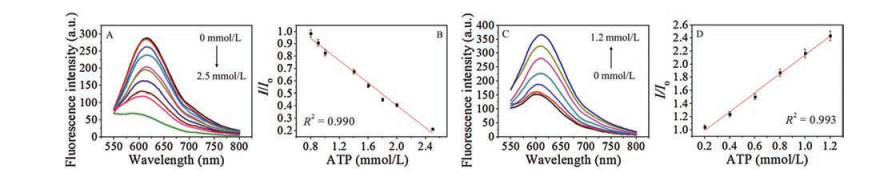
The detection of ATP by the Ag NCs was tested in deionized water at pH 7.0 firstly. The fluorescence changes were recorded for a mixed time of 6 min (Fig. S1 in Supporting information). According to Fig. 2A, the fluorescence intensity of the Ag NCs at 615 nm decreased with the increasing concentration of ATP. Meanwhile, the fluorescence of the Ag NCs was quenched by about 79% after adding 250 μL of the solution containing the ATP (2.5 mmol/L). The calibration curve between fluorescence quenching degree and the concentrations of ATP was shown in Fig. 2B. The linear plot for ATP concentrations ranging from 0.8 mmol/L to 2.5 mmol/L was obtained with the correlation coefficient of 0.990 and the detection limit was 0.8 mmol/L. Considering the interaction between Cu2+ and the Ag NCs, Cu2+ was introduced for further detecting ATP [28]. The fluorescence intensity of the Ag NCs was decreased to a certain extent after adding 200 μmol/L Cu2+. Fig. 2C showed that the fluorescence intensity of Ag NCs-Cu2+ was improved after adding different concentrations of ATP. The highest fluorescence intensity of the Ag NCs was approximately 2.5-fold higher than that only in the presence of 200 μmol/L Cu2+. Fig. 2D exhibited a good linear relationship (R2 = 0.993) between I/I0 and the concentration of ATP in the range of 0.2 mmol/L to 1.2 mmol/L. So, the limit of detection (LOD) of ATP in the presence of Cu2+ was slightly lower than that only adding different amounts of ATP. Compared with some DNA-template Ag NCs for the detection of ATP [31, 32], the results of our work showed a superior LOD and linear relationship. The intracellular and extracellular ATP concentrations of human blood samples were 2.5±1.2 mmol/L and 0.4 ± 0.3 mmol/L respectively according to reference [33]. Therefore, the above results showed that the Ag NCs could be utilized for the sensitive detection of ATP in a neutral pH environment.
Figure 2
Figure 2.
(A) Fluorescence changes of the Ag NCs with the concentrations of ATP increasing from 0 mmol/L to 2.5 mmol/L (top to bottom). (B) The linear plot of the relative fluorescence intensity (I/I0) of the Ag NCs in the presence of different concentrations of ATP. I0 and I represent the fluorescence intensity of the Ag NCs in the absence and in the presence of ATP. (C) Fluorescence changes of the system with 200 μmol/L Cu2+ then adding different concentrations of ATP from 0 mmol/L to 1.2 mmol/L (bottom to top).
(D) The linear plot of the relative fluorescence intensity (I/I0) of the Ag NCs in the presence of Cu2+ and different concentrations of ATP.
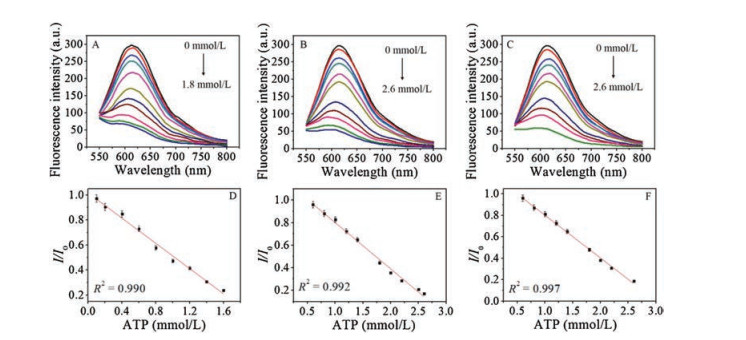
The Ag NCs were also applied for ATP detection in a wide range of pH. To our best knowledge, the pH of human gastric juice is about 2.0, the pH of intestinal juice is about 8.0 in body fluids and the extremely acidic pH in tumor cells is between 4.5 and 5.5. Based on above pH conditions, Fig. 3 showed the fluorescence changes of the Ag NCs after adding different concentrations of ATP at pH 2.5, 4.5 and 8.5. As shown in Fig. 3A, the fluorescence intensity of the Ag NCs gradually decreased with increasing concentrations of ATP at pH 2.5 and the maximum fluorescence (at 615 nm) was quenched by almost 80%. The linear detection ranged from 0.1 mmol/L to 1.6 mmol/L at pH 2.5 with a good linear relationship (R2 = 0.990) and the limit of detection was as low as 0.1 mmol/L (Fig. 3D). The results revealed that the as-prepared Ag NCs could sensitively detect the ATP in an acidic environment. To prove the Ag NCs can achieve detecting ATP in tumor environment, a series of tests were conducted. Fig. 3B showed the fluorescence intensity curves of the Ag NCs in the presence of different concentrations of ATP at pH 4.5 which simulated the pH value of lysosomal in tumor cells. It revealed the detectable concentration range of 0.6-2.6 mmol/L and the correlation coefficient was 0.992 (Fig. 3E). Fig. 3C described the fluorescence spectrum of the Ag NCs after adding ATP in an alkaline pH environment. The detected concentrations of ATP ranged from 0.6 mmol/L to 2.6 mmol/L. Fig. 3F showed the good stability and linearity (R2 = 0.997). In addition, Fig. S2 (Supporting information) also showed a wide detection range and good linearity for ATP in the presence of Cu2+ at pH 2.5 and 8.5. These results above provided an effective evidence for detecting ATP sensitively with the Ag NCs in various pH environments.
Figure 3
Figure 3.
(A) Fluorescence changes of the Ag NCs with the concentrations of ATP increasing from 0 mmol/L to 1.8 mmol/L at pH 2.5 (top to bottom). (B, C) Fluorescence changes of the Ag NCs with the concentrations of ATP increasing from 0 mmol/L to 2.6 mmol/L at pH 4.5 and pH 8.5 (top to bottom). (D-F) The linear plots of the relative fluorescence intensity (I/I0) of the Ag NCs with different concentrations of ATP at pH 2.5, 4.5 and 8.5.
A series of characterization methods were used to further study the detection mechanism. Fig. S3A (Supporting information) showed that the zeta potential of the Ag NCs rose gradually following the increasing concentrations of ATP. We supposed that Ag+ on the surface of the Ag NCs tended to bind to phosphate of the ATP which might lead to the detaching of -COOH of PMAA. As a result, the surface potential of the Ag NCs aqueous solution was obviously increased. UV-vis absorption spectra and the TEM image were also utilized to investigate the mechanism of the fluorescence quenching. As shown in Fig. S3B (Supporting information), the absorption peak of the Ag NCs appeared blue shift from 510 nm to 440 nm with the increasing concentration of ATP from 0 mmol/L to 2.5 mmol/L in neutral deionized water. Meanwhile, Fig. S4 (Supporting information) also showed the blueshift phenomenon in aqueous solution with different pH values. Figs. S3C and S3D (Supporting information) showed that the Ag NCs aggregated into silver nanoparticles (Ag NPs) with the average size of 27.0 ± 0.1 nm in the presence of 2.5 mmol/L ATP. And the average size of the Ag NPs was approximately 15.7 ± 0.1 nm with 0.6 mmol/L ATP (Fig. S5 in Supporting information). Moreover, Fig. S3B (inset) showed the color of the Ag NCs solution changed from pink to yellow with the concentrations of ATP rising from 0 mmol/L to 2.5 mmol/L. Thus, we speculated that the blue-shift of UV absorption peak and the color change of solution might result from the Ag NCs growing to the Ag NPs which were nonfluorescent [34].
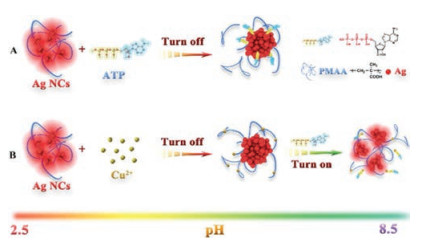
Therefore, we surmised that the interaction between ATP and the Ag NCs led to the fluorescence quenching of the Ag NCs (Scheme 1A). More precisely, the interaction between Ag+ and phosphate groups of the ATP was stronger than that of Ag+ and carboxyl groups of PMAA, which destroying the stability function of PMAA and causing aggregation of the Ag NCs into the Ag NPs. Scheme 1B exhibited the detection mechanism in the presence of the Cu2+. The fluorescence quenching was resulted from that Cu2+ bound with the free carboxylic groups of PMAA surrounding the Ag NCs [35], which affected the protective function of PMAA. Consequently, the addition of a specific concentration of Cu2+ resulted in the Ag NCs aggregating into the large-sized Ag NPs and the quenching of the emission. Furthermore, the fluorescence recovery of the Ag NCs could be explained that the affinity between Cu2+ and phosphate of ATP was higher than that of Cu2+ and -COOH of PMAA [36, 37]. Under the conditions, the combination of Cu2+ and ATP led to the protective and dispersing function of PMAA again. As shown in Fig. S6 (Supporting information), the average size of the Ag NPs was 18.8 ± 0.1 nm, which indicated that the reduction of aggregation compared to the only addition of ATP. Compared with the Ag NCs solution only containing ATP or Cu2+, the damage to the Ag NCs from ATP or Cu2+ was weakened when both existing a certain amount of ATP and Cu2+. In summary, the mechanism of detecting ATP was based on the fluorescence quenching resulting from the aggregation of the Ag NCs.
Scheme 1
Scheme 1.
Schematic illustration of fluorescence changes of the Ag NCs at pH values of 2.5-8.5 with ATP and Cu2+.
To testify the selectivity of the Ag NCs towards ATP, different analytes were detected mixed with the Ag NCs. Fig. S7 (Supporting information) showed that the fluorescence variation percentage ((F0 - F)/F0) at 615 nm obviously changed only in the presence of ATP. Most of analytes and ions had no obvious change of fluorescence intensity of the Ag NCs. The results above indicated the high selectivity of the Ag NCs toward ATP and confirmed the high anti-interference ability of the fluorescent probe when detecting ATP in a complex environment.
In summary, we presented a novel strategy of fluorescence detection based on the Ag NCs for monitoring ATP under different pH conditions. The Ag NCs were synthesized directly by hydrothermal method and the testing time for ATP with the Ag NCs aqueous solution was only 6 min. Moreover, there was a good linear relationship between the fluorescence ratio of the Ag NCs and the concentrations of ATP. The detection method had a lower limit for ATP when introducing Cu2+. Surprisingly, the as-prepared Ag NCs showed excellent fluorescent stability in a wide pH range. The detection system allowed detecting ATP sensitively and selectively at different pH from acidity to alkaline which was wider comparing with the previous detection methods. We have developed a rapid, efficient and sensitive method for accurate detection of ATP and the fluorescent probe is hopefully applied for biological detection under different pH conditions.
Declaration of competing interest
The authors declare that they have no known competing financial interests or personal relationships that could have appeared to influence the work reported in this paper.
Acknowledgments
This work was supported by the National Natural Science Foundation of China (Nos. 21701015, 61975214, 21811530054, 61671435), Beijing Natural Science Foundation (No. 4202075) and the National Key R&D Program (No. 2018YFC0115500).
* Corresponding authors at: Laboratory of Controllable Preparation and Application of Nanomaterials, Technical Institute of Physics and Chemistry, Chinese Academy of Sciences, Beijing 100190, China. ** Corresponding author. E-mail addresses: renxiangling@mail.ipc.ac.cn (X. Ren), hongbo.li@bit.edu.cn (H. Li), mengxw@mail.ipc.ac.cn (X. Meng).
[1]
N. Reta, C.P. Saint, A. Michelmore, B. Prieto-Simon, N.H. Voelcker, ACS Appl. Mater. Interfaces 10(2018) 6055-6072. doi: 10.1021/acsami.7b13943
[2]
M.H. Lin, P. Song, G.B. Zhou, et al., Nat. Protoc. 11(2016) 1244-1263. doi: 10.1038/nprot.2016.071
Figure 1
(A) The TEM image and HRTEM image (inset) of the Ag NCs. Scale bar: 20 nm and 1 nm (inset). (B) The size distribution histogram of the Ag NCs. (C) Curve I: the UV-vis absorption spectra of the Ag NCs; Curve II: the fluorescence emission spectra of the Ag NCs; Inset: photographs of the Ag NCs aqueous solution under room-light (left) and UV lamp irradiation (right). (D) The fluorescence intensity ratio (I/I0) of the Ag NCs with pH ranging from 1.7 to 12.3. I0 and I represent the fluorescence intensity of the Ag NCs at 615 nm in neutral deionized water and in different pH aqueous solution, respectively.
Figure 2
(A) Fluorescence changes of the Ag NCs with the concentrations of ATP increasing from 0 mmol/L to 2.5 mmol/L (top to bottom). (B) The linear plot of the relative fluorescence intensity (I/I0) of the Ag NCs in the presence of different concentrations of ATP. I0 and I represent the fluorescence intensity of the Ag NCs in the absence and in the presence of ATP. (C) Fluorescence changes of the system with 200 μmol/L Cu2+ then adding different concentrations of ATP from 0 mmol/L to 1.2 mmol/L (bottom to top).
(D) The linear plot of the relative fluorescence intensity (I/I0) of the Ag NCs in the presence of Cu2+ and different concentrations of ATP.
Figure 3
(A) Fluorescence changes of the Ag NCs with the concentrations of ATP increasing from 0 mmol/L to 1.8 mmol/L at pH 2.5 (top to bottom). (B, C) Fluorescence changes of the Ag NCs with the concentrations of ATP increasing from 0 mmol/L to 2.6 mmol/L at pH 4.5 and pH 8.5 (top to bottom). (D-F) The linear plots of the relative fluorescence intensity (I/I0) of the Ag NCs with different concentrations of ATP at pH 2.5, 4.5 and 8.5.

 DownLoad:

 下载:
下载:


