Received Date:
19 February 2020 Accepted Date:
28 April 2020 Revised Date:
08 April 2020 Available Online:
15 September 2020
Abstract:
Dual ion batteries (DIBs) exhibit broad application prospects in the field of electrical energy storage (EES) devices with excellent properties, such as high voltage, high energy density, and low cost. In the graphitebased DIBs, high voltage is needed to store enough anions with the formation of anion intercalation compound XCn (X = AlCl4-, PF6-, TFSI-, etc.). Hence, it is difficult for graphite-based DIBs to match proper anodes and electrolytes. Here, an Se/graphene composite is prepared via a convenient method, and assembled into a dual-ion full battery (DIFB) as anode with graphite cathode and 1 mol/L NaPF6 in EC: EMC (1:1, v:v). This DIFB has achieved a high discharge capacity of 75.9 mAh/g and high medium output voltage of 3.5 V at 0.1 A/g. Actually, the suitable anode materials, such as the present Se/graphene composite, are extremely important for the development and application of graphite-based DIBs. This study is enlightening for the design of future low-cost EES devices including graphite-based DIBs.
Nowadays, traditional energy supply and demand relationship has changed due to the emergence of lithium-ion batteries (LIBs), which are being widely used in consumer electronics and electric vehicles [1-5]. However, expensive and low-reserve Li resources are difficult to cope with the growing demand in electrical energy storage (EES) devices. Therefore, other Li-free battery systems such as sodium-ion batteries (SIBs) [6-10], potassium-ion batteries (PIBs) [11-13], and dual-ion batteries (DIBs) [14-17] are expected to be potential substitutes with excellent performance. Among them, graphite-cathode-based DIBs (GC-DIBs) have attracted extensive attention of researchers due to their excellent advantages in terms of high voltage, high energy density and low cost. Be different from "rocking-chair" batteries with only one kind of ion (anion or cation) as carrier, GC-DIBs utilize both anion (PF6-, AlCl4-, TFSI-, FSI-, etc.) [14, 18-22] and cation (Li+, Na+, K+, Ca2+, etc.) as carriers simultaneously. Furthermore, sodium-based DIBs are highly expected because the content of sodium (2.32%) is much higher than that of lithium (0.0065%) in the Earth's crust.
In fact, sodium-based GC-DIBs still confront many challenges. For example, during charging, anions intercalate into graphite interlayers under high potential, where oxidation decompositions of electrolyte usually occur. Although ionic liquids based DIBs can deliver good energy-storage performance owing to excellent electrochemical/thermodynamic stability of electrolyte even at high voltage, it is hard to be practically applied for low cost concept area because of their high price. In addition to the high-voltage instability, sodium-based GC-DIBs must be assembled with other Na+-storage anode materials instead of relatively expensive and highly active metallic sodium, putting them into practical application. Na+-storage anode materials currently have many branches [23-27], such as transition metal oxides, carbon, and sodiation alloy/metal. Among them, transition metal oxides own stable crystal structure and high safety, but Na+ is difficult to diffuse fast in them [28-30]. Although amorphous/low-graphitized carbon materials have the ability of storing Na+, low capacity and sodium dendrite growth limit its development [31, 32]. Alloying materials such as Se and Ge can deliver high capacity with a challenge of low capacity retention during cycling [33-35].
Recently, an outstanding anode material (3D Se/graphene, 3DSG) was prepared by us, and it exhibited superior Na-storage performance in both half and full cells [9, 36]. Herein, we further design and study the sodium-based GC-DIBs by using 3DSG as anode. Note that, this 3DSG used here contains relatively low content selenium (abbreviated as LCSG, whose preparation procedure is illustrated in Fig. S1 (Supporting information)), considering the low-cost concept of DIBs and matchability between graphite cathode and high-capacity Se/graphene anode. In the electrolyte of 1 mol/L NaPF6 in EC:EMC (1:1 in v:v) that is a normal concentration for secondary batteries, a LCSG-graphite dual-ion full battery (DIFB) is designed and studied. This sodium-based DIFB exhibits high discharge capacity and high medium output voltage with an electrode-mass-based energy density of 265.65 Wh/kg, which the power density is 354.2 W/kg. In addition, cyclic voltammetry (CV) tests are implemented to explore the diffusion process of both anions and cations in electrodes and proposed some strategies to further improve the battery performance.
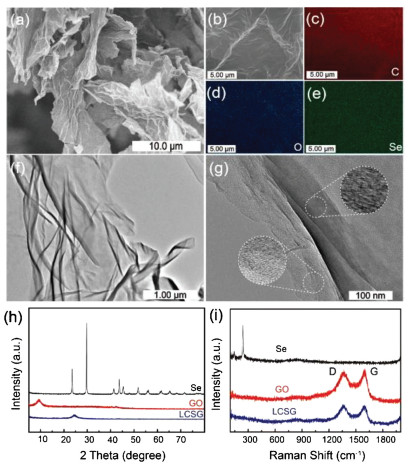
The obtained LCSG anode material has a thin and wrinkled layered structure (Figs. 1a and b). Such a disorderly structure is similar to the graphene oxide (GO) precursor (Fig. S2a in Supporting information). In the annealing process, block selenium (Fig. S2b in Supporting information) well melts into GO at 400 ℃, resulting no selenium block is observed in the LCSG material (Figs. S2c and d in Supporting information). As shown in elemental mappings (Figs. 1c–e), the LCSG mainly contains three elements: carbon, oxygen and selenium, which are evenly distributed in the LCSG material (Fig. S3 in Supporting information). More clearly, the TGA curves illustrated in Fig. S4 shows the selenium content in LCSG is about 30%. Its wrinkled morphology is observed in transmission electron microscopy (TEM) images (Fig. 1f), and it is consistent with the results obtained by scanning electron microscopy (SEM) images. Expectedly, there is no ordered lattice fringes in the areas of thin layer and thick one (Fig. 1g). Obviously, the selenium in LCSG has completely entered the network of GO, which is also demonstrated via comparing the X-ray diffraction (XRD) patterns and Raman spectra of the precursors (Se and GO) and final LCSG products (Figs. 2h and i) [37]. The LCSG exhibits a broad peak at 23°-27° (2θ) without the obvious diffraction peak of selenium. The selenium displayed a clear peak at 241 cm-1, and this peak is attributed to Se8 (chain-structured). In contrast, there are no peaks of selenium at the same position in LCSG, and the D and G bonds of LCSG are weaker than the ones of GO [38].
Figure 1
Figure 1.
The morphology and structural characterization of the LCSG anode material. (a, b) SEM images at different magnifications. (c-e) Elemental mappings corresponding to the SEM image of (b). (f, g) TEM images at different magnifications. (h, i) Comparison of XRD patterns and Raman spectra between LCSG, Se and GO.
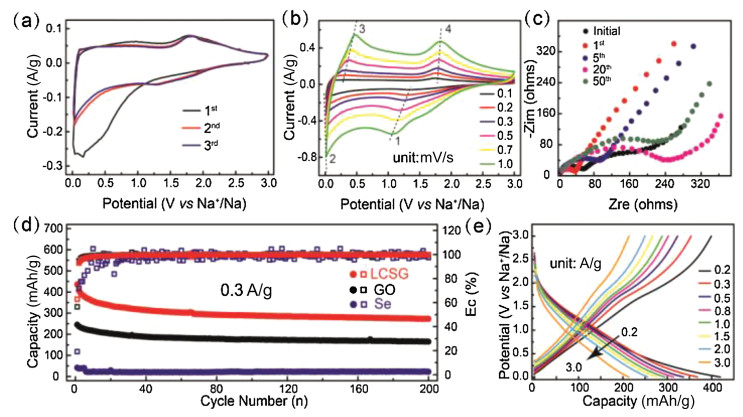
Figure 2.
Electrochemical performance of the LCSG anode in 1 mol/L NaPF6/EC:EMC electrolyte. (a) CV curves of the LCSG anode at 0.1 mV/s. (b) CV curves of the various scan rates. (c) EIS analysis of 0-50 cycles. (d) Charge capacity and CE of the LCSG composite, GO and bulk Selenium over 200 discharge-charge (DC) cycles at current density of 0.3 A/g. (e) DC curves of LCSG half-cell at various current densities.
Through the tests of cyclic voltammetry (CV), electrochemical impedance spectra (EIS) and galvanostatic charge-discharge (GCD), the LCSG anode exhibits excellent and stable electrochemical performance. The initial three cycles of CV curves at 0.1 mV/s are draw in Fig. 2a. In the 1st cycle, a visible cathodic peak appears from 1.05 V to 0.1 V, which is due to the growing of solid electrolyte interphase (SEI) film (reduction decomposition of EC) and decomposition of impurities in the electrolyte [39], fortunately, this situation improves in the 2nd cycle. Fig. 2b shows the CV curves of various scan rates, there are two main pairs of redox peaks in all the curves. Among them, the peak potential at 1.45 V (dotted line:1) and 0.05 V (dotted line:2) correspond to the electrochemical process of Na+ reacts with Se to form Na2Se and Na+ storage of reduced graphene oxide (rGO), respectively. As for the charging, rGO release Na+ at 0.2 V (dotted line:3), and Na2Se provides Na+ at 1.77 V (dotted line:4) [40]. The EIS analysis in Fig. 2c shows the charge transfer resistance (Rct) of 1st cycle (39 Ω) is less than the initial state (62 Ω). Furthermore, the diffusion ability of 1st cycle is also stronger than the initial state in the low frequency region. This may be due to the reduction decomposition of EC during the 1st discharging, thereby forming a SEI film containing large amounts of organic components, which is beneficial for Na+ transmission (or diffusion). Nevertheless, the Rct of 5th cycle is larger than the initial state and the 1st cycle, and the subsequent Rct gradually increases, because the structure of LCSG anode material has changed after several-time discharge-charge cycles. This phenomenon has also appeared in other literatures. As shown in Fig. 2d, the LCSG show outstanding cycling performance, which exhibits an initial discharge capacity of 435.4 mAh/g and the initial coulombic efficiency (ICE) of 62.28%. Despite the charge specific capacity has decreased, it still retains a specific capacity of 272.8 mAh/g after 200 cycles. Furthermore, the extremely high CE (≈ 100%) appeared after 20 cycles. This is benefit for the match of a suitable cathode and the assembly of a full cell, as a highly reversible Na+ storage process really prevents large changes in electrolyte concentration. In contrast, GO and bulk Selenium have poor cycling stability in half-cell, among them, the capacity of bulk Selenium is only 40 mAh/g. In Fig. 2e, LCSG anode shows outstanding rate performance: the charge specific capacity is 406, 337, 308, 284, 267, 247, 232 and 213 mAh/g at 0.2, 0.3, 0.5, 0.8, 1.0, 1.5, 2.0 and 3.0 A/g, respectively. Although the rGO has specific capacity less than 120 mAh/g at high current density, the selenium in LCSG still provides stable capacity contribution (Fig. S5 in Supporting information).
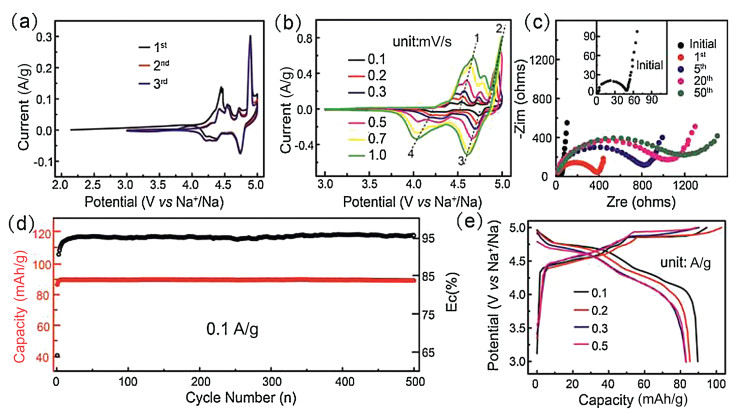
Graphite is widely used as the cathode of DIBs, which is due to the PF6- anion intercalate into the highly ordered layer structure of graphite above 4.4 V (vs. Na+/Na) (Fig. S6 in Supporting information) [41]. The graphite cathode exhibits superior electrochemical performance in 1 mol/L NaPF6/EC:EMC at 3-5 V (vs. Na+/Na). Fig. 3a shows the CV curves at 0.1 mV/s, the initial three cycles of graphite are obtained. In the 1st cycle, there is a strong and broad anodic peak at 4.21-4.55 V, which because the intercalation of PF6- anion in the graphite and the cathode electrolyte interphase (CEI) film formed by oxidative decomposition of EMC [14, 41]. Therefore, the first charge specific capacity of graphite is larger than the subsequent ones, and the low ICE is inevitable. In the CV curves of various scan rates (Fig. 3b), graphite cathode has five groups of redox peaks: anodic peaks have 4.28, 4.42, 4.54 (dotted line: 1), 4.72 and 4.89 V (dotted line: 2); cathodic peaks have 4.74 (dotted line: 3), 4.53, 4.36, 4.29 and 4.21 V (dotted line: 4). Similarly, the potentials of redox peaks correspond to the process of PF6- intercalation/de-intercalation. As for the EIS analysis of graphite cathode (Fig. 3c), the Rct becomes larger as the number of cycles increased, and the diffusion ability of graphite cathode gradually weakens in low frequency region. The unstable CEI film obtained by oxidative decomposition of EMC leads to the constant decomposition of PF6- and the production of plenty of inorganic components [42], which is harmful to ion diffusion. Fig. 3d shows the excellent cyclic performance of graphite at 0.1 A/g, and the discharge capacity still retains 89.2 mAh/g after 500 cycles. Besides, graphite cathode exhibits good rate performance (> 80 mAh/g) at 0.1-0.5 A/g (Fig. 3e).
Figure 3
Figure 3.
Electrochemical performance of the graphite cathode in 1 mol/L NaPF6/EC:EMC electrolyte. (a) CV curves of the graphite cathode at 0.1 mV/s. (b) CV curves of various scan rates. (c) EIS analysis of 0-50 cycles. (d) Discharge capacity and CE of the graphite half-cell over 500 charge-discharge (CD) cycles at current density of 0.1A/g. (e) CD curves of graphite half-cell at various current densities.
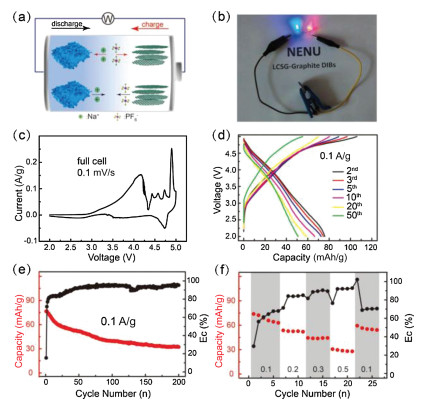
This DIFB was assembled by LCSG anode and graphite cathode. In Fig. 4a, the Schematic illustration and working mechanism of the LCSG-graphite DIFB are presented: 1) during charging, both cations (Na+) and anions (PF6-) move towards anode and cathode, respectively. 2) during discharging, the cations in LCSG and the anions in graphite layers return to the electrolyte simultaneously. This DIFB can light two series-connected LED lights after charging (Fig. 4b), which means LCSG-graphite DIFB can meet a small number of low-voltage equipment. For the CV curves of the DIFB, there are some similarities with graphite/Na half-cell. Fig. 4c shows the CV curves at 0.1 mV/s, five anodic peaks (a broad peak: 2.92-4.29 V, four narrow peaks:4.43, 4.57, 4.72 and 4.95 V) and three cathodic peaks (4.73, two broad peaks: 4.18-3.44 and 3.03-2.22 V) were recorded. On the other hand, the anodic peaks positions of graphite/Na half-cell and DIFB are almost consistent excluding lowest and highest reaction voltage during charging (Fig. S7 in Supporting information). From 2.92 V to 4.29 V, this peak area is unexpectedly large, which probably be caused by serious side reactions (SEI film and CEI film form simultaneously) during the first charging [39, 43]. In Fig. S8 (Supporting information), there is an obvious side reaction at 2.90-4.05 V, and this phenomenon is consistent with the results of CV curves. Generally, severe side reaction causes the low ICE, and fortunately, this situation improved in the 2nd cycle, and the CE rise to a higher value. Fig. 4d shows the galvanostatic profiles of DIFB at various cycles, the CE and discharge capacity of the 2nd cycle is 71.6% and 75.9 mAh/g, respectively, which indicates that the side reaction has weakened and the full-cell starts running normally. Furthermore, the medium output voltage of DIFB is 3.5 V, this is advantageous for achieving the high energy density of batteries. Despite the capacity decay, the discharge capacity of the 50th cycle is 51.0 mAh/g, and achieving 67.2% of initial discharge capacity retained (Fig. 4e). After 200 cycles at 0.1 A/g, the discharge capacity and capacity retention are 31.5 mAh/g and 41.5%, respectively. Note that, the DIFB need a wide voltage range (2-5 V) to provide high capacity (Fig. S9 in Supporting information). In Fig. 4f, the DIFB exhibits favorable rate performance and delivers the discharge specific capacity of 52.6, 44.1 and 28.9 mAh/g at 0.2, 0.3 and 0.5 A/g, respectively. In a word, LCSG-graphite DIFB displays acceptable cyclic and rate performance. Among them, high capacity of 75.9 mAh/g and high medium output voltage of 3.5 V are rare at the research field of sodium-based GC-DIBs. Finally, this DIFB achieved an electrodemass-based energy density of 265.65 Wh/kg with the power density of 354.2 W/kg. However, the polarization phenomenon of cyclic process is the chief culprit of causing capacity decay (Fig. 4d), so we speculated two reasons for this dilemma: 1) the LCSG anode have weak diffusion ability of Na+; 2) the low capacity retention ratio of LCSG anode.
Figure 4
Figure 4.
Electrochemical performance of the LCSG-graphite DIBs. (a) Schematic illustration and working mechanism of the LCSG-graphite DIB. (b) Picture of full cell lighting two LED lights. (c) CV curves of full cell at 0.1 mV/s. (d) CD curves for full cell of various cycles at 0.1 A/g. (e) Discharge capacity and CE of full cell over 500 CD cycles at current density of 0.1 A/g. (f) Rate performance of full cell.
To further confirm, we compared the diffusion ability of Na+ and PF6- in half-cell system. A simple and effective cyclic voltammetry is adopted to evaluate the ion diffusion coefficients. The results are presented in Fig. S10 and Table S1 (Supporting information). As a result, the diffusion degree of Na+ cation and PF6- anion have an obvious difference, which the values approximate an order of magnitude. For detail, the diffusion ability of Na+ is stronger than the other one, so we think this is because LCSG has the wrinkled layered structure and the high specific surface area, which is beneficial to Na+ cation transmission. Therefore, it is urgent to optimize the performance of full cell by improving the cycling stability of LCSG anode. In view of the shortage of LCSG anode, we provide the following solutions which may be used to improve the battery performance: 1) employing other carbon-based materials with higher structure stability, like carbon nanofibers (As shown in Fig. 2d, the capacity decay trend of LCSG is similar to GO); 2) adding acceptable electrolyte additives to avoid low ICE of half cells (anode: 62.3%, cathode: 64.1%) and full cells.
In summary, the LCSG as anode for sodium-based GC-DIBs was reported for the first time. This LCSG-graphite DIFB exhibited favorable cyclic and rate performance, high capacity (75.9 mAh/g at 0.1 A/g) and high medium output voltage (3.5 V), achieved an electrode-mass-based energy density (265.65 Wh/kg). By the mean of cyclic voltammetry tests, we summarized the reasons why the capacity decay and provided potentially effective solutions to improve the battery performance. We think this work is helpful for the development of low-cost and high energy density EES device.
Declaration of competing interest
The authors declare that they have no known competing financial interests or personal relationships that could have appeared to influence the work reported in this paper.
Acknowledgments
We gratefully acknowledge the financial support by the National Natural Science Foundation of China (No. 91963118), and Fundamental Research Funds for the Central Universities (No. 2412019ZD010).
J. Xu, R.D. Deshpande, J. Pan, Y.T. Cheng, V.S. Battaglia, J. Electrochem. Soc. 162(2015) A2026-A2035. doi: 10.1149/2.0291510jes
Figure 1
The morphology and structural characterization of the LCSG anode material. (a, b) SEM images at different magnifications. (c-e) Elemental mappings corresponding to the SEM image of (b). (f, g) TEM images at different magnifications. (h, i) Comparison of XRD patterns and Raman spectra between LCSG, Se and GO.
Figure 2
Electrochemical performance of the LCSG anode in 1 mol/L NaPF6/EC:EMC electrolyte. (a) CV curves of the LCSG anode at 0.1 mV/s. (b) CV curves of the various scan rates. (c) EIS analysis of 0-50 cycles. (d) Charge capacity and CE of the LCSG composite, GO and bulk Selenium over 200 discharge-charge (DC) cycles at current density of 0.3 A/g. (e) DC curves of LCSG half-cell at various current densities.
Figure 3
Electrochemical performance of the graphite cathode in 1 mol/L NaPF6/EC:EMC electrolyte. (a) CV curves of the graphite cathode at 0.1 mV/s. (b) CV curves of various scan rates. (c) EIS analysis of 0-50 cycles. (d) Discharge capacity and CE of the graphite half-cell over 500 charge-discharge (CD) cycles at current density of 0.1A/g. (e) CD curves of graphite half-cell at various current densities.
Figure 4
Electrochemical performance of the LCSG-graphite DIBs. (a) Schematic illustration and working mechanism of the LCSG-graphite DIB. (b) Picture of full cell lighting two LED lights. (c) CV curves of full cell at 0.1 mV/s. (d) CD curves for full cell of various cycles at 0.1 A/g. (e) Discharge capacity and CE of full cell over 500 CD cycles at current density of 0.1 A/g. (f) Rate performance of full cell.

 DownLoad:

 下载:
下载:


