Figure 1.
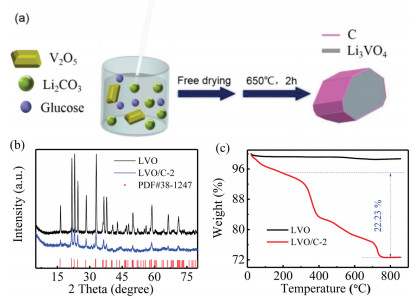
(a) Schematic illustration of the synthesis of carbon-coated LVO. (b) XRD patterns and (c) TGA profiles of the LVO and LVO/C-2.
Carbon-coated Li3VO4 with optimized structure as high capacity anode material for lithium-ion capacitors
Wenjie Liu , Xiong Zhang , Chen Li , Kai Wang , Xianzhong Sun , Yanwei Ma

Combining the high power of double-layer capacitors and the high energy of lithium-ion batteries, lithium-ion capacitors, as a kind of hybrid energy storage system which is effectively associated with the two devices, have gradually become the research and develop hotspot of energy storage devices in the past decades [1-6]. In the working process of LIC, the anode materials undergo the sluggish insertion/extraction process of lithium ions from the electrolyte, and the anions in the electrolyte are fast absorbed/desorbed on/near the surface of porous carbon materials cathode, simultaneously [7, 8]. Therefore, the kinetic mismatch of the two kinds of electrode materials hinders their full utilization of energy [9].
Among the three major categories of battery-type anode materials, insertion type materials like graphite, are the most widely used commercial electrode materials, which benefit from their high reversibility and low cost. However, the low potential of graphite vs. Li+/Li (< 0.2 V) causes the serious safety hazards of lithium dendrite growth. The alloy type (Sn-based) [10] and conversion type materials (Fe3O4) [11, 12] suffer from huge volume change and electrode polarization, which make them are not suitable for the LICs anode. Another Ti/Nb-based insertion type materials (such as Li4Ti5O12 [13], TiO2 [14, 15], Nb2O5 [16]), which are known as almost zero-strain materials during Li+ insertion process, exhibit high rate performance and excellent cycle life. However, the high voltage platform versus Li metal (above ~1.5 V) and limited capacity (≤ 250 mAh/g) [17] impede their further development in LICs. Hence, it is urgent to find an insertion type material with high capacity and suitable lithium intercalation voltage. Recently, Li3VO4 has aroused extensive concerns as LIBs anode materials owing to its appropriate Li+ insertion voltage (0.5~1.0 V), high theoretical capacity (~394 mAh/g), and low-cost [18, 19]. However, the intrinsic inferior electronic conductivity (lower than 10-10 S/m) of LVO [20] results in poor rate performance and lower energy efficiency [17]. Up to now, rational structure design [21], reducing the size to nano-scale [22], surface modification [23, 24], carbon coating [25, 26], and heteroatom doping (e.g., N, S) [27, 28] are the effective ways to deal with this problem in battery-type materials. On this basis, Wang et al. [29] proposed a quasi-solid-state LIC device based on LVO/carbon nanofibers//graphene sheets. The LIC demonstrated an energy density of 110 Wh/kg and 86% capacity retention after 2400 cycles. Xu et al. [30] prepared high performance hierarchically porous LVO/C material coupled with mesoporous carbon for LICs. The device generated an energy density of 105 Wh/kg and ~71% capacitance retention after 2000 cycles. However, numerous researches have concentrated on the nano-engineering of LVO or composite with costly graphene/carbon nanotube through a complicated process. Thus, a simple and low-cost route to synthesize LVO with controllable carbon coating is clearly needed, and the electrochemical performance of LVO-based LIC should also be enhanced.
In this work, carbon-coated Li3VO4 composite was synthesized by a facial approach of a one-step solid-state reaction. Through controlling the content of carbon source, the optimal LVO/C electrode exhibits a special capacity of 435 mAh/g at the current density of 0.07 A/g. Even after 500 cycling tests at 0.5 A/g, the electrode capacity has hardly obvious attenuation. Furthermore, based on the optimal LVO/C anode, a hybrid energy storage LIC device was assembled with activated carbon (AC) cathode, denoted as AC//LVO-C. By adjusting the weight ratio of active material between cathode and anode to achieve capacity matching, the optimal LIC delivers the maximum energy density of 110 Wh/kg, and after 5000 cycles at the current density of 1 A/g, the capacity retention can still reach 79%.
The LVO/C composite materials were synthesized as presented schematically in Fig. 1a. Detailed experiment methods are provided in supporting information. Typically, vanadium pentoxide and lithium carbonate powders (with the molar ratio of 3:1) were dissolved in deionized water with 2 g of glucose, and then freeze-dried followed by solid-state reaction at 650 ℃ for 2 h, resulting the final product of carbon-encapsulated Li3VO4 (denoted as LVO/C-2). For comparison, glucose contents with 0, 0.5, 1 and 4 g were also prepared at the same synthesis condition, and the corresponding final products are denoted as LVO, LVO/C-0.5, LVO/C-1, and LVO/C-4, respectively. The crystal structure of LVO/C was investigated though X-ray diffraction (XRD), as shown in Fig. 1b. Obviously, all the peaks position for both the LVO and LVO/C-2 samples are in accordance with the orthorhombic LVO phase (PDF card No. 38-1247), indicating no impurities. The peaks intensity of LVO/C-2 is weaker than that of LVO due to the influence of carbon coating, and a similar phenomenon occurs on LVO/C-0.5, LVO/C-1, and LVO/C-4 composites, respectively (Fig. S1a in Supporting information). To determine the carbon content in LVO/C, thermogravimetric analysis (TGA) was measured. Fig. 1c reveals that the weight loss ratio of the pure LVO sample is tiny (only ~1.3 wt%), and the LVO/C-2 contains ~22.2 wt% carbon. The TGA curves for other LVO/C composites are provided in Figs. S1b-d (Supporting information). With the addition of glucose, the carbon content in LVO/C composite increases gradually.
The morphology and structure of various LVO/C composites were acquired by scanning electron microscopy (SEM) and transmission electron microscopy (TEM), as exhibited in Fig. 2. The average diameters of small bulk LVO particles are 1–10 mm with flat surfaces (Figs. 2a and c). After solid-state reaction with glucose, the overall morphology and particle size of LVO/C-2 composites (Fig. 2b) are barely changed except that the surface becomes rougher due to carbon coating, which can be seen from the Fig. 2d. As the carbon source varies from 0.5 g to 4.0 g, the thickness of the carbon layer increases with a rougher surface (Figs. S2a-d in Supporting information). When the carbon source content increases to 4 g, the carbon layer may even rupture as shown in Figs. S2e and f. Thus a suitable thickness of the carbon layer is necessary. The TEM images presented in Figs. 2e and f further reveal the structure and morphology of LVO/C-2 samples. Most of LVO/C-2 materials are bulk particles and the highresolution TEM image in Fig. 2f discloses that the LVO bulk particle is encapsulated by a subtle layer of carbon with a thickness of 1-3 nm. The thin carbon layer can effectively improve the electronic conductivity of LVO through acting as an electronic contact channel between internal particles [17]. Additionally, a clear lattice fringe spacing of 2.47 nm can be found in Fig. 2f, which is in accord with the d-spacing of LVO (002) planes. To determine the presence and distribution of V, O and C elements, element mapping was conducted by EDAX as shown in Fig. 2g. On the whole, the C element is homogeneously dispersed in the bulk particles, indicating the formation of a carbon-coated LVO composite structure.

Furthermore, X-ray photoelectron spectroscopy (XPS) was conducted to analyze the chemical constituents and surface chemical bonding states of the LVO/C-2 sample. As presented in Fig. 3, all elements (V, Li, O and C) of LVO/C-2 were detected. The high-resolution V 2p spectrum (Fig. 3a) reveals the binding energy at 517.5 and 524.9 eV, which in line with the V 2p3/2 and V 2p1/2 feature peaks of V5+ in LVO, separately [31]. In Fig. 3b, the binding energy at 55.3 eV is attributed to the Li 1s typical peak [32]. The O 1s spectrum (Fig. 3c) could separate into three peaks, corresponding to various binding states of oxygen [20, 33]. The weak peaks at 529.7 and 533.3 eV are caused by the V—O bond and H2O molecules [34], respectively. The peak center near 531.8 eV is ascribed to the O—H bond. Fig. 3d is the spectrum of highresolution C 1s, which can be split into four peaks. The binding energy at 284.4 eV arises from graphitic carbon. Meanwhile, the peaks position at 284.9, 285.9 and 290.0 eV correspond to C—C, C—OH, and O=C—O bond, separately [31, 34, 35]. The consequences of XPS have identified that glucose has been successfully carbonized and subsequently coated on the surface of LVO particles, which is beneficial to improve the electronic conductivity and increase the active site of LVO/C composite.

To investigate the electrochemical properties of LVO/C electrodes, galvanostatic tests were conducted in hall-cell at voltage extent of 0.01~3.0 V versus Li foil. Fig. 4a displays discharge/charge curves of the LVO/C-2 electrode at a current density of 0.07 A/g. The irreversible capacity in the first cycle is 162 mAh/g (discharge 621 and charge 459 mAh/g capacity) and the corresponding coulombic efficiency (CE) is 73.9%. The main reason for this phenomenon is that lithium-ion participates in the formation of a solid electrolyte interface (SEI) film and other side reactions [36]. The voltage platform of LVO/C-2 electrode is below 1.5 V, which is similar to the curve of pure LVO electrode (Fig. 4b). After the first cycle, the charge capacity of LVO/C-2 composite maintains at about 435 mAh/g for subsequent cycles, superior to the pure LVO electrode (initial charge capacity of 210 mAh/g and then gradually dwindles). This phenomenon verifies the high capacity and stability of LVO/C-2 composite. Meanwhile, the electrochemical impedance spectroscopy presented in Fig. S3a (Supporting information) reveals that the LVO/C-2 composite has a higher electronic conductivity with a smaller Rct (~147 Ω) value compared to that of the LVO electrode (~421 Ω). The rate performances of LVO/C-2 and LVO electrode are also assessed at various current densities, as shown in Fig. 4c. It is obvious that the LVO/C-2 electrode delivers charge capacity of 416, 359, 282, 195, 110 and 69 mAh/g at current density of 0.1, 0.2, 0.5, 1.0, 2.0 and 3.0 A/g, respectively. The capacity recovers to its initial value when the current density returns to 0.1 A/g, demonstrating the high reversibility process of Li+ intercalation/deintercalation into LVO/C composite. Compared to the LVO/C-2 electrode, the rate capability of pure LVO electrode is rather poor, and the residual capacity is only 20 mAh/g at 3 A/g. Moreover, after 500 cycling tests at the current density of 0.5 A/g, the LVO/C-2 electrode shows impressive cycle stability with nearly 100% capacity retention and coulombic efficiency (Fig. 4d). The outstanding electrochemical features of the LVO/C-2 sample can be attributed to the enhanced electronic conductivity of LVO/C composite by effective carbon coating. On the other hand, the interface of carbon/electrolyte is quite stable than that of LVO directly in contact with the electrolyte [37, 38]. Meanwhile, the influences of various carbon-coated LVO/C composites are exhibited in Fig. S3b (Supporting information). As the current density gradually increases from 0.1 A/g to 3.0 A/g, the rate capability of LVO/C-2 outperforms other LVO/C composites. The reason for this phenomenon lies in the thickness of the coated carbon layer. Low carbon content will cause the formation of an unstable carbon layer and increase the risk of direct contact between internal LVO and electrolyte. In addition, the thicker carbon layer caused by high carbon resources will increase the ion transport paths, which severely hampers the rate performance of LVO/C composite [39].

To further study the Li-ion transport dynamics of LVO/C-2 composite electrode, cyclic voltammetry (CV) experiments were conducted within a voltage range of 0.01–3.0 V vs. Li/Li+, as presented in Fig. 5a. Along with the increase of scan rate, the position of current peaks shows no obvious deviation. The redox peaks are ascribed to the lithium-ion insertion/extraction into/from LVO material, which can be explained by the following reaction [40, 41]:

|
|
(1) |
Typically, the power-law (Eq. (2)) [42] is a common means to investigate the relationship between response current (i) and scan speed (v, mV/s)
|
|
(2) |
Herein, a and b are controllable parameters. The b value can be acquired from the slope of the log(v)-log(i) fitting curves, and various b values represent different types of charge-storage mechanism. For b = 0.5, the charge-storage is mainly dominated by diffusion-controlled behavior, whereas b value of 1.0 reveals the current derives from an ideal capacitive/surface process. As shown in Fig. 5b, the calculated b values based on the right redox peak current of the LVO/C-2 electrode are 0.75 and 0.68, respectively. It can be concluded that the capacity of LVO/C-2 electrode is affected by the two charge-storage mechanisms. On this basis, the proportion of capacity contribution for the capacitive process and diffusion-controlled reaction can be determined by the Eq. (3) [16, 43].
|
|
(3) |
Where k1 and k2 are the constant values corresponding to the given voltage. And for k1v and k2v1/2 represent the effect of capacitive and diffusion-controlled, separately. The results of capacity contribution ratio at various scan rates are presented in Figs. 5c and d. The capacitive process provides a 29.6% capacity contribution (region in red line) for the LVO/C-2 electrode at the scan rate of 0.1 mV/s. When the scan rate increases to 1 mV/s, the ratio of capacitive effect gradually elevates to 45.7%, which means that more reactions generate on the surface/near-surface of the LVO/C-2 electrode [30].
In addition, the optimal LVO/C-2 material was employed as anode and commercial AC (YP80F) as cathode for assembling a hybrid LIC. During the charging process, the lithium-ion inserts in LVO/C anode. Meanwhile, PF6- anion is absorbed on/near the surface of AC [44]. The discharging process is a thorough inverse reaction of the above process, as illustrated in Fig. 6a. Before assembling the AC//LVO/C hybrid capacitor for measuring, the LVO/C electrode undergoes a prelithiation procedure (by chargingdischarging several cycles and then discharge to the voltage of 0.01 V at the last time). Due to the kinetics difference of the two energy storage mechanisms, the capacity balance between the LVO/C and AC electrode is particularly critical, which can be adjusted by the active material weight ratio of cathode and anode [27, 45]. The LIC with weight ratio of 1:4 (based on the weight of active material for LVO/C and AC electrode) can achieve the highest capacity at current densities range from 0.2 A/g to 2.0 A/g (as revealed in Fig. S4 in Supporting information). Figs. 6b and c are the charge/discharge curves for the optimal LIC in a voltage range of 1–4 V at various current densities. The profiles slightly deviate from the ideal capacitive linear of triangle due to the existence of the battery-type charge storage mechanism. The corresponding rate capability of AC//LVO/C is obtained as shown in Fig. 6d. The LIC can deliver the maximum capacity of 55 F/g (based on total active materials mass of the two electrodes) at 0.02 A/g, and the capacity dwindles to 19 F/g when the current density increases to 2 A/g. Moreover, the cycling performance of the AC//LVO/C device is measured at the current density of 1 A/g (Fig. 6e). The CE for the LIC is nearly 100% in 5000 cycle tests with capacity retention about 79%, much higher than the results reported in the literature [27, 29, 30]. The desirable cycle ability of AC//LVO/C indicates the stable of the carbon-coated insertion-type LVO material. The Ragone plots of the AC//LVO/C device are summarized in Fig. 6f. A maximum energy density of 110 Wh/kg (with a power density of 61 W/kg) can be delivered, and the device can also achieve a high power density of 4.9 kW/kg (with an energy density of 38.9 Wh/kg). Overall, the Ragone plots results are superior to previous results of LICs based on AC//insertion-type materials [46-51]. Hence, the excellent performance of the hybrid AC//LVO/C device is ascribed to the capacity match of cathode/anode electrode, the improved transmission rate of the electron/ion, and the stability of LVO by carbon coating.

In conclusion, hierarchical LVO/C composite material was synthesized by a facial one-step solid-state reaction method. The optimal carbon-coated LVO/C-2 composite displays an impressive special capacity of 435 mAh/g at 0.07 A/g and excellent cycling performance (almost no evident capacity attenuation after 500 cycles at 0.5 A/g), which indicate the high capacity and stability of the LVO/C materials. Furthermore, a hybrid capacitor is assembled by AC as a cathode combined with LVO/C anode. The optimal LIC delivers a high energy density of 110 Wh/kg, favorable rate capabilities and pronounced long cycle life with 79% capacity retention (5000 cycles at 1 A/g). The superior electrochemical performance of LVO/C is attributed to the high conductivity of carbon encapsulated LVO and the stable hierarchical structure. These results have also demonstrated the application prospect of LVO/C in hybrid energy storage devices.
The authors declare that they have no known competing financial interests or personal relationships that could have appeared to influence the work reported in this paper.
This work was funded by the National Natural Science Foundation of China (Nos. 51677182 and 51822706), the DNL Cooperation Fund (No. DNL201915), the Beijing Municipal Science and Technology Commission (No. Z181100000118006) and the Beijing Nova Program (No. Z171100001117073).
Supplementary material related to this article can be found, in the online version, at doi:https://doi.org/10.1016/j.cclet.2019.11.015.
B. Li, J. Zheng, H. Zhang, et al., Adv. Mater. 30(2018) 1705670. doi: 10.1002/adma.201705670
A. Muzaffar, M.B. Ahamed, K. Deshmukh, J. Thirumalai, Renew. Sust. Energy Rev. 101(2019) 123-145. doi: 10.1016/j.rser.2018.10.026
J. Zhang, J. Wang, Z. Shi, Z. Xu, Chin. Chem. Lett. 29(2018) 620-623. doi: 10.1016/j.cclet.2018.01.031
C. Peng, J. Yu, S. Chen, L. Wang, Chin. Chem. Lett. 30(2019) 1137-1140. doi: 10.1016/j.cclet.2019.02.007
C. Li, X. Zhang, C.K. Sun, et al., J. Phys. D:Appl. Phys. 52(2019) 143001. doi: 10.1088/1361-6463/aaff3a
Y. Li, X. Han, T. Yi, et al., J. Energy Chem. 31(2019) 54-78. doi: 10.1016/j.jechem.2018.05.010
D. Cericola, P. Novák, A. Wokaun, R. Kötz, J. Power Sources 196(2011) 10305-10313. doi: 10.1016/j.jpowsour.2011.07.032
X.Z. Sun, X. Zhang, H.T. Zhang, et al., J. Power Sources 270(2014) 318-325. doi: 10.1016/j.jpowsour.2014.07.146
Z. Shi, J. Zhang, J. Wang, et al., Electrochim. Acta 153(2015) 476-483. doi: 10.1016/j.electacta.2014.12.018
A. Manthiram, J. Phys. Chem. Lett. 2(2011) 176-184. doi: 10.1021/jz1015422
P.G. Bruce, B. Scrosati, J.M. Tarascon, Angew. Chem. Int. Ed. 47(2008) 2930-2946. doi: 10.1002/anie.200702505
X.R. Zhao, X. Zhang, C. Li, et al., ACS Sustain. Chem. Eng. 7(2019) 11275-11283. doi: 10.1021/acssuschemeng.9b00641
L.F. Shen, H.E. Li, E. Uchaker, et al., Nano Lett. 12(2012) 5673-5678. doi: 10.1021/nl302854j
Y.X. Tang, Y.Y. Zhang, J.Y. Deng, et al., Adv. Mater. 26(2014) 6111-6118. doi: 10.1002/adma.201402000
Y. Fang, R. Hu, B. Liu, et al., J. Mater. Chem. A 7(2019) 5363-5372. doi: 10.1039/C8TA12069B
V. Augustyn, J. Come, M.A. Lowe, et al., Nat. Mater. 12(2013) 518-522. doi: 10.1038/nmat3601
L.F. Shen, S.Q. Chen, J. Maier, Y. Yu, Adv. Mater. 29(2017) 1701571. doi: 10.1002/adma.201701571
H.Q. Li, X.Z. Liu, T.Y. Zhai, et al., Adv. Energy Mater. 3(2013) 428-432. doi: 10.1002/aenm.201200833
G. Yang, B.W. Zhang, J.Y. Feng, et al., J. Mater. Chem. A 6(2018) 456-463. doi: 10.1039/C7TA09023D
C. Zhang, H. Song, C. Liu, et al., Adv. Funct. Mater. 25(2015) 3497-3504. doi: 10.1002/adfm.201500644
J. Liu, P.J. Lu, S.Q. Liang, et al., Nano Energy 12(2015) 709-724. doi: 10.1016/j.nanoen.2014.12.019
J.C. Zhang, S.B. Ni, T. Kang, et al., J. Mater. Chem. A 4(2016) 14101-14105. doi: 10.1039/C6TA05988K
Y. Shi, J.Z. Wang, S.L. Chou, et al., Nano Lett. 13(2013) 4715-4720. doi: 10.1021/nl402237u
S.F. Zhao, L.Z. Zeng, G. Cheng, et al., Chin. Chem. Lett. 30(2019) 605-609. doi: 10.1016/j.cclet.2018.10.018
Y. Yang, J.Q. Li, X.Y. He, et al., J. Mater. Chem. A 4(2016) 7165-7168. doi: 10.1039/C6TA01996J
J. Jiang, K. Zhu, Y. Fang, et al., J. Colloid Interface Sci. 530(2018) 579-585. doi: 10.1016/j.jcis.2018.07.019
L.F. Shen, H.F. Lv, S.Q. Chen, et al., Adv. Mater. 29(2017) 1700142. doi: 10.1002/adma.201700142
Y. Luan, R. Hu, Y. Fang, et al., Nano-Micro Lett. 11(2019) 30-42. doi: 10.1007/s40820-019-0260-6
F.X. Wang, Z.C. Liu, X.H. Yuan, et al., J. Mater. Chem. A 5(2017) 14922-14929. doi: 10.1039/C7TA03920D
X.N. Xu, F. Niu, D.P. Zhang, et al., J. Power Sources 384(2018) 240-248. doi: 10.1016/j.jpowsour.2018.03.007
M. Sathiya, A.S. Prakash, K. Ramesha, et al., J. Am. Chem. Soc.133(2011) 16291-16299. doi: 10.1021/ja207285b
Y. Huang, F.M. Jin, F.J. Chen, L. Chen, J. Power Sources 256(2014) 1-7. doi: 10.1016/j.jpowsour.2014.01.003
L. Chen, X.L. Jiang, N. Wang, et al., Adv. Sci. 2(2015) 1500090. doi: 10.1002/advs.201500090
D. Zhao, M.H. Cao, ACS Appl. Mater. Interfaces 7(2015) 25084-25093. doi: 10.1021/acsami.5b05269
C.K. Zhang, C.F. Liu, X.H. Nan, et al., ACS Appl. Mater. Interfaces 8(2016) 680-688. doi: 10.1021/acsami.5b09810
P. Tartaj, J.M. Amarilla, M.B. Vazquez-Santos, Chem. Mater. 28(2016) 986-993. doi: 10.1021/acs.chemmater.5b05018
E. Pohjalainen, J. Kallioinen, T. Kallio, J. Power Sources 279(2015) 481-486. doi: 10.1016/j.jpowsour.2014.12.111
X.T. Wang, B. Qin, D. Sui, et al., Energy Technol. 6(2018) 2074-2081. doi: 10.1002/ente.201800186
Y. Wang, X. Fu, M. Zheng, et al., Adv. Mater. 31(2018) 1804204.
Y. Shi, J.Z. Wang, S.L. Chou, et al., Nano Lett. 13(2013) 4715-4720. doi: 10.1021/nl402237u
Z.L. Jian, M.B. Zheng, Y.L. Liang, et al., Chem. Commun. 51(2015) 229-231. doi: 10.1039/C4CC07444K
H. Lindstrom, S. Sodergren, A. Solbrand, et al., J. Phys. Chem. B 101(1997) 7717-7722. doi: 10.1021/jp970490q
T. Brezesinski, J. Wang, S.H. Tolbert, B. Dunn, Nat. Mater. 9(2010) 146-151. doi: 10.1038/nmat2612
X.Z. Sun, X. Zhang, W.J. Liu, et al., Electrochim. Acta 235(2017) 158-166. doi: 10.1016/j.electacta.2017.03.110
S.J. Zhang, C. Li, X. Zhang, et al., ACS Appl. Mater. Interfaces 9(2017) 17136-17144. doi: 10.1021/acsami.7b03452
H.G. Jung, N. Venugopal, B. Scrosati, Y.K. Sun, J. Power Sources 221(2013) 266-271. doi: 10.1016/j.jpowsour.2012.08.039
E. Lim, C. Jo, H. Kim, et al., ACS Nano 9(2015) 7497-7505. doi: 10.1021/acsnano.5b02601
Z. Chen, V. Augustyn, J. Wen, et al., Adv. Mater. 23(2011) 791-795. doi: 10.1002/adma.201003658
H.H. Xu, X.L. Hu, Y.M. Sun, et al., Nano Energy 10(2014) 163-171. doi: 10.1016/j.nanoen.2014.09.003
V. Aravindan, W. Chuiling, S. Madhavi, J. Mater. Chem. 22(2012) 16026-16031. doi: 10.1039/c2jm32970k
H. Kim, M.Y. Cho, M.H. Kim, et al., Adv. Energy Mater. 3(2013) 1500-1506. doi: 10.1002/aenm.201300467

Figure 1 (a) Schematic illustration of the synthesis of carbon-coated LVO. (b) XRD patterns and (c) TGA profiles of the LVO and LVO/C-2.

Figure 2 SEM images of (a, c) LVO and (b, d) LVO/C-2 samples; (e, f) TEM images of the LVO/C-2 samples; (g) SEM image and corresponding C, O and V elemental mapping of LVO/C-2 composite.

Figure 3 High-resolution XRS spectra of LVO/C-2 composite for (a) V 2p, (b) Li 1s, (c) O 1s and (d) C 1s.

Figure 4 Electrochemical performances of LVO/C-2 composite and LVO at a voltage between 0.01 V to 3.0 V vs. Li/Li+. Discharge-charge curves at a current density of 0.07 A/g for (a) LVO/C-2 and (b) LVO. (c) Rate capability at various current densities from 0.1 A/g to 3 A/g. (d) Cycle life and CE for LVO/C-2 at a current density of 0.5 A/g.

Figure 5 Kinetics analysis of the LVO/C-2 electrode. (a) CV curves at scan rates range from 0.1 mV/s to 1.0 mV/s. (b) Relationship between peak current and sweep rate to determine b values. (c) CV curve of the LVO/C-2 electrode at 0.1 mV/s, the black line is total current and the red line is the capacitive current. (d) Contribution proportion of the capacitive and diffusion-controlled capacities at various scan rates.

Figure 6 Electrochemical properties of the AC//LVO/C LIC. (a) Schematic diagram of the charge storage mechanism for LIC. (b, c) Galvanostatic charge-discharge curves for LICs at different current densities (from 0.02 A/g to 2 A/g) with voltage range of 1–4 V. (d) Rate performance and (e) cycle life measurement and CE for 5000 cycles at a current density of 1 A/g. (f) Ragone plots of the AC//LVO/C (based on the total weight of active materials between cathode and anode electrodes) compared with the previously reported results.

 扫一扫看文章

扫一扫关注我们
 DownLoad:


 下载:
下载: