


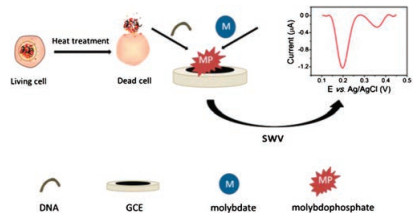
Scheme 1.
Schematic representation for the detection of cell concentration.
Electrochemical detection of cell concentration based on reaction of DNA with molybdate
Wenzhuo Zhang , Xingxing Jiang , Shuping Liu , Dan Zhao , Minghui Yang

Cell is the most basic structural and functional unit of the organism, and they are also the basic units that constitute human tissues and organs [1]. Abnormal cell concentration and viability can lead to abnormal function of human tissues and organs which will eventually lead to pathological changes. For example, the increase of white blood cell concentration usually indicates an infection [2], and the concentration of T lymphocytes in the internal environment reflects the immune status of human body [3]. Therefore, the detection of cell concentration and viability is important for determining the growth state of cells, tissues, organs, and the state of health of human body.
Traditional cell concentration detection is mainly based on cell counting under the microscope. One of the most classic is the cell counting plate method [4]. Cell counting plate method is simple in operation, but it has a narrow detection range. If the concentration of the cell suspension is lower than 104/mL, the number of cells cannot be measured by this method. Another method for detecting cell concentration is flow cytometry. It is a rapid quantitative analysis of individual cells or other biological particles by using monoclonal antibodies at the cellular and molecular level [5]. However, due to its complicated operation procedure, high cost, and high technical requirements for operators, the widespread use of flow cytometry has been limited. Therefore, the development of a simple and high sensitive method for detecting cell concentration with wide linear range is of great importance.
Electrochemical analysis is a type of instrumental analysis based on the electrochemical properties of the substance [6-12]. It has the advantages of high sensitivity, wide detection range and simple operation. Previously, our group reported in acidic solution, phosphate ions can react with molybdate to form phosphomo-lybdate precipitation and produce a corresponding redox current. Here is the chemical equation of this redox reaction (Eqs. 1-3) [13-15]:
|
|
(1) |
|
|
(2) |
|
|
(3) |
The intensity of the current generated is proportional to the concentration of phosphate ions. The single deoxynucleotide that make up the structure of the DNA molecular contains one molecule of deoxyribose, one molecule of nitrogenous base and one molecule of phosphoric acid. Our previous work has successfully used DNA as electrochemical current generator to detect cancer biomarkers [16, 17].
Cell death can be divided into two ways, cell necrosis and apoptosis [18-21]. Cell necrosis is a passive death caused by environmental factors, such as physical or chemical factors. Cell apoptosis is an active death process of cell controlled by genes. Both ways can break the cytoplasmic membrane, which causes the release of DNA molecules. Here, we studied an electrochemical assay for measuring the concentration of cells. Heat treatment was used to kill the cells, and then the supernatant of cells that containing the released DNA was collected by centrifugation and reacted with sodium molybdate solution under acidic conditions. The concentration of the cells was determined by measuring the current intensity. Because the cytoplasmic membrane of living cells is intact, there is no DNA released, therefore, the viability of the cells can also be determined by this method. This electro-chemical assay is simple, time efficient and has the advantages of high sensitivity, which can be widely used in various scientific research fields such as disease diagnosis and drug screening. The detailed experimental procedures are shown in Supporting information.
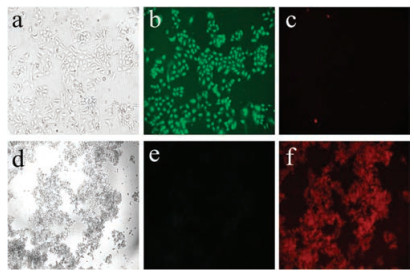
Hela cells can divide indefinitely and have a higher proliferation rate than other cancer cells [22-26]. So in this experiment we choose Hela cells as the object of detection. Scheme 1 shows the schematic representation for the detection of cell concentration. We stained the cells with propidium iodide (PI) and SYTO TM 9. The propidium iodide released red fluorescence after embedding into double-stranded DNA, which stained the dead cells in red [27-29]; while SYTO TM 9 stained the living cells green. Fig. 1a shows the morphology of living cells under bright light. It can be seen that the cells are attached to each other, and there are clear boundaries between the cells. Fig. 1d shows the morphology of the heat treated cells under bright light. It can be seen that the cells are broken and have no specific shape, and the cell fragment are aggregated together. Figs. 1b and c show the results of fluorescent staining of living cells, and Figs. 1e and f show the results of fluorescent staining of cells after heat treatment. It indicates that the method of heat treatment can effectively kill cells.
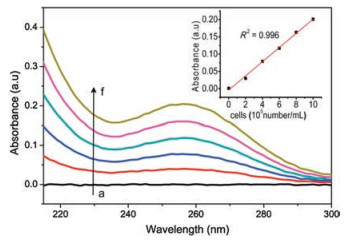
In order to confirm that the Hela cells are ruptured and DNA molecules are released after heat treatment, we characterized the supernatant of the heat-treated cells by UV-vis spectroscopy. DNA has a strong absorption peak at 260 nm and can be used to detect DNA qualitatively. The quantitative analysis of DNA can be performed by measuring the peak intensity at 260 nm.
We took a certain concentrations of cell suspension for heat treatment. The UV absorption spectrum of the supernatant is shown in Fig. 2. It can be seen that it has a distinct ultraviolet absorption peak at 260 nm, and the peak intensity is positively correlated with the cell concentration, indicating the release of DNA from cells.
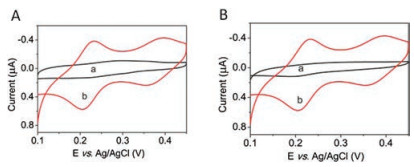
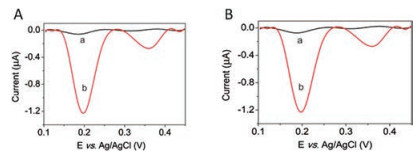
After cell death, the DNA molecules released from dead cells while the living cells don not have this phenomenon. Sodium molybdate reacts with phosphate group on the DNA molecule to form phosphomolybdate precipitate, which produces a redox current. Living cell supernatant and dead cell supernatant were mixed with 5 mmol/L sodium molybdate solution and tested by cyclic voltammetry (Fig. 3) as well as square wave voltammetry (Fig. 4). The results show that the current generated by control sample (0.9% NaCl solution, used to dilute cells) and living cell supernatant is very small, while the dead cell supernatant clearly produces strong redox current. Two pairs of redox peaks are shown at around 0.20 V and 0.36 V in both of the cyclic voltammetry and square wave voltammetry curves. This indicates that the NaCl solution does not react with sodium molybdate to generate electrochemical current as the NaCl solution does not contain DNA molecules, and then does not contain phosphate groups. The supernatant of living cells also does not contain DNA. However, the DNA released by the dead cells reacts with sodium molybdate and generated electrochemical current. Also, the modified electrode shows good stability. These results suggest that we can detect the cell concentration by detecting the concentration of DNA in the supernatant of dead cells, and then we can also detect the viability of cells.
After cell death, the concentration of DNA released from the cell is proportional to the concentration of the cell, and the current intensity induced is proportional to the DNA released. Therefore, we can measure cell concentration by measuring the electrochem-ical current intensity.
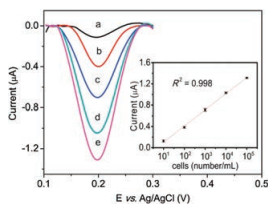
Different cell concentrations, from 101, 102, 103, 104 to 105 cells/mL were heat treated for 30 min, centrifuged to obtain cell supernatant and then mixed with sodium molybdate solution on the surface of the glassy carbon electrode for 20 min. The induced current was measured by square wave voltammetry. The results are shows in Fig. 5. It can be seen that the induced current intensity at 0.2 V is proportional to the concentration of the cells, and the detection range is from 101 to 105 cells/mL (R2 = 0.998) with detection limit calculated to be 1.21 cells/mL. We also studied the reproducibility of the assay, as shown by the error bars of the standard curve in Fig. 5, the sensor has a good reproducibility and the relative standard deviations (RSD) are within 4.8%.
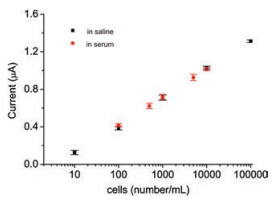
To prove potential clinical application of the assay, a recovery test was performed in human serum samples. The reaction of diluted blank serum and sodium molybdate produced a current intensity of 0.47 μA. Different concentrations of cells were added into the serum sample and then analyzed. The current intensity generated increased proportionally with the addition of cells. After subtraction of the current value of the blank serum, the resulted current intensities are basically consistent with current intensities of the same concentrations of cells measured in the 0.9% NaCl solution (Fig. 6). The calculated recovery rates of cells in different concentrations were 99.7% 104.9%, and the relative standard deviations (RSD) were < 5%. As shown in Table 1. This indicates that the assay has potential clinical application value.
In conclusion, we developed an electrochemical assay for rapid detection of cell concentration. It is based on the reaction of DNA released from dead cells with sodium molybdate to form redox precipitate and generate electrochemical current. This assay has wide detection range, high sensitivity and does not require complex operation. Detection limit can be as low as 1.21 cells/mL and the assay was successfully applied for detection cell in human serum, which indicated the assay has potential clinical applications.
This work was supported by the National Natural Science Foundation of China (No. 21575165).
Supplementary material related to this article can be found, in the online version, at doi:https://doi.org/10.1016/j.cclet.2019.08.050.
J. Boonstra, J. Cell. Biochem. 90(2003) 244-252. doi: 10.1002/jcb.10617
Y. Zhang, J. Bai, H. Wu, J.Y. Ying, Biosens. Bioelectron. 69(2015) 121-127. doi: 10.1016/j.bios.2015.02.019
M.A. Purbhoo, D.J. Irvine, J.B. Huppa, M.M. Davis, Nat. Immunol. 5(2004) 524-530. doi: 10.1038/ni1058
J.M. Basgen, S.B. Nicholas, M. Mauer, S. Rozen, J.R. Nyengaard, Nephron Exp. Nephrol. 103(2006) e139-e148. doi: 10.1159/000092905
J.L. Weaver, Methods 21(2000) 199-201. doi: 10.1006/meth.2000.1000
Q. Zhu, C. Liu, L. Zhou, et al., Biosensor Bioelectron. 140(2019)111356. doi: 10.1016/j.bios.2019.111356
X. Li, C. Shen, M. Yang, A. Rasooly, Anal. Chem. 90(2018) 4764-4769. doi: 10.1021/acs.analchem.8b00023
Z. Sun, T. Liao, Y. Zhang, et al., Biosens. Bioelectron. 86(2016) 194-201. doi: 10.1016/j.bios.2016.06.059
M. Sun, Z. Li, Y. Xia, C. Zhao, H. Liu, Anal. Chim. Acta 1046(2019) 110-114. doi: 10.1016/j.aca.2018.09.029
Y. Fang, Y. Li, M. Zhang, et al., Analyst 144(2019) 2186-2194. doi: 10.1039/C8AN02230E
Y. Liu, Z. Zhu, C. Wang, et al., Analyst 144(2019) 2130-2137. doi: 10.1039/C8AN02313A
Z. Ye, Q. Wang, J. Qiao, Y. Xu, G. Li, Analyst 144(2019) 2120-2129. doi: 10.1039/C8AN02307G
L. Hu, S. Hu, L. Guo, et al., Anal. Chem. 89(2017) 2547-2552. doi: 10.1021/acs.analchem.6b04756
G. Wang, H. Wang, S. Cao, et al., Microchim. Acta 186(2019) 96. doi: 10.1007/s00604-018-3223-6
S. Liu, X. Jiang, M. Yang, Microchim. Acta 186(2019) 445. doi: 10.1007/s00604-019-3562-y
Y. Chai, X. Li, M. Yang, Microchim. Acta 186(2019) 316. doi: 10.1007/s00604-019-3412-y
S. Cao, Q. Wang, X. Xiao, T. Li, M. Yang, Microchim. Acta 186(2019) 352. doi: 10.1007/s00604-019-3455-0
L. Wang, X. Li, Z. Yang, M. Zhu, J. Xie, Ecotoxicol. Environ. Saf. 167(2019) 169-177. doi: 10.1016/j.ecoenv.2018.10.008
G.J. Du, H.H. Lin, Q.T. Xu, M.W. Wang, Cancer Lett. 232(2006) 179-188. doi: 10.1016/j.canlet.2005.02.012
L. Ouyang, Z. Shi, S. Zhao, et al., Cell Prolif. 45(2012) 487-498. doi: 10.1111/j.1365-2184.2012.00845.x
C.S. Backes, K.S. Friedmann, S. Mang, et al., J. Biol. Chem. 293(2018) 16348-16363. doi: 10.1074/jbc.RA118.004549
P. Fan, D. Yang, J. Wu, et al., Ultrason. Sonochem. 53(2019) 178-186. doi: 10.1016/j.ultsonch.2019.01.005
R.A.J. Tucker, I.K. Cheah, B. Halliwell, Biochem. Biophys. Res. Commun. 513(2019) 22-27. doi: 10.1016/j.bbrc.2019.02.122
N. Nagaraj, J.R. Wisniewski, T. Geiger, et al., Mol. Syst. Biol. 7(2011) 548. doi: 10.1038/msb.2011.81
Y. Hu, X. Sun, C. Mao, et al., Cancer Med. 6(2017) 471-482. doi: 10.1002/cam4.994
Q. Zhang, F. Zhang, K. Thakur, et al., Food Chem. Toxicol. 112(2018) 466-475. doi: 10.1016/j.fct.2017.07.002
M. Zareie, P.B. Lukins, Biochem. Biophys. Res. Commun. 303(2003) 153-159. doi: 10.1016/S0006-291X(03)00298-5
E. Pfitzner, C. Wachauf, F. Kilchherr, et al., Angew. Chem. Int. Ed. 52(2013) 7766-7771. doi: 10.1002/anie.201302727
T. Sabir, G.F. Schroder, A. Toulmin, P. McGlynn, S.W. Magennis, J. Am. Chem. Soc. 133(2011) 1188-1191. doi: 10.1021/ja108626w

Figure 1 Fluorescence inverse microscope images of hela cells: (a) Living cells under bright light; (b) Fluorescence from SYTO-9 in living cells; (c) Fluorescence from PI in living cells; (d) Dead cells under bright light; (e) Fluorescence from SYTO-9 in dead cells; (f) Fluorescence from PI in dead cells.

Figure 2 UV-vis spectrum of suspension of different concentrations of Hela cell. The inset is the relationship between adsorption intensity at 260 nm and concentration of cells. The concentration of cells from a to f: 0×105, 2×10⁵, 4×10⁵, 6×10⁵, 8×10⁵, 10×105 cells/mL respectively.

Figure 3 Cyclic voltammetry curves: (A) reaction of 0.9% NaCl solution with molybdate (curve a), reaction of dead cell supernatant with molybdate (curve b); (B) reaction of living cell supernatant with molybdate (curve a) and reaction of dead cell supernatant with molybdate (curve b).

Figure 4 Square wave voltammetry curves: (A) reaction of 0.9% NaCl solution with molybdate (curve a), reaction of dead cell supernatant with molybdate (curve b); (B) reaction of living cell supernatant with molybdate (curve a) and reaction of dead cell supernatant with molybdate (curve b).

Figure 5 Square wave voltammetry curves for detection of different concentrations of cells. The inset is the calibration plot. The concentration of cells from a to e: 101, 102, 103, 104, 105 cells/mL.

Figure 6 Compare current intensities of cells measured in the 0.9% NaCl solution with those measured in serum. For the current intensities of cells measured in serum, the current value of the blank serum was subtracted.

 扫一扫看文章

扫一扫关注我们
 DownLoad:


 下载:
下载: