Citation:
Liu Shaochuang, Ying Yilun, Long Yitao. Rapid ultrasensitive monitoring the single-particle surface-enhanced Raman scattering (SERS) using a dark-field microspectroscopy assisted system[J]. Chinese Chemical Letters,
2020, 31(2): 473-475.
doi:
10.1016/j.cclet.2019.07.057
Rapid ultrasensitive monitoring the single-particle surface-enhanced Raman scattering (SERS) using a dark-field microspectroscopy assisted system
English
Rapid ultrasensitive monitoring the single-particle surface-enhanced Raman scattering (SERS) using a dark-field microspectroscopy assisted system
Received Date:
12 June 2019 Accepted Date:
27 July 2019 Revised Date:
25 July 2019 Available Online:
22 February 2020
Abstract:
The observation of single-particle surface-enhanced Raman scattering (SERS) has generated considerable interest both in the nanomaterials filed and in the single-particle spectroscopy community. It is a challenge to realize rapid, facile, and high throughput SERS at single nanoparticle level. Here, without the complex experimental device and difficult experimental operations, a general single-particle SERS technique has been achieved by using dark-field-assisted surface-enhanced Raman spectroscopy (DFSERS). This advanced method provides in-situ characterization of the chemical reaction performance at single gold nanorod.
Surface-enhanced Raman scattering (SERS) is an ultrasensitive vibrational spectroscopic technique, which has been proven to be an ultra-sensitive and powerful technique for providing detailed structural information of the molecule [1-7]. It has been insensitively applied in various fields including surface and interface analysis, food safety inspection, environmental monitor-ing, and biomolecular sensing [8-13]. Especially, the single-particle SERS regards as a promising approach to SERS-based sensing and imaging since the individual plasmonic nanoparticles can act as the SERS active site [14-18]. Recent studies show the capabilities of single-particle SERS in bioimaging [16, 19, 20] as well as monitoring the chemical reactions on metallic catalysts [21]. However, techniques for single-particle SERS need a complex experimental device and require difficult experimental operations. Moreover, the dynamic monitoring of the surface reaction on each single-particle desires the rapid acquiring of the SERS spectra. Besides, the high-throughput SERS sensing techniques become increasingly important with the growing demands such as molecular biology analysis [22, 23], disease diagnosis [19], and characterization of catalysts [24]. Therefore, the key issue is to develop generalized high-throughput techniques to achieve the rapid and facile single-particle SERS in real time.
Recent work from our group utilized the dark-field-assisted surface-enhanced Raman spectroscopy (DFSERS) to character the kinetics of a catalytic process on multiple sites of a single nanowire [25]. To address the above challenges for single-particle SERS, herein, we report a novel DFSERS method to simultaneously monitor both the nanoparticle catalyzed process and plasmon-driven reaction on a single gold nanorod (AuNR). This method can search and locate the single nanoparticle with SERS active rapidly in numerous of particles on the surface. The single AuNR was chosen as the substrate which integrates the SERS activity with catalytic activity. The reduction of typical aromatic compound p-nitrothiophenol (PNTP) to p-aminothiophenol (PATP) with sodium borohydride (NaBH4) was selected as a model reaction. We have achieved to in-site and real-time analysis the plasmon-driven reaction of PNTP dimerizing into 4, 4' -dimercaptoazobenzene (DMAB) as well as the Au-catalyzed chemical reduction reaction of PNTP to PATP at single-particle level (Fig. 1). In contrast to conventional Raman techniques, this method based on a general lab-build Raman spectroscopy system which has its advantages of low complexity, facile realization, simplicity of operation, and easy to popularize.
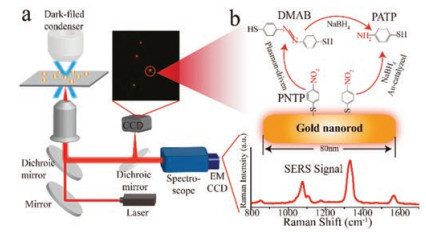
Figure 1
Figure 1.
Schematic overview of the DFSERS. (a) Experimental set-up used to obtain Raman spectra and located a single AuNR. (b) Schematic of monitoring catalytic reaction of the PNTP dimerizing into DMAB and reduced to PATP on a single AuNR by SERS.
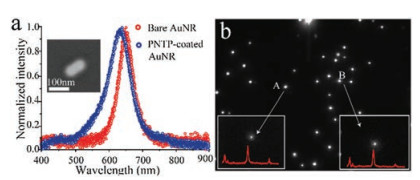
First, the AuNRs were characterized by dark-field scattering and scanning electron microscope (SEM), as shown in Fig. 2a, the AuNR has a scattering peak centered at 650 nm and blue-shifted to 630 nm after functionalized with PNTP. The SEM result indicates that the AuNR immobilizing on the quartz glass is monodisperse to ensure the nanorod we monitored is a single-particle (Fig. 2a inset and Fig. S1 in Supporting information). The UV-vis spectra of AuNRs show one transversal surface plasma peak at 520 nm and longitudinal ones at 654 nm (Fig. S1).
Figure 2
Figure 2.
(a) Dark-field scattering spectra of a single AuNR before and after functioned with PNTP, the inset is the scanning electron microscope image of a single AuNR. (b) The grayscale of the single gold AuNR acquired using the EMCCD. The symbol A and B are the represent of the AuNR with the SERS active and the insets are the corresponding SERS spot stimulated by the laser and the corresponding SERS spectra under 785 nm laser.
Our experimental set-up is based on the platform of dark-field microscopy which can help the study of the size, shape, composition and the local environment of single nanoparticles [26-28]. In our approach, dark-field microscopy is used for rapid localization and adjustment the position of a single AuNR, and make it fit in the entrance slit of the spectrometer. By adjusting the position of the single AuNR to get into the laser spot, a single AuNR with SERS active can be spotted precisely (Fig. 1a). As a consequence, the SERS signals on the reaction process of the single AuNR can be acquired without influence from the background and other AuNRs (Fig. 1b).
In our method, to acquire the SERS spectra of a single AuNR, the AuNRs were immobilizing on the quartz glass by dropping the diluting AuNR aqueous solution on the surface of the quartz glass. Then, the surface of the nanorod is functionalized with PNTP by immersing the quartz glass into PNTP ethanol solution for 20 min. After cleaning the residual PNTP with ethanol and DI water, the quartz glass was placed on the lab-built DFSERS (Fig. 1a). For the single nanoparticle SERS, the key question is the structure and properties of active sites on the particle surface. Previous studies suggest that these sites are likely adatoms, atomic clusters, sharp steps, or edges [29, 30]. Therefore, each single AuNRs exhibits variations for their SERS activities. To acquire real-time SERS spectra on an individual AuNRs, it is important to locate a single AuNR with SERS active in numerous of particles on the quartz glass surface. Here, we use the electric platform combined with the EMCCD of the spectrograph to search the entire surface of the quartz glass automatically. Fig. 2b is the grayscale images of the dark-field light scattering on single gold AuNR under white light condition. When turned the light to 785 nm laser, the entire view of the EMCCD is dark and only the AuNR with SERS active can be spotted by the laser. As the electric platform scanning, the AuNRs with SERS active show as a light spot at the position of laser-focused. And we can acquire the SERS spectra of the positioned single AuNR (Fig. 2b inset). By using this method, we can locate the AuNRs with SERS actives and the SERS spectra of each single AuNRs can be acquired rapidly.
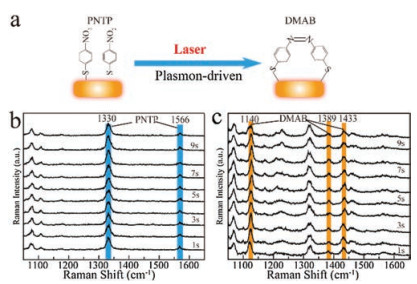
Recently, plasmon-driven reactions provide possibilities for SERS and TERS studies to monitor the catalysis reactions on metal catalysts [31-33]. Therefore, the structural information from each chemical on a single nanoparticle could be acquired with high sensitivity. Here, the surface plasmon on a single AuNR is desirable for monitoring plasmon-driven catalysis reaction with DFSERS. To stimulate the plasmon-driven reaction, a laser spot with 785 nm wavelength was adjusted to ensure its focus on the single nanorod using the above method. The SERS spectra of plasmon-driven reaction of PNTP dimerizing into DMAB on the single AuNR can be acquired under continuous laser excitation (Fig. 3a). As displayed in Fig. S1, each SERS spectrum we acquired originates from a single AuNR. Fig. 3b shows the time-dependent study of SERS spectra of a single PNTP coated AuNR under the laser power of 20 mW. The SERS spectra of the PNTP exhibited characteristic bands at 1076 cm-1 corresponding to C-S stretching, at 1330 cm-1 attributing to O-N-O stretching, and two bands at 1109 and 1566 cm-1 that could be assigned to the phenyl-ring mode [34], respectively. No characteristic bands appointed to DMAB is occurred, which indicates no dimerization reaction happens (Fig. S2 in Supporting information). As the intensity of laser power increasing to 40 mW, it induces the plasmon-driven dimerization reaction of PNTP to DMAB. The time-dependent SERS spectra indicate that the dimerization reaction of PNTP to DMAB has been reached to the equilibrium in one second with the occurrence of the characteristic bands at 1140, 1389 and 1433 cm-1 which are related to the -N = N-unit of DMAB (Fig. 3c) [35, 36]. Furthermore, only a part of the PNTP molecules were transformed into DMAB since the intensity of the SERS peak at 1330 cm-1 corresponding to O-N-O stretching and the peaks of DMAB are present simultaneously. These results indicate that the dimerizing reaction of PNTP is related to the power of exciting light.
Figure 3
Figure 3.
(a) Schematic illustration of the coupled plasmon-driven reaction of PNTP dimerizing into DMAB on a single AuNR. (b and c) The SERS spectra under continuous 785 nm laser excitation with the laser power of (b) 20 mW and (c) 40 mW.
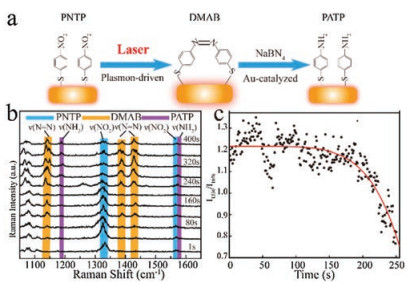
The hydride reaction of PNTP catalyzed by metal nanoparticle has become one of the most used model reactions for SERS and TERS studies [37]. In this work, to investigate the catalytic reaction process on a single AuNR, NaBH4 was added to this system to reduce PNTP to PATP. The characteristic SERS bands of PNTP and PATP were used for tracking the reaction process under the laser power of 40 mW (Fig. 4a). A series of in-situ Raman spectra of the single AuNR was obtained during the whole reaction process at different reaction times with 700 ms exposure and 300 ms readout time (Fig. S4 in Supporting information). Fig. 4b shows the time-dependent SERS spectra which were taken every 40 s. During the initial stage of the reaction progress, the intensity of PNTP associated characteristic bands at 1330 cm-1 decreased gradually to a quite low intensity. At 80 s, the characteristic bands of DMAB at 1138, 1384, 1424 cm-1 was observed and then disappeared after 160 s because of the reduction of the NaBH4 [38]. Simultaneously, the characteristic bands of PATP at 1189 cm-1 emerged. After 240 s, the intensity of the PNTP bands decreased significantly while the bands of PATP become stronger and reach to the constant intensity. Nevertheless, bands of DMAB still maintain a strong condition. These results are attributed to the dimerization reaction of PATP converted to DMAB under the same laser condition [35, 36]. This result confirms that the Au-catalyzed chemical reaction of PNTP to PATP involved the dimers of DMAB as the reaction intermediate and the PATP can also convert to DMAB. Since the C-S bond of the chemicals is unchanged during the whole reaction, the ratio of characteristic band intensities of PNTP at 1330 cm-1 and 1076 cm-1 (I1330/I1076) were used to demonstrate the intensity evolution of the SERS bands [39]. As illustrated in Fig. 4c, the plot of the ratio of I1330/I1076versus time exhibits the process of the reaction evolution clearly.
Figure 4
Figure 4.
(a) Schematic illustration of the AuNR-catalyzed reaction of PNTP to PATP on a single AuNR. (b) The time-dependent SERS spectra of PNTP to PATP with 40 s intervals after the addition of NaBH4. (c) Plot of intensity ratio of the band at 1330 cm-1 and 1076 cm-1versus time for the characterization of reaction evolution.
In summary, a novel method of DFSERS is developed to achieve rapid and facile single-particle SERS in real time. With the assistance of the dark-field microscopy, a single AuNR with SERS active can be positioned precisely to ensure acquiring the SERS signals from the single AuNR without influence from the background and other AuNRs. The plasmon-driven dimerization reaction of PNTP to DMAB and the Au-catalytic reaction of PNTP reduced to PATP with NaBH4 on a single nanorod were monitored using DFSERS technique. Our method has technical advantages in single nanoparticle searching, precise location, and high-through-put particles monitoring. This method enables us to real-time monitor the complex reaction process and in-situ characterization of catalyst performance for a single nanoparticle. It would be a benefit to the understanding of the mechanism for the catalytic reaction at single-nanoparticle level. The DFSERS enables the potential popularization of the single-particle SERS to be a routinely available technique for characterization of catalysts, cellular imaging, biomarker analysis and etc.
Acknowledgments
This research was supported by the National Natural Science Foundation of China (Nos. 21421004, 21834001). Yilun Ying is sponsored by National Ten Thousand Talent Program for young top-notch talent.
B. Xiong, R. Zhou, J. Hao, et al., Nat. Commun. 4(2013) 1708-1709. doi: 10.1038/ncomms2722
[27]
D. Xu, Y. He, E.S. Yeung, Anal. Chem. 86(2014) 3397-3404. doi: 10.1021/ac403700u
[28]
M. Hu, C. Novo, A. Funston, et al., J. Mater. Chem. 18(2008) 1949-1960. doi: 10.1039/b714759g
[29]
J.R. Lombardi, R.L. Birke, T. Lu, J. Xu, J. Chem. Phys. 84(1986) 4174-4180. doi: 10.1063/1.450037
[30]
P. Kambhampati, C.M. Child, A. Campion, J. Chem. Soc. Faraday Trans. 92(1996) 4775-4780. doi: 10.1039/ft9969204775
[31]
E.M. van Schrojenstein Lantman, T. Deckert-Gaudig, A.J.G. Mank, V. Deckert, B. M. Weckhuysen, Nat. Nanotechnol. 7(2012) 583-586. doi: 10.1038/nnano.2012.131
[32]
Y.F. Huang, M. Zhang, L.B. Zhao, et al., Angew. Chem. Int. Ed. 53(2014) 2353-2357. doi: 10.1002/anie.201310097
[33]
X. Tang, W. Cai, L. Yang, J. Liu, Nanoscale 6(2014) 8612-8616. doi: 10.1039/C4NR01939C
[34]
X. Ren, E. Tan, X. Lang, et al., Phys. Chem. Chem. Phys. 15(2013) 14196-14201. doi: 10.1039/c3cp51385h
[35]
Y.F. Huang, H.P. Zhu, G.K. Liu, et al., J. Am. Chem. Soc. 132(2010) 9244-9246. doi: 10.1021/ja101107z
S. Wunder, F. Polzer, Y. Lu, Y. Mei, M. Ballauff, J. Phys. Chem. C 114(2010) 8814-8820. doi: 10.1021/jp101125j
[38]
X. Liang, T. You, D. Liu, et al., Phys. Chem. Chem. Phys. 17(2015) 10176-10181. doi: 10.1039/C5CP00908A
[39]
V. Joseph, C. Engelbrekt, J. Zhang, et al., Angew. Chem. Int. Ed. 51(2012) 7592-7596. doi: 10.1002/anie.201203526
Figure 1
Schematic overview of the DFSERS. (a) Experimental set-up used to obtain Raman spectra and located a single AuNR. (b) Schematic of monitoring catalytic reaction of the PNTP dimerizing into DMAB and reduced to PATP on a single AuNR by SERS.
Figure 2
(a) Dark-field scattering spectra of a single AuNR before and after functioned with PNTP, the inset is the scanning electron microscope image of a single AuNR. (b) The grayscale of the single gold AuNR acquired using the EMCCD. The symbol A and B are the represent of the AuNR with the SERS active and the insets are the corresponding SERS spot stimulated by the laser and the corresponding SERS spectra under 785 nm laser.
Figure 3
(a) Schematic illustration of the coupled plasmon-driven reaction of PNTP dimerizing into DMAB on a single AuNR. (b and c) The SERS spectra under continuous 785 nm laser excitation with the laser power of (b) 20 mW and (c) 40 mW.
Figure 4
(a) Schematic illustration of the AuNR-catalyzed reaction of PNTP to PATP on a single AuNR. (b) The time-dependent SERS spectra of PNTP to PATP with 40 s intervals after the addition of NaBH4. (c) Plot of intensity ratio of the band at 1330 cm-1 and 1076 cm-1versus time for the characterization of reaction evolution.

 DownLoad:

 下载:
下载:


