Citation:
Guo Chune, Guo Xiaomi, Chu Wubo, Jiang Nan, Li He. FTIR-ATR study for adsorption of trypsin in aqueous environment on bare and TiO2 coated ZnSe surfaces[J]. Chinese Chemical Letters,
2020, 31(1): 150-154.
doi:
10.1016/j.cclet.2019.04.067
FTIR-ATR study for adsorption of trypsin in aqueous environment on bare and TiO2 coated ZnSe surfaces
English
FTIR-ATR study for adsorption of trypsin in aqueous environment on bare and TiO2 coated ZnSe surfaces
Key Laboratory of Marine Materials and Related Technologies, CAS, Zhejiang Key Laboratory of Marine Materials and Protective Technologies, Ningbo Institute of Materials Technology and Engineering, Chinese Academy of Sciences, Ningbo 315201, China
b.
College of Materials Science and Optoelectronic Technology, University of Chinese Academy of Sciences, Beijing 100049, China
* Corresponding author at: Key Laboratory of Marine Materials and Related Technologies
CAS
Zhejiang Key Laboratory of Marine Materials and Protective Technologies
Ningbo Institute of Materials Technology and Engineering
Received Date:
27 March 2019 Accepted Date:
28 April 2019 Revised Date:
26 April 2019 Available Online:
22 January 2020
Abstract:
Undesired adsorption of proteins brings big troubles to marine structures. The settled proteins change the physical and chemical properties of the surfaces, which allow marine fouling organisms to settle down on the structures. Therefore, to understand the adsorption mechanism of proteins is very helpful to find an environment-friendly solution against biofouling. Many approaches have been developed to study protein adsorption, but most of them are insufficient to give the chemical interaction information between proteins and surfaces. Fourier transform infrared spectroscopy with attenuated total reflection (FTIR-ATR) is an efficient, fast and non-destructive method for in situ surface measurement, which greatly minimizes the interference of water to infrared spectra, because of the very small depth of penetration of the evanescent wave. In this paper, an in situ FTIR-ATR technology was used to investigate the adsorption process of trypsin on a bare ZnSe surface and on a TiO2 coated ZnSe surface, and the effect of calcium cation strength and ultraviolet light irradiation on the secondary structure of trypsin were also evaluated. FTIR spectra of trypsin showed that Amide Ⅰ band red shift and Amide Ⅱ band blue shift in aqueous environment on both surfaces compared with the dry trypsin powder, and the addition of calcium cations further changed the Amide bands position, which indicated that the change of the secondary structure could be interfered by the environment. The hydrogen bond formation between water and trypsin, the interaction between surface and trypsin, the interaction between hydrated calcium cations and trypsin, are major factors to change the secondary structure of trypsin, and UV light irradiation also showed its influence for the secondary structure.
Marine biofouling is a major challenge for the marine industry. The process of the formation of biofouling typically goes through conditioning layer, biofilm to large fouling biofilm, in which biofilm provides attachment points and nutrients for later macrofouling [1-3]. Biofilm was formed by extracellular polymeric substances (EPS) secreted by microorganisms, EPS mainly contain proteins and polysaccharides. Waite [4, 5] found that there was a kind of viscous protein rich in dopa amino residues on the foot silk disc during the adhesion process of mussels, and the metal ion could improve the adhesion between the foot proteins. In order to restrain the formation of biofouling, the mechanism of protein adsorptionprogress needs to be figured out.
At present, there are many approaches developed to study protein structure and morphology, such as atomic force microscopy (AFM) [6], Cryo-SEM [7]. These microscopic imaging-based approaches give the direct information of the surface morphology after the protein settles down and the crystal structure of the protein, however, we barely get information on the chemical interactions between the surface and the protein during the adsorption process, and even encounter some difficulties in situ measurement in aqueous solution. Fourier transform infrared spectroscopy (FTIR) is an efficient and rapid detection method that can easily reflect the chemical composition and structure information of molecules without damage to the tested samples. Since the 1950s, FTIR has been used in studies of microorganisms [8]. However, there is much water in the protein working environment, and water can strongly absorb infrared radiation and highly interfere the collected IR spectra. In order to study the adsorption behavior and structural changes of the trypsin in aqueous environment, attenuated total reflectance (ATR) accessory were introduced into this study [9]. ATR is widely used to obtain the spectra of solids, liquids, semisolids and thin film, and it is particularly good for in situ sample measurements in the aqueous environment, because the small (1–10 microns) penetration depth of the evanescent wave reduces absorption of infrared radiation by water [10]. Therefore, researchers developed many approaches based on FTIR to study the proteins, microorganisms [11-13], and developed mathematical methods to distinguish the secondary structure of proteins [14-18] and different species of microorganisms [19].
Trypsin is a serine proteolytic enzyme widely found in insects, crustaceans (shrimp [20]), fish and higher vertebrates (bovine, sheep, pig [21]). The structure of trypsin secreted by different organisms may be different. In this paper, we studied porcine trypsin, the trypsin is comprised of 245 amino acids and contains six pairs of disulfide bonds, its molecular weight is 24, 000. In this paper, the secondary structure changes of adsorbed trypsin on the surfaces have been investigated by FTIR-ATR technology. The proteins repeating units have nine characteristic bands in the FTIR spectra, in which Amide Ⅰ and Amide Ⅱ bands are the main vibrational bands of the protein secondary structure [15, 16]. The protein secondary structure elements consisted α-helix, β-sheet, β-turn and random coil, the percentage of α-helix were calculated by the relative area of 1663–1650 cm-1 region, the percentage of β-sheet were calculated by adding all the β-sheet bands between 1698–1690 cm-1and 1642–1623 cm-1 regions, the band area at 1687–1666 cm-1 regions were assigned to β-turn, and 1650–1643 cm-1 were assigned to random coil element [15].
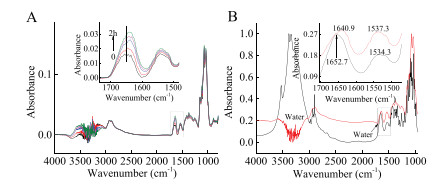
The in situ FTIR-ATR test method could continuously reflect various changes of the material on the surface. It can be found from Fig. 1A that the position of Amide Ⅰ band gradually move to lower wavenumber, and the change mainly occurred within 2 h, so the following spectra were obtained at the point of 2 h. In Fig. 1B, the spectrum of trypsin dry powder showed strong bands in 3600–3000 cm-1 which indicated N-H and O-H functional groups on the side chain, and the Amide Ⅰ and Amide Ⅱ bands appeared at 1652.7 cm-1 and 1534.3 cm-1, respectively. The ATR spectrum of trypsin in aqueous solution showed that the broad negative bands at 3600–3000 cm-1 and Amide Ⅰ and Amide Ⅱ bands appeared at 1640.9 cm-1 and 1537.3 cm-1, respectively. The broad negative band indicated that the water molecules on the ZnSe IRE (internal reflection element) surface were replaced by the adsorbed trypsin [22], and the Amide bands shift indicated the backbone structural change of the trypsin. There were 20 different amino acids in the trypsin peptide chain, and the side chain structure was relatively complex. For quantitative analysis of the secondary structural components of the trypsin, it was critical that the absorption by water must be accurately compensated [23, 24], and guaranteed a straight baseline in 2000–1750 cm-1 (Fig. 1A).
Figure 1
Figure 1.
FTIR spectra of trypsin. (A) In situ ATR mode for trypsin aqueous solution in 0–2 h, the spectra were collected with 30-min interval, the insert diagram was the enlarge region of 1700-1500 cm-1. (B) The spectrum in black was collected in transmittance mode for dry trypsin powder, the spectrum in red was collected in ATR mode for trypsin in deionized water, and two spectra in the 4000-900 cm-1 region were normalized to the same intensity for ease of comparison, the insert diagram was the enlarge region of 1700-1500 cm-1.
In the region of 1800–1500 cm-1, the Amide Ⅰ band of the trypsin aqueous solution red shifted 11.8 cm-1 to lower wavenumber, and the Amide Ⅱ band blue shifted 3 cm-1 to higher wavenumber when compared with the spectrum of dry trypsin powder. When trypsin dissolved into water, new hydrogen bonds might form between -CONH- in the backbone and water molecular. The hydrogen bonds led to the decrease of electron cloud density of the C=O, and the increase of electron cloud density of C-N. Therefore, the Amide Ⅰ band red shifted. Because the Amide Ⅱ band was a combination of C-N stretching vibration (16%-40%) and NH in-plane bending vibration (40%-60%), the Amide Ⅱ band blue shifted, but the shift strength was much lower than the Amide Ⅰ band. The shift of Amide Ⅰ and Amide Ⅱ bands coincided with the change of Fig. 1A which indicated the secondary structure of trypsin might be changed, and the calculated results were presented in Table S1 (Supporting information).
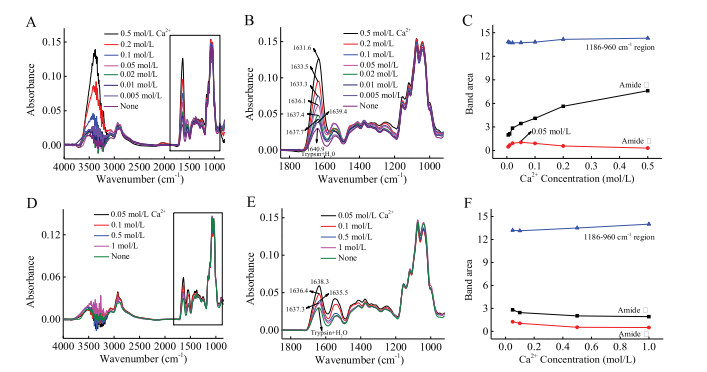
The adsorption of trypsin on the bare ZnSe IRE surface was investigated in solutions with seven different calcium cations concentrations and the spectra were shown in Fig. 2. Spectra in Fig. 2A were collected with the same volume of water as references. When calcium cations were added, the band strength was greatly increased at 3600–3000 cm-1 and 1700–1500 cm-1. It could be contributed by the water along with hydrated calcium cations. Fig. 2B demonstrated the details of Fig. 2A at 1800–900 cm-1. Amide Ⅰ bands were gradually red shifted from 1640.9 cm-1 to 1631.6 cm-1 with the increase of the concentration of calcium cations. It indicated that more hydrated calcium cations were captured by trypsin and lead more water into the gap of the polypeptide chain, which allowed C=O to interact with more water molecules and resulted Amide Ⅰ band shift due to the rearrangement of the Amide electron cloud density [25]. Fig. 2C showed that the concentration of calcium cations increased from 0.005 mol/L to 0.05 mol/L, the Amide Ⅰ and Amide Ⅱ bands area gradually increase, but when the concentration of calcium cations increased from 0.1 mol/L to 0.5 mol/L, the Amide Ⅰ band area increased significantly, and the Amide Ⅱ band gradually decreased. Though Amide Ⅱ was used to evaluate the amount of proteins in IR analysis [26, 27], the bands of the side chain stretches at 1186–960 cm-1 were not affected by water and calcium cations, so they could be used to monitor the quantity change of the trypsin on the surface. Fig. 2C indicated that the calcium cations slightly promoted the adsorption of trypsin on ZnSe IRE surface.
Figure 2
Figure 2.
The FTIR spectra of trypsin with different concentration of calcium cations solution at 2 h after the samples were added into the ATR trough: (A) water as references, (B) 1800–900 cm-1of A, (D) calcium cations solution as references (i.e., "0.5 mol/L Ca2+" means 0.5 mol/L Ca2+solution as reference), (E) 1800–900 cm-1 of D, (C and F) indicated the bands area of Amide Ⅰ, Amide Ⅱ and 1186–960 cm-1 region with the calcium cations concentration.
Because there was huge influence of water in hydrated calcium cations at 3600–3000 cm-1 and 1700–1500 cm-1, spectra in Fig. 2D were collected with the same concentration calcium cations as references to minimize the interference of the hydrated calcium cations. In Fig. 2E, the Amide Ⅰ bands also showed a tendency to shift lower wavenumber from 1640.9 cm-1 to 1635.5 cm-1 with the increase of concentration of calcium cations, however, when the concentration of calcium cations increased from 0.5 mol/L to 1.0 mol/L, the Amide Ⅰ band blue shifted 1.8 cm-1. In Fig. 2F, when the calcium cations concentration was greater than 0.05 mol/L, the bands area of Amide Ⅰ and Amide Ⅱ slightly decreased, but the bands at 1186–960 cm-1 slightly increased, which coincide with the result in Fig. 2C.
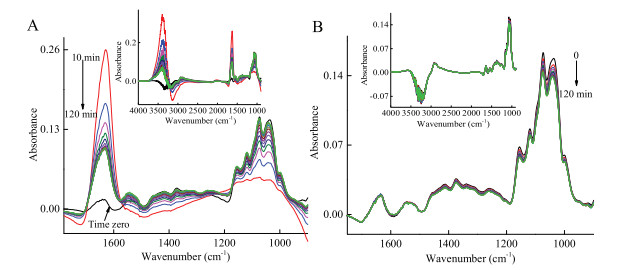
Extra calcium cations or water was introduced to the system respectively after trypsin settled down on the ZnSe IRE surface to further figure out the effect of calcium cations and water in trypsin adsorption progress (Fig. 3). Calcium cations solution was slowly added into the IRE trough and the final calcium cations concentration was 0.5 mol/L. Fig. 3A demonstrated that the intensity of Amide Ⅰ band suddenly increased and gradually dropped down, and the intensity of 1086–960 cm-1 region suddenly dropped down and slowly increased back with time. It indicated that the hydrated calcium cations took place of trypsin on the surface rapidly and interacted the proteins to release water molecules gradually. Trypsin returned to the surface after chelating with calcium cations, because some calcium cations were still hydrated, the intensity of Amide Ⅰ band was higher than the original status. The same process was operated using water, and the results were shown in Fig. 3B. The Amide Ⅰ and Amide Ⅱ band basically unchanged after adding water, but the intensity of 1186–960 cm-1 region slightly decreased due to trypsin was slightly diluted after the addition of water. Because in trypsin aqueous solution the trypsin fully interacted with water, the addition of water did not interfere the adsorption of trypsin.
Figure 3
Figure 3.In situ FTIR spectra of trypsin solution of adding 0.4 mL calcium cations solution (A) and deionized water (B). The insert diagrams represent the changes of 4000-900 cm-1. All spectra were collected with 10-min interval using water as references. 0 indicates stable state before the addition of calcium cations solution and 10–120 min indicate the changes of the spectra after the calcium cations solution addition, water was not subtracted from those spectra.
The Amide bands shift indicated that the backbone of trypsin had been changed and led to the change of secondary structure of trypsin. The second derivative of IR spectra of trypsin could give more detail information of backbone mathematically. Curve fitting function had been used to distinguish the peaks of the secondly derived spectra. Both mathematical processes were fulfilled by Horizon MB software. Fig S1 (Supporting information) showed the example of mathematical analysis of trypsin differential spectra in 1710–1600 cm-1, and the components of secondary structure had been demonstrated. Calcium cations in the trypsin solution would affect the skeletal chain of trypsin and made the rearrangement of chains more orderly by hydrogen bond and electrostatic force, induced the percentage of random coil element decreased. With the increased of concentration of calcium cations, the percentage of α-helix and β-sheet element increased, β-turn and random coil gradually decreased (Table 1, Table 2). The results provided a convenient method for calculating the change trend of the secondary structure of protein in aqueous solution using FTIR, whether or not consideration of water, the calculation gave the same trend of the secondary structure changes of trypsin.
Table 1
Table 1.
Calculated secondary structure of trypsin, spectra used in Fig. 2B.
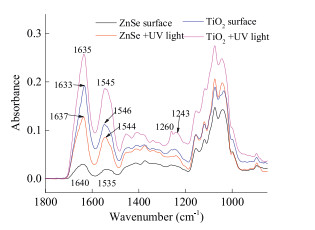
The formation of hydrogen bonds was an important factor to lead the change of secondary structure of trypsin, nevertheless, the interaction between trypsin and surface and other stimulation could be other factors for the changes. Anatasetitanium dioxide (TiO2) was selected not only because it could provide rich hydroxyl groups on the surface, but also it was a good reagent for photocatalysisunder ultraviolet light irradiation. In Fig. 4 the Amide Ⅰ band of trypsin red shifted from 1640 cm-1 to 1633 cm-1 and the Amide Ⅱ band blue shifted from 1535 cm-1 to 1546 cm-1 when trypsin solution settled down on TiO2 coated ZnSe surface, and the amount of settled trypsin was about 20% more than on bare ZnSe surface. There were rich hydroxyl groups on the TiO2 surface, hence, the bands shift could be contributed by the interaction of trypsin with the hydroxyl groups on TiO2 and hydrogen bond formed by trypsin with water, the scheme was demonstrated in Fig. S2 (Supporting information). The zeta potential of the TiO2 suspension and the trypsin solution at different pH conditions showed in Fig. S3 (Supporting information). The isoelectric point (IEP) of TiO2 was about pH 2.6, and the IEP of the trypsin aqueous solution was about pH 6.3. When trypsin was dispersed into deionized water, the pH value of solution was about 4.5. Therefore, trypsin carried opposite charges with the TiO2 surface. The static electric interaction allowed more trypsin to settle down on TiO2 surface than on bare ZnSe IRE surface.
Figure 4
Figure 4.
Spectra of trypsin on different surfaces, with/without UV light exposure, used water as references.
Ultraviolet (UV) light irradiation was one of the most frequent approaches for photocatalytic activity, and UV light could interfere protein's activity and properties [28, 29]. On bare ZnSe IRE surface, Amide Ⅰ band red shifted from 1640 cm-1 to 1637 cm-1, and Amide Ⅱ blue shifted from 1535 cm-1 to 1544 cm-1 after UV irradiation, and the amount of settled trypsin was about 37% more than without UV irradiation. It indicated that the UV light led the change of secondary structure of trypsin and concentrated the protein on the surface, because UV light changed the hydrophilicity [30] of the ZnSe IRE surface. On TiO2 coated ZnSe IRE surface, Amide Ⅰ band and Amide Ⅱ bands also shifted after UV irradiation, and the amount of settled trypsin was about 35% more than without UV irradiation. 1243 cm-1 and 1260 cm-1 were assigned to C-N stretching vibration of Amide Ⅲ band, those bands intensity enhanced in different surfaces and after UV light effect, which indicated that UV light gave a photocatalytic condition to reduce steric hindranceeffects and the existence of TiO2 consolidated static electric interaction and the photocatalytic effect [28, 31].
Fig. S4 (Supporting information) showed very similar second derivative spectra before and after UV light irradiation, and the percentage of secondary conformation was listed in Table 3. It could be explained by the transformation of α-helix and β-sheet structure to β-turn during the photodegradation of trypsin on two surfaces.
Table 3
Table 3.
Calculated secondary structure of trypsin on different surfaces and UV irradiation.
In conclusion, FTIR-ATR was an effective technology for studying the adsorption behavior and secondary structure of trypsin under different conditions. Compared with dry trypsin power, both Amide Ⅰ and Amide Ⅱ bands shifted in aqueous environment due to the formation of hydrogen bonds with water. The Amide bands shift could be attributed to the secondary structure change of trypsin. Hydrogen bonds, surfaces, calcium cations, and UV light were the factors for the secondary structure change of the trypsin. The interaction between surfaces and trypsin was dependent on the physical and chemical properties of the surface. UV light irradiation on TiO2 surface further affected the secondary structure element of trypsin, due to photocatalytic effect.
Acknowledgment
This research was supported by the National Natural Science Foundation of China (No. 21675165).
I. Dolamic, T. Bürgi, J. Phys. Chem. C 115(2011) 2228-2234. doi: 10.1021/jp1102753
Figure 1
FTIR spectra of trypsin. (A) In situ ATR mode for trypsin aqueous solution in 0–2 h, the spectra were collected with 30-min interval, the insert diagram was the enlarge region of 1700-1500 cm-1. (B) The spectrum in black was collected in transmittance mode for dry trypsin powder, the spectrum in red was collected in ATR mode for trypsin in deionized water, and two spectra in the 4000-900 cm-1 region were normalized to the same intensity for ease of comparison, the insert diagram was the enlarge region of 1700-1500 cm-1.
Figure 2
The FTIR spectra of trypsin with different concentration of calcium cations solution at 2 h after the samples were added into the ATR trough: (A) water as references, (B) 1800–900 cm-1of A, (D) calcium cations solution as references (i.e., "0.5 mol/L Ca2+" means 0.5 mol/L Ca2+solution as reference), (E) 1800–900 cm-1 of D, (C and F) indicated the bands area of Amide Ⅰ, Amide Ⅱ and 1186–960 cm-1 region with the calcium cations concentration.
Figure 3In situ FTIR spectra of trypsin solution of adding 0.4 mL calcium cations solution (A) and deionized water (B). The insert diagrams represent the changes of 4000-900 cm-1. All spectra were collected with 10-min interval using water as references. 0 indicates stable state before the addition of calcium cations solution and 10–120 min indicate the changes of the spectra after the calcium cations solution addition, water was not subtracted from those spectra.

 DownLoad:


 下载:
下载:


