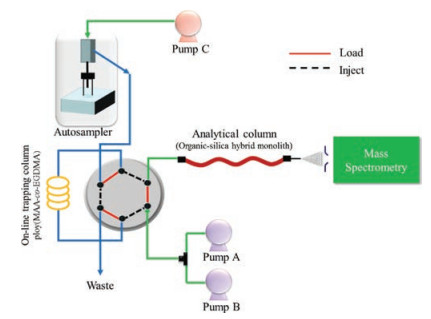
Figure 1.
Scheme of the on-line trapping/cHILIC/MS system.
On-line trapping/capillary hydrophilic-interaction liquid chromatography/mass spectrometry for sensitive determination of RNA modifications from human blood
Chubo Qi , Hanpeng Jiang , Jun Xiong , Bifeng Yuan , Yuqi Feng

RNA modification has been proposed to represent another realm for biological regulation in addition to DNA modification [1, 2]. Naturally occurring RNA molecules contain various modified nucleosides derived from four standard nucleosides. Up to date, more than 150 structurally distinct modified nucleosides have been identified in all three kingdoms of life [3, 4], among which, N6- methyladenosine (m6A) and 5-methylcytosine (5-mC) are the two important modifications on RNA molecules [5, 6].
The cell-type and cell-state-dependent m6A distribution indicates that m6A modifications are highly dynamic [7, 8]. Approximate 7000 types of mRNA were found to possess m6A modification in both human and mouse cells with potential functions in regulation of gene expression, mRNA stability, microRNA maturation and protein translation [7, 8]. These studies suggested that the dynamic regulation of m6A on RNA may play critical roles in fundamental biological processes, including spermatogenesis, carcinogenesis, circadian rhythm and stem cell renewal [9, 10]. Aside from m6A, 5-mC is another methylated ribonucleoside that is widespread in both coding and noncoding RNAs [11, 12]. However, the precise molecular functions of 5-mC in RNA are not clearly understood. Recent studies suggested that 5- mC in RNA can affect the epigenetic status of cells and influence the translation of distinct sets of mRNA, indicating that 5-mC in RNA could be critical for the regulation of gene transcription and protein translation [13, 14].
Some analytical methods have been developed to measure the contents of the m6A and 5-mC in RNA, such as thin-layer chromatography detection [15], immunohistochemistry [16], capillary electrophoresis (CE) with UV [17] and laser-induced fluorescence [18] detection, high-performance liquid chromatography (HPLC) with UV [19], fluorescence detector (FLD) [20] and mass spectrometry (MS) [21-27] detection. Thin-layer chromatography detection involves in the use of radioactive materials. Immunohistochemical staining is tedious, less selectivity and semi-quantitative. CE-based methods are suffered from reproducibility. UV and FLD-based detection makes the identification of compounds difficult due to their inherent less qualitative property.
Mass spectrometry offers good detection sensitivity and selectivity as well as provides structural information of compounds; therefore it has become one of the most prominent platforms for the determination of target compounds [28-33], such as MS-based detection of 5-mC and 5-hydroxymethylcytosine in DNA [34-36]. MS also has advanced greatly on RNA study over the past decade. Liquid chromatography-mass spectrometry (LC– MS) is one of the most widely used platform for analyzing RNA modifications [32]. RNA sample is generally digested to nucleosides and then analyzed by LC–MS. For example, Dedon's group established LC–MS method with multiple reaction monitoring (MRM) mode to quantify changes in the spectrum of tRNA modifications in yeast [37]. Wang's group utilized isotope dilution LC–MS with selected ion monitoring (SIM) mode to measure 5- hydroxymethylcytosine in RNA [38]. However, these routine LC–MS analytical methods cannot well fulfill the requirement of sensitive detection of RNA modifications with low abundance.
In the current study, we developed an on-line trapping/ capillary hydrophilic-interaction liquid chromatography/quadrupole time-of-flight mass spectrometry (on-line trapping/cHILIC/ MS) system for sensitive and simultaneous quantification of m6A and 5-mC in blood RNA. The limits of detection (LODs) were 0.06 fmol and 0.10 fmol for m6A and 5-mC, respectively, which were better than the LODs obtained by most of the previously established methods.
Hydrophilic-interaction liquid chromatography (HILIC) are widely used in separation of polar compounds because of its good separation resolution for polar compounds [39]. And the high organic solvent content in the mobile phase can facilitate the ionization of analytes, which therefore can increase the detection sensitivity. Using the strategy based on "thiol-ene" click reaction [40], here we successfully prepared hydrophilic organic-silica hybrid monolith (detailed preparation procedure and characterization of monolithic column can be found in Supporting information and Fig. S1 in Supporting information). The formed monolith was homogeneous and can provide effective mass transfer and high stability. Compared with the polymer monolith that we prepared previously [22], the organic-silica hybrid monolith exhibited much better stability and permeability as well as larger specific surface area (302 m2/g).
The on-line trapping/cHILIC/MS system consisted of a micrOTOF-Q orthogonal-accelerated TOF mass spectrometer (Bruker Daltonics, Bremen, Germany). A 0.5-cm long ploy(MAA-coEGDMA) monolith (50 μm i.d. × 360 μm o.d.) was used as the on-line trapping column (Fig. 1). The ploy(MAA-co-EGDMA) monolith was prepared according to previously described method [41]. The hydrophilic organic-silica hybrid monolith (30-cm long, 75 mm i.d. × 360 μm o.d.) was used as separation column (Fig. 1). We used m6A and 5-mC as the analytes to optimize the on-line trapping conditions, including the loading flow rate, washing volume, and desorption volume. Detailed MS parameters can be found in Supporting information.
Firstly, we optimized the flow rate of the loading solution. When the loading flow rate increased from 2 μL/min to 15 μL/min, the peak areas of m6A and 5-mC did not changed apparently (Fig. 2A). When the loading flow rate increased from 15 μL/min to 40 μL/min, the peak areas of the two analytes decreased. Therefore, we used 15 μL/min as the loading flow rate. Secondly, we optimized the washing volume. The results showed that when the washing volume was more than 4 μL, the peak areas of m6A dropped dramatically (Fig. 2B) and the peak areas of 5-mC also obviously decreased once the washing volume was more than 8 μL. Therefore, we chose 4 μL as the washing volume.
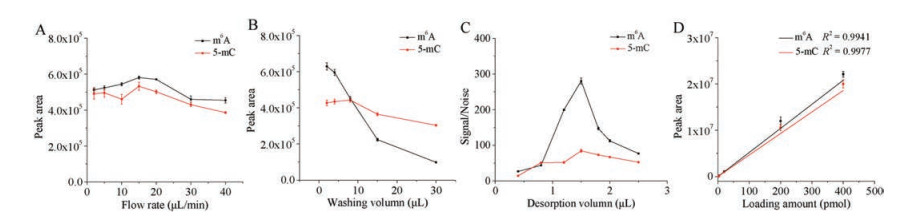
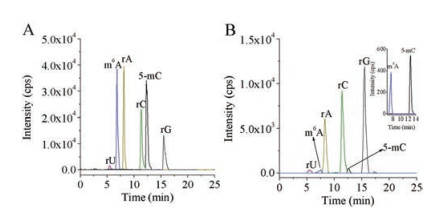
And then we optimized the desorption volume. When the desorption volume increased from 0.4 μL to 1.5 μL, the signal-tonoise ratio (S/N) of m6A and 5-mC increased (Fig. 2C). However, further increase of the desorption volume from 1.5 μL to 2.5 μL caused the decrease of the S/N of m6A and 5-mC (Fig. 2C), which can be attributed to the extending of the sample zone with the further increased desorption volume. As a result, we chose 1.5 μL as the desorption volume. Good linearities were obtained with linear coefficient R2 > 0.9941 in the range of 0–400 pmol of m6A and 5-mC (Fig. 2D), demonstrating that the ploy(MAA-co-EGDMA) on-line trapping column possessed high loading capacity. Taken together, the optimized on-line trapping conditions consisted of a loading flow rate of 15 μL/min, a washing volume of 4 μL, a desorption volume of 1.5 μL. Under the optimized conditions, the on-line trapping/cHILIC/MS analytical platform showed good separation of the 6 nucleosides (rC, rG, rA, rU, m6A, and 5-mC) (Fig. 3A). The identification and quantification ions for nucleosides were listed in Table S1 (Supporting information). The nucleosides can be well enriched with the recoveries of 6 nucleosides being between 84.9% and 99.1% (Data not shown).
The calibration curve of m6A and 5-mC was constructed by plotting the mean peak area ratio of m6A/rA or 5-mC/rC versus the mean molar ratio of m6A/rA or 5-mC/rC based on the data obtained from triplicate measurements. The results showed that good linearities within the range of 0.01%–1% of m6A/rA and 0.05%–10% of 5-mC/rC were obtained with the coefficient of determination (R2) being great than 0.9986 (Table 1). The LODs and the limits of quantification (LOQs), defined as the amounts of the analytes at S/ N of 3 and 10, respectively, were 0.06 fmol and 0.21 fmol for m6A and 0.10 fmol and 0.32 fmol for 5-mC (Table 1), which were much better than the LODs obtained by the previously established methods (Table 2) [42-47]. The high sensitivity of this on-line trapping/cHILIC/MS method could be attributed to the employment of on-line trapping approach and the miniaturized hydrophilic separation column.
 DownLoad:
CSV
DownLoad:
CSV

|
DownLoad:
CSV

|
In addition, the precision and accuracy of the on-line trapping/ cHILIC/MS method were evaluated by comparing the measured m6A and 5-mC contents to the theoretical m6A and 5-mC contents. The intra- and inter-day RSDs were calculated with different amounts of m6A and 5-mC spiked in nucleosides mixture. Three measurements over a day gave the intra-day RSDs, and the interday RSDs were determined by measuring samples for three consecutive days. The results showed that the intra- and inter-day RSDs for m6A and 5-mC were less than 14.56% and 13.41%, respectively; and relative errors (REs) being less than 13.50% and 14.20%, respectively (Tables 3 and 4), indicating good precision and accuracy can be achieved. The result demonstrated that the developed on-line trapping/cHILIC/MS method was reliable for the simultaneous quantification of RNA modifications of m6A and 5- mC.
DownLoad:
CSV

|
DownLoad:
CSV

|
Using the established on-line trapping/cHILIC/MS platform, we further quantified m6A and 5-mC contents in RNA of human blood. The research consisted of 36 healthy persons at the age of 6–14 years (18 persons) and 60–68 years (18 persons) that randomly selected after medical check-up in the physical examination center of Hubei Cancer Hospital (Table S2 in Supporting information). Persons who have history of tumor, diabetes, hypertension, metabolic syndrome, cardiovascular disease, endocrine system diseases, and liver, kidney system diseases were excluded. All the experiments were performed in accordance with Hubei Cancer Hospital Ethics Committee's guidelines and regulations.
Blood RNA was isolated using the E.Z.N.A.TM Blood RNA Kit (Omega, Norcross, GA) according to the manufacture's recommended protocol. The enzymatic digestion of RNA was performed according to the previously described method [46, 48]. Fig. 3B shows the extracted-ion chromatogram of the enzymatically digested product of human blood RNA. The chromatograms of m6A and 5-mC were extracted at m/z 150.076 (0.01) and 126.065 (0.01), respectively. Due to the high sensitivity of the developed method, we can easily quantified both m6A and 5-mC using only 0.5 ng RNA (Fig. 3B).
The contents of m6A and 5-mC in the blood RNA from 36 persons at the age of 6–14 years (18 persons) and 60–68 years (18 persons) were determined by on-line trapping/cHILIC/MS using the following formula:
|
|
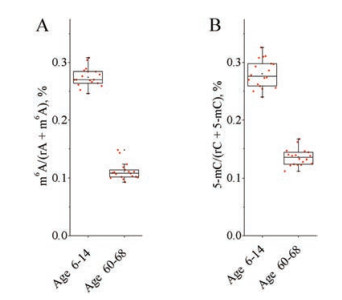
where Mm6 A, M5-mC, MrA, and MrC are the molar quantities of m6A, 5-mC, rA and rC determined in RNA samples. The results showed both m6A and 5-mC contents were significantly decreased with aging (p = 8.9 × 10⁻²⁷ for m6A; p = 2.1 ×10⁻²¹ for 5-mC, Fig. 4).
Extrinsic and intrinsic factors could influence RNA modifications of m6A and 5-mC during aging. It is possible that environmental exposure over time will activate cellular programs associated with consistent changes in RNA modifications. For example, stress has been shown to alter gene expression patterns through changes in DNA methylation [49], which may also contribute to RNA modifications. On the other side, early studies suggested global DNA methylation decreased in the brain and liver tissues of mice [50], human T cell [51] and peripheral blood cells [52]. The mechanisms contributing to the age-dependent decrease of global DNA methylation were proposed to be related to the decreased expression of DNA methyltreansfereases [53]. In this respect, the expression levels and activities of modification enzymes involve in the methylation and demethylation of RNA modifications of m6A and 5-mC may change during aging. But further investigations are required to elucidate the detailed mechanisms of the decrease of RNA modifications of m6A and 5-mC during aging. Nevertheless, the differences between RNA modifications of aging individuals suggested that quantitative measurements of RNA modifications states may identify factors involved with aging.
In conclusion, we developed a highly sensitive on-line trapping/ cHILIC/MS method to precisely and simultaneously measure RNA modifications of m6A and 5-mC, which can be achieved using only 0.5 ng of RNA. The detection limits were much better than previously established methods. Using this analytical platform, we reported the alteration of RNA epigenetic modifications of m6A and 5-mC in human blood during aging process. The results suggested that both m6A and 5-mC contents were significantly decreased with aging. Therefore, it is conceivable that RNA modifications of m6A and 5-mC from blood RNA may be potentially applied in aging-related studies.
This work is financially supported by the National Natural Science Foundation of China (Nos. 21522507, 21672166, 21728802, 21721005).
Supplementary material related to this article can befound, in the online version, at doi:https://doi.org/10.1016/j.cclet.2018.11.029.
C. He, Nat. Chem. Biol. 6(2010) 863-865. doi: 10.1038/nchembio.482
T. Liu, C.J. Ma, B.F. Yuan, Y.Q. Feng, Sci. China Chem. 61(2018) 381-392. doi: 10.1007/s11426-017-9186-y
M.A. Machnicka, K. Milanowska, O. Osman Oglou, et al., Nucleic Acids Res. 41(2013) D262-267.
M.D. Lan, B.F. Yuan, Y.Q. Feng, Chin. Chem. Lett. 30(2019) 1-6. doi: 10.1016/j.cclet.2018.04.021
G. Jia, Y. Fu, C. He, Trends Genet. 29(2013) 108-115. doi: 10.1016/j.tig.2012.11.003
J.E. Squires, H.R. Patel, M. Nousch, et al., Nucleic Acids Res. 40(2012) 5023-5033. doi: 10.1093/nar/gks144
K.D. Meyer, Y. Saletore, P. Zumbo, et al., Cell 149(2012) 1635-1646. doi: 10.1016/j.cell.2012.05.003
D. Dominissini, S. Moshitch-Moshkovitz, S. Schwartz, et al., Nature 485(2012) 201-206. doi: 10.1038/nature11112
B.S. Zhao, I.A. Roundtree, C. He, Nat. Rev. Mol. Cell Biol. 18(2017) 31-42.
X. Deng, R. Su, X. Feng, M. Wei, J. Chen, Curr. Opin. Genet. Dev. 48(2017) 1-7.
W. Huang, M.D. Lan, C.B. Qi, et al., Chem. Sci. 7(2016) 5495-5502. doi: 10.1039/C6SC01589A
X. Yang, Y. Yang, B.F. Sun, et al., Cell Res. 27(2017) 606-625. doi: 10.1038/cr.2017.55
T. Sibbritt, A. Shafik, S.J. Clark, T. Preiss, Methods Mol. Biol. 1358(2016) 269-284. doi: 10.1007/978-1-4939-3067-8
F. Aguilo, S. Li, N. Balasubramaniyan, et al., Cell Rep. 14(2016) 479-492. doi: 10.1016/j.celrep.2015.12.043
T.W. Munns, H.F. Sims, J. Chromatogr. A 111(1975) 403-408. doi: 10.1016/S0021-9673(00)99290-2
T.C. Brown, C. Juhlin, J.M. Healy, et al., JAMA Surg. 149(2014) 1146-1152. doi: 10.1001/jamasurg.2014.1694
A. Ferrone, M. Pesce, S. Franceschelli, et al., Electrophoresis 34(2013) 2275-2280. doi: 10.1002/elps.v34.15
N. Li, A. Nguyen, J. Diedrich, W. Zhong, J. Chromatogr. A 1202(2008) 220-223. doi: 10.1016/j.chroma.2008.06.046
B.F. Yuan, J. Zhang, H. Wang, et al., Cancer Res. 71(2011) 1904-1911. doi: 10.1158/0008-5472.CAN-10-3430
E. Yanez Barrientos, K. Wrobel, A. Lopez Torres, F. Gutierrez Corona, K. Wrobel, Anal. Bioanal. Chem. 405(2013) 2397-2404. doi: 10.1007/s00216-013-6703-x
B.F. Yuan, Adv. Clin. Chem. 67(2014) 151-187. doi: 10.1016/bs.acc.2014.09.003
M.L. Chen, F. Shen, W. Huang, et al., Clin. Chem. 59(2013) 824-832. doi: 10.1373/clinchem.2012.193938
B.F. Yuan, Y.Q. Feng, TrAC-Trend. Anal. Chem. 54(2014) 24-35. doi: 10.1016/j.trac.2013.11.002
W. Huang, C.B. Qi, S.W. Lv, et al., Anal. Chem. 88(2016) 1378-1384. doi: 10.1021/acs.analchem.5b03962
H.P. Jiang, T. Liu, N. Guo, et al., Anal. Chim. Acta 981(2017) 1-10. doi: 10.1016/j.aca.2017.06.009
H.Y. Zhang, J. Xiong, B.L. Qi, Y.Q. Feng, B.F. Yuan, Chem. Commun. (Camb.) 52(2016) 737-740. doi: 10.1039/C5CC07354E
H.P. Jiang, J. Xiong, F.L. Liu, et al., Chem. Sci. 9(2018) 4160-4167. doi: 10.1039/C7SC05472F
Q.Y. Cheng, J. Xiong, F. Wang, B.F. Yuan, Y.Q. Feng, Chin. Chem. Lett. 29(2018) 115-118. doi: 10.1016/j.cclet.2017.06.009
B.L. Qi, P. Liu, Q.Y. Wang, et al., TrAC-Trend. Anal. Chem. 59(2014) 121-132. doi: 10.1016/j.trac.2014.03.013
M.S. Jie, S.F. Mao, H.F. Li, J.M. Lin, Chin. Chem. Lett. 28(2017) 1625-1630. doi: 10.1016/j.cclet.2017.05.024
J. Ren, Y.Y. Wang, R.X. Feng, X.L. Kong, Chin. Chem. Lett. 28(2017) 537-540. doi: 10.1016/j.cclet.2016.10.032
B. Chen, B.F. Yuan, Y.Q. Feng, Anal. Chem. 91(2019) 743-756. doi: 10.1021/acs.analchem.8b04078
J.M. Chu, T.T. Ye, C.J. Ma, et al., ACS Chem. Biol. 13(2018) 3243-3250. doi: 10.1021/acschembio.7b00906
Y. Tang, J. Xiong, H.P. Jiang, et al., Anal. Chem. 86(2014) 7764-7772. doi: 10.1021/ac5016886
Y. Tang, S.J. Zheng, C.B. Qi, Y.Q. Feng, B.F. Yuan, Anal. Chem. 87(2015) 3445-3452. doi: 10.1021/ac504786r
Q.Y. Li, B.F. Yuan, Y.Q. Feng, Chem. Lett. 47(2018) 1453-1459.
D. Su, C.T. Chan, C. Gu, et al., Nat. Protoc. 9(2014) 828-841. doi: 10.1038/nprot.2014.047
L. Fu, C.R. Guerrero, N. Zhong, et al., J. Am. Chem. Soc. 136(2014) 11582-11585. doi: 10.1021/ja505305z
B. Buszewski, S. Noga, Anal. Bioanal. Chem. 402(2012) 231-247. doi: 10.1007/s00216-011-5308-5
M.L. Chen, J. Zhang, Z. Zhang, et al., J. Chromatogr. A 1284(2013) 118-125. doi: 10.1016/j.chroma.2013.02.008
Y. Fan, Y.Q. Feng, S.L. Da, Z.G. Shi, Anal. Chim. Acta 523(2004) 251-258. doi: 10.1016/j.aca.2004.07.052
S.H. Lee, B.H. Jung, S.Y. Kim, B.C. Chung, Rapid commun. Mass Spectrom. 18(2004) 973-977. doi: 10.1002/(ISSN)1097-0231
S.H. Cho, B.H. Jung, S.H. Lee, et al., Biomed. Chromatogr. 20(2006) 1229-1236. doi: 10.1002/(ISSN)1099-0801
W. Struck, D. Siluk, A. Yumba-Mpanga, et al., J. Chromatogr. A 1283(2013) 122-131. doi: 10.1016/j.chroma.2013.01.111
M. Yan, Y. Wang, Y. Hu, et al., Anal. Chem. 85(2013) 12173-12181. doi: 10.1021/ac4036026
F. Shen, W. Huang, J.T. Huang, et al., J. Clin. Endocrinol. Metab.100(2015) E148-E154. doi: 10.1210/jc.2014-1893
S.M. Huber, P. van Delft, L. Mendil, et al., Chembiochem 16(2015) 752-755. doi: 10.1002/cbic.201500013
B.F. Yuan, Methods Mol. Biol. 1562(2017) 33-42. doi: 10.1007/978-1-4939-6807-7
M. Romani, M.P. Pistillo, B. Banelli, Biomed Res. Int. (2015) (2015)587983.
V.L. Wilson, R.A. Smith, S. Ma, R.G. Cutler, J. Biol. Chem. 262(1987) 9948-9951.
J. Golbus, T.D. Palella, B.C. Richardson, Eur. J. Immunol. 20(1990) 1869-1872. doi: 10.1002/(ISSN)1521-4141
C. Fuke, M. Shimabukuro, A. Petronis, et al., Ann. Hum. Genet. 68(2004) 196-204. doi: 10.1046/j.1529-8817.2004.00081.x
N. Lopatina, J.F. Haskell, L.G. Andrews, et al., J. Cell. Biochem. 84(2002) 324-334. doi: 10.1002/(ISSN)1097-4644

Figure 2 Optimizations of the on-line trapping/cHILIC/MS conditions. The effects of (A) loading flow rate, (B) washing volume, (C) desorption volume and (D) loading amount on the analysis of m6A and 5-mC by on-line trapping/cHILIC/MS. Triplicate measurements were performed for all the evaluated conditions.

Figure 3 Extracted-ion chromatograms of nucleosides by on-line trapping/cHILIC/MS analysis. (A) Nucleoside standards obtained under the optimized conditions. (B) Nucleosides from RNA of human blood. Shown in the inset is the expanded chromatogram of m6A and 5-mC.q

Figure 4 Quantification of m6A (A) and 5-mC (B) in human blood RNA from 36 healthy individuals persons at age of 6–14 years (18 persons) and 60–68 years (18 persons). Each point represents the content of each sample. p = 8.9 ×10⁻²⁷ for m6A; p = 2.1 ×10⁻²¹ for 5-mC.
Table 1. Linearities, LOQs, and LODs for m6A and 5-mC obtained by on-line trapping/cHILIC/ESI-MS method.
|
|
 下载: 导出CSV
Table 2. Comparison of the developed on-line trapping/cHILIC/ESI-MS method with other methods for the detection of m6A and 5-mC in RNA.
|
|
下载: 导出CSV
Table 3. Accuracy and precision for the detection of m6A by on-line trapping/cHILIC/ESI-MS method.
|
|
下载: 导出CSV
Table 4. Accuracy and precision for the detection of 5-mC by on-line trapping/cHILIC/ESI-MS method.
|
|
下载: 导出CSV

 扫一扫看文章

扫一扫关注我们

