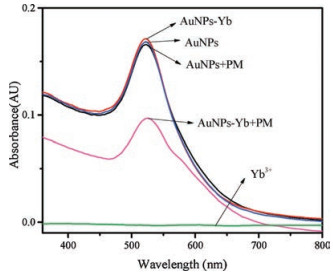
Figure 1.
UV–vis spectra of AuNPs interacting with different substrates
A sensitive and rapid UV-vis spectrophotometry for organophosphorus pesticides detection based on Ytterbium (Yb3+) functionalized gold nanoparticle
Yuan Li , Qingjiao Luo , Rong Hu , Zongbao Chen , Ping Qiu

Organophosphorus pesticides (OPs) play an important role in agricultural production and are widely used in the world because of their high insecticidal toxicity and low environmental hazard [1-4]. But the amount of use and irregular post-processing is growing continually, resulting in a large amount of pesticide residues. According to statistics data, there are about 250, 000 to 370, 000 people in the world suffer from pesticide residues every year [5]. Therefore, it is necessary to establish a rapid, sensitive and accurate method for detecting pesticides residues. Traditional methods for detecting pesticides include gas/liquid chromatography [6-9], gas/liquid chromatography-mass spectrometry [10-12], liquid chromatography tandem mass spectrometry [13], and high performance liquid chromatography [14-16]. However, these methods have high instrument cost, high technical requirements, complicated sample preparation, and long time-consuming for real-time detection in the field.
In recent years, the application of nanotechnology methods has attracted worldwide attention [17-21], which are highly specific in terms of detecting, degrading and removal pesticides [22]. One is that gold nanoparticles (AuNPs) in the detection of pesticides have the small particle size of AuNPs, high surface physicochemical properties and high target specificity [23-27]. Moreover, AuNPs has a high extinction coefficient and is 3–5 orders of magnitude higher than organic dye molecules [28]. According to Bouguer's law, AuNPs with high extinction coefficient produce greater absorbance than organic dye molecules when detecting the same concentration of target substance, which is more conducive for detecting target substances. As we known, crosslinking molecules typically have two different types of binding sites: the one with attaching on the gold nanoparticles and the other one with attaching on the analyte molecules. Gold nanoparticles also can be programmed by specific cross-linking molecules in intermolecular chain aggregation. However, there exit low efficiency during the reaction, and the main reason is that it is difficult to achieve the optimal binding performance of the crosslinked molecules. That it, if the cross-linking molecules are linked to the emission and analyte molecules by the same interaction, the best binding properties are relatively easy to achieve.
Ytterbium is one of the typical rare earth elements, and it has become more and more concerned and valued because of its nontoxicity, environmental friendliness and ultra-high phosphate adsorption capacity [29]. Rare earth-doped upconversion nanoparticles (UCNPs) have a broad application prospects in biological detection due to their unique frequency upconverting capability and high detection sensitivity [30, 31]. At this stage, there are many related methods using Yb for detecting pesticides. Among them, Yb ions are used in the synthesis of upconversion nanoparticles as the sensitizer and upconversion fluorescence resonance energy transfer [32, 33].
In this paper, we have developed a new sensitive detection probe based on Yb3+ functionalized AuNPs and applied for the determination of OPs. Prepared AuNPs possess oxygen-containing functional groups and strong complexation reaction happened with Yb3+. While OPs can combine with Yb3+ as a cross-linking molecule to produce insoluble yetterbium phosphate, resulting in the aggregation of AuNPs and great decrease in ultraviolet absorbance strength. The method was applied for determination of OPs in real samples with satisfied results.
Chloroauric Acid (HAuCl4·3H2O) was purchased from SigmaAldrich (St. Louis, MO, USA). Ytterbium chloride (YbCl3) was purchased from Shanghai Mountain Pu Chemical Co., Ltd. Parathion-methyl (PM, 100 μg/L) was supplied by Chem Serve, West Chester, PA, USA and used without further purification and dissolved in methanol. Other chemicals were analytical grade reagents and all solutions were prepared using double-distilled deionized water. All glassware was cleaned by aqua regia and double-distilled water more than three times.
UV-vis absorption spectra were recorded on an Agilent 8453 UV–vis spectrophotometer (Agilent Technolo-gies, Santa Clara, CA, USA). Transmission electron microscopy (TEM) measurements were made on JEM-2100 (JEOL Co., Japan). The associated point and linear resolutions were 0.23 nm and 0.14 nm, respectively, and the operational accelerating voltage was 200 kV. The samples for TEM characterization were prepared by placing a drop of solution on a carbon coated copper grid and dried it at room temperature.
Citrate-stabilized AuNPs were prepared according to the literature [34]. HAuCl4·3H2O (100 mL, 1 mmol/L) solution was heated with vigorous stirring. When HAuCl4 solution was heated to boiling, trisodium citrate solution (10 mL, 38.8 mmol/L) was added into above solution. And then the color of solution changed from light yellow to wine red. After that the mixture solution was kept boiling under vigorous stirring for another 15 min. Finally, the solution (AuNPs) was cooled down to room temperature. The solution was stored at 4 ℃. The sizes of the nanoparticles were about 20 nm by TEM analysis and the corresponding absorption band is at 520 nm by UV–vis.
AuNPs (0.25 mmol/L) were prepared in 0.01 mol/L CH3COONa-CH3COOH (ABS) buffer of pH 5.0. Then, amount of YbCl3 and NaCl solution was added into the above solution with a finally concentration of 0.10 mmol/L and 1.50 mmol/L respectively. The mixture solution was stirred for 1 h. And then AuNPs-Yb were obtained and stored at 4 ℃ for further use.
Different concentration of PM was added into the AuNPs-Yb solution (2000 μL), and the final concentration of PM were set to be 0, 5 ×10⁻⁸, 6 ×10⁻⁷, 1.2 ×10⁻⁶, 1.8 ×10⁻⁶, 2.4 ×10⁻⁶, 3 ×10⁻⁶, 4 ×10⁻⁶, 5 ×10⁻⁶ and 6 ×10⁻⁶ g/L with measure stirring. UV–vis was used to detect different concentration of PM.
Lake water, apples and pears were chosen as the real samples with the standard addition method. Apples and pears were bought in supermarkets in Nanchang city, and water samples were obtained from Ruixi Lake in Nanchang University. The three samples were pretreated according to the previous literature [35]. Briefly, the apples and pears were sprayed with OPs for 12 h and were cut into small pieces and chopped. 20 g of them were dissolved in 20 mL of methanol, and allowed to stand for 3 h. After filtration, some insoluble materials were removed and collected. Available juice, ready to use. The collected water sample was first allowed to stand for a while, then filtered through a 0.22 μm filter membrane, and then centrifuged for 30 min using a centrifuge at a rotational speed of 12, 000 rpm. 250 mL of water sample were collected and a drop of phosphoric acid and 1.0 mL 0.1 mol/L ferrous sulfate solution were added to remove free chloride ions and oxidant. And 1.0 mL copper sulfate solution was then added to eliminate microorganisms in the sample. Finally, the prepared water samples were analyzed.
In the process of preparation of citrate-stabilized AuNPs, the redundant citrate ions were absorbed on the surface of AuNPs.While Yb3+ has a very strong affinity to negatively charged AuNPs, covalent raction are prone to occur by forming Yb-O covalent bonds on the surfaces of AuNPs which show strong absorbance at 520 nm by UV– vis spectrophotometer(Fig. 1).Ontheotherhand, oxygen-containing thiophosphate of OPs (parathion-methyl, PM for example) can combine with Yb3+ as a cross-linking molecule to produce insoluble yetterbium phosphate, resulting in the aggregation of AuNPs and great decrease in ultraviolet absorbance strength at 520 nm. It was found the degree of absorbance decrease was directly proportional to the concentration of PM based on AuNPs-Yb.
The effect of Yb3+ on UV–vis absorption spectra was used to confirm the above mechanism and compared the UV absorption of Yb, AuNPs, AuNPs-Yb, AuNPs + PM and AuNPs-Yb + PM at the same conditions. In Fig. 1, it was found obviously that the solution of Yb3+ ion alone has no absorption peak at 520 nm. In addition, there are no significant effect in the absorption peak of AuNPs and the AuNPs with PM. After functionalized of AuNPs, it can be seen that the absorption was scarcely affected in the visible region. However, once PM was added into AuNPs-Yb, there was a marked drop in the absorbance of AuNPs-Yb, which proved that the favorable reaction between Yb3+ and oxygenous phosphate group of PM led to the aggregation of AuNPs.
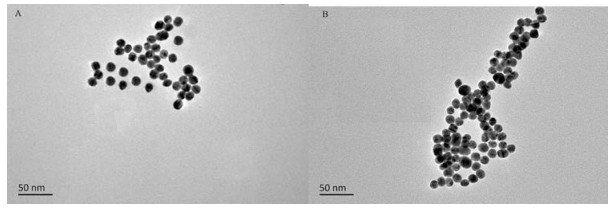
To further prove aggregation of AuNPs when PM was introduced to AuNPs-Yb system, the distribution of AuNPs was also observed by using TEM-generated images (Fig. 2) before and after the addition of PM. When PM was not present, AuNPs-Yb was relatively evenly distributed (Fig. 2A). However, when PM was added, the particles bonded together and have significant polymerization (Fig. 2B). Therefore, the results of TEM are more likely to prove that the aggregation of AuNPs is due to cross-linking with other ions and molecules, which is consistent with the previous articles [18, 36, 37].
Before the application of the probe for the detection of OPs, several factors that may affect the interaction of AuNPs-Yb with OPs were optimized, such as media pH, concentration of Yb3+ and NaCl and volume ratio of VAu/VABS in the colloidal solution. Here, absorbance ratio of AuNPs-Yb and PM agminated AuNPs-Yb (A0/A, A and A0 are the absorbance in the presence and absence of PM, respectively) was used as a criterion.
Firstly, the effect of the media pH was investigated with CH3COONa-CH3COOH (ABS) buffer at pH range of 4.2–7.0. It was found that pH not only affects the interaction degree between AuNPs-Yb and PM, but also the stability of AuNPs and reached the optimal system at pH 5.0. Moreover, it was found that A0/A had the maximum value with 1.42 at pH 5.0. Because the concentration of Yb3+ affects complexation reaction and aggregation of AuNPs, AuNPs-Yb probes were synthesized with varying initial Yb3+ concentrations of 0.02–0.16 mmol/L range. When the concentration of Yb3+ is lower than 0.10 mmol/L, A0/A in absorbance between AuNPs-Yb and PM agminated AuNPs-Yb has not changed. However, A0/A increases sharply when the concentration of Yb3+ is greater than 0.10 mmol/L. This is because that Yb3+ formed coordination compound with a plurality of oxygen-containing groups. As the concentration of Yb3+ increases, one Yb3+ binds to two or more AuNPs, resulting in aggregation of AuNPs. Therefore, the best concentration of Yb3+ was set to 0.10 mmol/L. According to the previous report, the concentration of NaCl has a great influence on the sensitivity of the measurement system [38]. It was found A0/A began to increase obviously when the concentration of NaCl is exceed 1.5 mmol/L. In order to improve the sensitivity and efficiency of sensors, the volume ratio of VAu/VABS has also been studied. We studied five different volume ratios of VAu/VABS, and the results show that A0/A is the largest with VAu/VABS for 1:3.
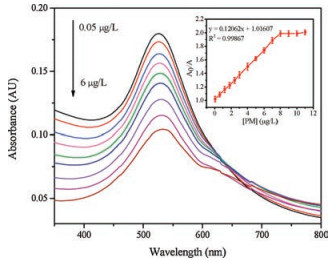
Under the optimized conditions, different concentrations of PM were added to the AuNPs-Yb system to assess sensitivity of the sensors. As shown in Fig. 3, the UV absorption intensity decreases as the concentration of PM increases at 520 nm with increasing concentration of PM. And the UV absorption intensity is linear with the PM concentration ranging from 0.05 μg/L to 6.0 μg/L with the limit of detection of 0.03 μg/L (S/N = 3), which is far lower than the maximum residue limit (0.01 ppm) in the European Union pesticides database. In 2014, Wang et al. [31] used Lanthanumfunctionalized gold nanoparticles to detected methyl parathion with a detection limit of 0.5 nmol/L. You et al. [32] used upconversion nanoparticles and gold nanoparticles as labels to detected imidaclothiz with the limits of detection of 2.1 ng/mL in 2017. So the developed analysis is more sensitivity than those previously reported.
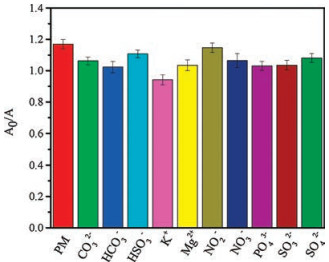
In order to verify the selectivity of the method, we have studied K+, Mg2+ and some common oxygen-containing inorganic ions such as CO32-, HCO3-, HSO3-, NO2-, NO3-, PO43-, SO32-, SO42-. Under the optimal conditions, the experiment was performed with 5.0 μg/L PM as shown in Fig. 4. It can be seen that the A0/A changes slightly, which indicated the method was suitable for the selective recognition of PM.
To verify the accuracy and applicability of the method, standard addition method and the proposed sensor was further tested in three real samples. The results were summarized shown in Table 1. For six measurements, the recoveries vary from 83.9% to 126% and RSD from 0.2% to 4.4%. The results indicated that the method can be used to detect PM in real samples with satisfactory results.
In conclusion, we have successfully studied a kind of sensitive, rapid and simple optical sensor for detection of PM in real samples of water, apple and pear because this method does not require excessive modification and complex manipulation of the probes. The linear range and limitof detectionwere 0.05–6.0 μg/L and 0.03 μg/L, respectively, which is far lower than the traditional methods that previously reported. Therefore, this method has potential application prospects in the field of environmental and food monitoring.
This work was financially supported by the National Natural Science Foundation of China (Nos. 21765015, 21808099, 21765018) and the Jiangxi Province Food and Drug Administration Science Foundation, China (No. 2016SP04).
D. Zhang, D.J. Yu, W.J. Zhao, et al., Analyst 137(2012) 2629-2636. doi: 10.1039/c2an35338e
B. Das, P. Das, Environ. Control. Biol. 72(2004) 496-503.
S.R.D. Solla, P.A. Martin, P. Mikoda, Sci. Total Environ. 409(2011) 4306-4311. doi: 10.1016/j.scitotenv.2011.06.046
W. Battaglin, J. Fairchild, Water Sci. Technol. 45(2002) 95-102. http://med.wanfangdata.com.cn/Paper/Detail/PeriodicalPaper_PM12079130
A.H. Dawson, M. Eddleston, L. Senarathna, et al., PLoS Med. 7(2010) e1000357. doi: 10.1371/journal.pmed.1000357
J.Y. Lee, H.K. Lee, Anal. Chem. 83(2011) 6851-6856.
P. Payá, M. Anastassiades, D. Mack, et al., Anal. Bioanal. Chem. 389(2007) 1697-1714. doi: 10.1007/s00216-007-1610-7
A.Cappiello, G.Famiglini, P.Palma, F.Mangani, Anal.Chem.74(2002)3547-3554. doi: 10.1021/ac015685f
S. Lacorte, D. Barcelo, Anal. Chem. 68(1996) 2464-2470. doi: 10.1021/ac9601674
M. Amirahmadi, H. Yazdanpanah, F. Kobarfard, et al., Iran. J. Pharm. Res. 17(2018) 124-139.
D.B. Alcântara, M.S.O. Paz, T.H.S. Rodrigues, et al., J. Braz. Chem. Soc. 29(2018) 2180-2188.
A.L. Oenning, J. Merib, E. Carasek, J. Chromatogr. B 1092(2018) 459-465. doi: 10.1016/j.jchromb.2018.06.047
L.D. Wang, X.Y. Wang, S.S. Di, et al., Environ. Sci. Pollut. Res. Int. 25(2018) 18772-18780. doi: 10.1007/s11356-018-1707-x
Z.Y. Qian, Z.G. Li, J. Ma, T.T. Gong, Q.M. Xian, Talanta 173(2017) 101-106. doi: 10.1016/j.talanta.2017.05.079
C.C. Leandro, P. Hancock, R.J. Fussell, B.J. Keely, J. Chromatogr. A 1103(2006) 94-101. doi: 10.1016/j.chroma.2005.10.077
L.J. He, X.L. Luo, H.X. Xie, et al., Anal. Chim. Acta 655(2009) 52-59. doi: 10.1016/j.aca.2009.09.044
J.S. Lee, M.S. Han, C.A. Mirkin, Angew. Chem. Int. Ed. 46(2007) 4093-4096. http://www.researchgate.net/publication/6368652_Colorimetric_detection_of_mercuric_ion_(Hg2)_in_aqueous_media_using_DNA-functionalized_gold_nanoparticles
J.J. Feng, H. Guo, Y.F. Li, et al., ACS Appl. Mater. Interfaces 5(2013) 1226-1231. doi: 10.1021/am400402c
D.B. Liu, Z. Wang, X.Y. Jiang, Nanoscale 3(2011) 1421-1433. doi: 10.1039/c0nr00887g
W. Zhao, M.A. Brook, Y. Li, Chembioform 9(2008) 2363-2371. https://www.researchgate.net/publication/6747489_Wrapping_single-walled_carbon_nanotubes_with_long_single-stranded_DNA_molecules_produced_by_rolling_circle_amplification
J. Thavanathan, N.M. Huang, K.L. Thong, Biosens. Bioelectron. 55(2014) 91-98. doi: 10.1016/j.bios.2013.11.072
S.Q. Liu, L. Yuan, X.L. Yue, Z.Z. Zheng, Z.Y. Tang, Adv. Powder Technol.19(2008) 419-441. doi: 10.1016/S0921-8831(08)60910-3
G.D. Liu, Y.H. Lin, Talanta 74(2007) 308-317. doi: 10.1016/j.talanta.2007.10.014
S.Q. Liu, L.J. Xie, J. Zheng, et al., Anal. Chim. Acta 878(2015) 109-117. doi: 10.1016/j.aca.2015.03.054
Q. Long, H.T. Li, Y.Y. Zhang, S.Z. Yao, Biosens. Bioelectron. 68(2015) 168-174. doi: 10.1016/j.bios.2014.12.046
W.J. Liu, T.T. Qian, H. Jiang, Chem. Eng. J. 236(2014) 448-463. doi: 10.1016/j.cej.2013.10.062
Y.W. Tang, H. Liu, J.W. Gao, et al., Talanta 181(2018) 95-103. doi: 10.1016/j.talanta.2018.01.006
X.W. Liu, D.S. Wang, Y.D. Li, Nano Today 7(2012) 448-466. doi: 10.1016/j.nantod.2012.08.003
W.W. Hu, Q.S. Chen, H.H. Li, Q. Ouyang, J.W. Zhao, Biosens. Bioelectron. 80(2016) 398-404. doi: 10.1016/j.bios.2016.02.001
Q. Ouyang, Y. Liu, Q.S. Chen, et al., Food Control 81(2017) 156-163. doi: 10.1016/j.foodcont.2017.06.004
X.D. Wang, Y.Y. Yang, J. Dong, F. Bei, S.Y. Ai, Sensor. Actuat. B-Chem. 204(2014) 119-124. doi: 10.1016/j.snb.2014.07.093
H.J. You, X.D. Hua, L. Feng, et al., Microchim. Acta 184(2017) 1085-1092. doi: 10.1007/s00604-017-2097-3
Z. Zhang, M. Zhang, X.Y. Wu, et al., Microchem. J. 124(2016) 181-187. doi: 10.1016/j.microc.2015.08.024
D.G. Liu, W.W. Chen, J.H. Wei, et al., Anal. Chem. 84(2012) 4185-4191. doi: 10.1021/ac300545p
J.R. Bhamore, P. Ganguly, S.K. Kailasa, Sensor. Actuat. B-Chem. 233(2016) 486-495. doi: 10.1016/j.snb.2016.04.111
H.C. Su, H. Fan, S.Y. Ai, et al., Talanta 85(2011) 1338-1343. doi: 10.1016/j.talanta.2011.06.017
Y. Xue, H.Z. Zhao, Z.J. Wu, et al., Analyst 136(2011) 3725-3730. doi: 10.1039/c1an15238f
K. Sato, K. Hosokawa, M. Maeda, J. Am. Chem. Soc. 125(2003) 8102-8103. doi: 10.1021/ja034876s

Figure 3 UV–vis spectra of the AuNPs-Yb with different concentration of PM. Inset: The linear relationship between A0/A with the concentration of PM

Figure 4 The selectivity of AuNPs-Yb probe with 5.0 μg/L PM in the absence and presence of 20 μmol/L CO32-, HCO3-, HSO3-, K+, Mg2+, NO2-, NO3-, PO43-, SO32- and SO42-, respectively

 扫一扫看文章

扫一扫关注我们
 DownLoad:


 下载:
下载:
