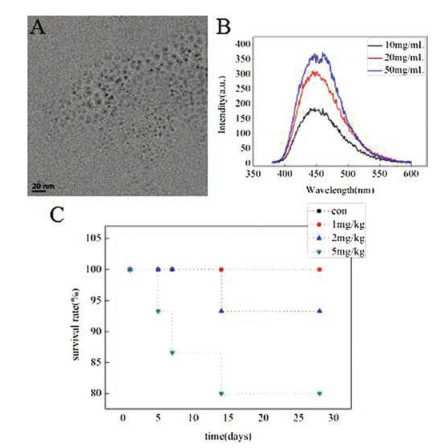
Figure 1.
(a) The TEM images and (b) the fluorescence intensity of CDs and (c) the survival rate of mice after treated with CDs by single inhalation.
Toxicity and bio-distribution of carbon dots after single inhalation exposure in vivo
Yue Yang , Xiangling Ren , Zhenning Sun , Changhui Fu , Tianlong Liu , Xianwei Meng , Zili Wang

In recent decades, there is an increasing attention about bioapplication of carbon dots due to its desired advantages of excellent light stability, no scintillation, and adjustable luminous range [1-3]. The hydro-dispersed carbon dots can be potentially utilized for cellular imaging or metal ion probes in biochemistry [4-7]. There are many experiments demonstrated the potential applications of CDs in biomedical labeling, imaging, sensing and detecting [8-13]. In most recent, some research found that CDs can be used in cancer chemotherapy and NIR photothermal therapy [14-18]. However, the information of CDs toxicity evaluation is still lack. Liu et al. examined the toxicity of CDs using E. coli as testing model and found that CDs had a concentration-dependent effect on the growth of microorganism [19]. Sun and his co-workers reported that acute and chronic toxicities of carbon dots to Physa acuta. They found that no acute but chronic toxicities to P. acuta exposed to different treatment concentrations of the CDs [20]. Xiao et al. investigated the toxic effects of CDs on rare minnow embryos at different developmental stages [21]. Their results suggested that the CDs exposure induced serious embryonic cellular DNA damage and might result from the pressure of induced oxidative stress mediated by the CDs exposure. Most toxicity research of CDs focus on evaluation of invertebrate animals or cytotoxicity in vitro [22-24]. However, there are less reports about the toxicity evaluation of CDs based on mammal models. Especially, the studies focus on the potential negative effect of the CDs on the animals exposed by inhalation is still rare.
In the present study, mice received CDs of different treatment concentrations by the inhalation route, and the basic physiological condition during the study was observed and recorded, including mortality and usual activity. Also, the blood indexes of mice after inhaling CDs were detected. At the same time, the damage of the main organs (include liver, lung, kidney and brain) of the mice were evaluated. Furthermore, the bio-distribution of CDs is measured by detecting the fluorescence intensity of CDs in liver, lung, kidney and brain. This study provides a novel insight about the toxicity and bio-distribution of CDs and provides a basis for the potential application of CDs as a labeling marker.
First of all, CDs were prepared by hydrothermal method with citric acid as the carbon source and ethylenediamine as the coreactant according to the previous method [25]. Detailed procedure of CDs preparation and characterization were shown in Supporting information. Transmission electronmicroscopy (TEM) (Model JEM-2100) was used to characterize the surface morphology of the CDs. Atomic force microscope (AFM) was employed for size and morphology characterization. X-ray photoelectron spectroscopy (XPS) was used to characterize the content of CDs. The emission spectra was investigated for evaluation of the optical properties of CDs. Zeta potential and size distribution was characterized by dynamic light scattering using a using the Malvern Zetasizer 3000HS at 25 ℃.
Then, ICR mice of 6–8 weeks and body weight of 20–22 g were purchased from Beijing Vital River Laboratory Animal Technology Co., Ltd. Mice were divided into 4 groups of 15 each randomly and raised with fresh pathogen-free food and water. After one week orientation, mice were weighted and anesthetized with an intraperitoneal injection of 0.1 mL 1.5% pentobarbital sodium solution. The anesthetized mice received 50 μL CDs with different concentration (5 mg/mL, 2 mg/mL, 1 mg/mL and 0 mg/mL) by single nose drops and the dosage information was list in Table S1. Death was recorded and necropsy was performed immediately. Survival mice in every groups sacrificed at 1 day, 7 and 28 days for blood and tissue sample collection. Experimentation with animals was governed by the Regulations of Experimental Animals of Beijing Authority and approved by the Animal Ethics Committee of the China Agriculture University.
The blood collected from ophthalmic vein was used for blood routine test. Blood routine examination include red blood cell (RBC), white blood cell (WBC), mean corpuscular volume (MCV), hemoglobin(HGB), hematocrit (HCT), mean corpuscular hemoglobin (MCH), mean corpuscular hemoglobin concentration (MCHC) and blood platelet (PLT). The serum were collected after centrifugation at 3000 r/min for 15 min of blood and used for blood biochemical test. Liver function markers including alanine aminotransferase (ALT), aspartate aminotransferase (AST) and kidney function markers including blood urea nitrogen (BUN) and creatinine (CREA) were assessed.
In order to study the distribution of CDs in vivo, the lung, liver, kidney and brain tissues were collected and put into homogenizer to grind into tissue homogenate after cell disruption by ultrasonic cell rusher. Then the precipitate was removed by centrifugation, and the fluorescence emission intensity of the clear supernatant extract were detected at 350–600 nm spectrum. Also, 10 μL 1 mg/mL CDs were added into the supernatant of the relevant tissue of the control animals and used as the control group.
Careful necropsy was conducted at 1 day, 7, and 28 days after inhalation of CDs at the dose of 5 mg/kg, 2 mg/kg and 1 mg/kg, respectively. The organs of lung, liver, kidney, heart, spleen and brain recovered from the necropsy were fixed in 10% formalin and performed histological examination using standard techniques [26]. The slides were observed and photos were taken using optical microscope (Olympus X71, Japan). All the identity and analysis of the pathology slides were blind to the pathologist.
For transmission electron microscopy (TEM), the liver and lung samples of 5 mg/kg group at 28 days after inhalation were cut into pieces (2 × 2 mm) and fixed in 2.5% (v/v) glutaraldehyde-polyoxymethylene solution for 6 h at 4 ℃. The tissues were washed and post fixed in 2% OsO4 for 1 h at 4 ℃. The tissue was dehydrated through ascending grades of ethanol and embedded in araldite CY212 [27]. Ultrathin sections (60 nm) were cut and stained with uranyl acetate and alkaline lead citrate. The sections were viewed on a JEM 100CX TEM, operating at 80 kV.
Statistical results were expressed as the mean ± standard deviation (S.D). Multigroup comparisons of the means were carried out by one-way analysis of variance (ANOVA) tests using SPSS 16.0 (SPSS Inc., Chicago, IL). The statistical significance for all tests was set at P < 0.05.
TEM image of the as-prepared CDs was shown in Fig. 1A. The products consist of small particles which are well separated from each other. The diameter of the as-prepared CDs is about 5–8 nm under TEM. AFM results showed that the as-prepared CDs size is about 0.5–1.5 nm (Figs. S1A and B in Supporting information). The fluorescence emission spectrum shows a peak centered at 440 nm (Fig. 1B). The inset in Fig. 1B showed the CDs solution at different concentrations are emit blue fluorescence under UV light (365 nm). XPS results showed that major content of CDs is carbon, nitrogen and oxygen (Fig. S1C in Supporting information). Because of the small size of CDs, no effective size distribution date was obtained by Malvern Zetasizer 3000HS. Zeta potential of CDs is -10.7 mV and showed in Fig. S2 in Supporting information. These solutions were sterilized with the membrane filters (0.22 μm) and dialyzed twice before the administration to the animals.
The survival rate of mice after treatment was the most visualize data of the toxicity of CDs. Fig. 1C showed the survival rate of mice before they were sacrificed. The survival rate of mice received CDs at the concentration of 5 mg/kg sunk to 86.6% at 7 days and fell to 80% at 15 days. The survival of 2 mg/kg group is 94% in the whole experiment. No death was observed in the 1 mg/kg and the control groups. These results showed that CDs has toxicity at higher dosages when animals received them by inhalation route.
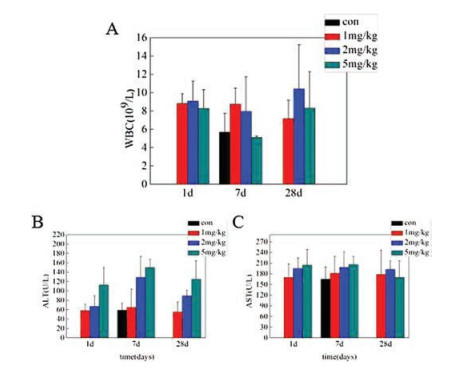
The standard hematology markers such as RBC, WBC, HCT, MCV, MCH, MCHC, HGB and PLT were measured. As shown in Fig. 2A and Fig. S3 (Supporting information), there was no significant difference of RBC, HCT, MCV, HGB, PLT, MCH and MCHC between the experiment group and the control group. However, compared with the control group, there were significant increase of WBC of all the mice received CDs at 1day, 7 days and 28 days (P < 0.05) except 5 mg/kg group at 7 days. These results indicated that CDs maybe induce the inflammation happen in the body. For blood biochemical analysis, liver function markers including ALT, AST were assessed. ALT is specific for cellular injury in the liver and AST is also useful, but less specific. As shown in Figs. 2B and C and Fig. S4 (Supporting information), no obvious changes of these two markers were observed by CDs at 1 mg/kg, but when the concentration of CDs up to 2 mg/kg and 5 mg/kg, both ALT and AST enhance higher than the control group. Compared with the control group, no obvious difference of the BUN and CREA were observed in other groups. These suggest us that CDs induce the damages of the liver instead of the kidney.
For biodistribution of CDs in vivo, we examined the fluorescence absorption of homogenate of liver, lung, brain and kidney of animals received CDs at 5 mg/kg. As shown in Fig. 3, the fluorescence emission spectrum of the homogenate of the lung and the brain were consistent with the spectrum of CDs solution. However, there were two emission peaks at 440 nm and 520 nm of the homogenate of the liver and kidney. The ferroheme or other substance in the liver and kidney could not affect the fluorescence emission spectrum of CDs as shown in Fig. 3. Therefore, the fluorescent intensity measurement of CDs in the tissues homogenate present the amount of CDs located in the tissues.
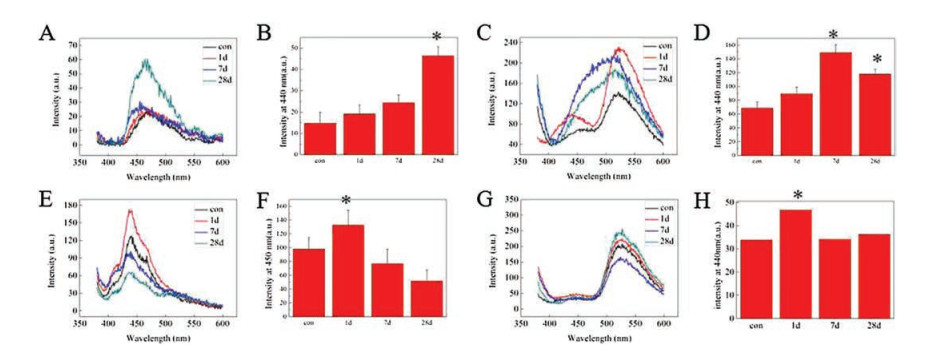
We also measured the fluorescence signal intensity of the peak at 440 nm of each tissues and shown in Fig. 3. Compared with the control group, the homogenate of lung of the mice treated 5 mg/kg CDs at the 28th day showed a strong absorption peak at about 440 nm, while there was no significant difference the group of the 1st day and the 7th day showed. The fluorescence signal intensity of the peak at 440 nm of 28 days was higher than the control group (P < 0.05). Fig. 3 showed the fluorescence emission spectrum of liver and the signal intensity at 440 nm of 7 days and 28 days were significantly increased in comparison with the control group (P < 0.05). The fluorescence emission spectrum of the homogenate of brain was shown in Fig. 3. The signal intensity at 440 nm of 1 day was significantly increased (P < 0.05). The fluorescence emission spectrum and signal intensity of the homogenate of kidney was shown in Fig. 3. Compared with the control group, it could find that there was significant increase of the signal intensity of kidney at 1 day (P < 0.05). These results of the lung and liver showed that the fluorescent intensity increase with time-dependent manner. However, the highest intensity of the brain and kidney were observed at 1 day. These results suggested that CDs located in the lung and liver for about one month and parts of CDs can eliminate from the kidney in the early period. Thus, the lung and the liver were considered as the major target organs of CDs after single inhalation exposure.
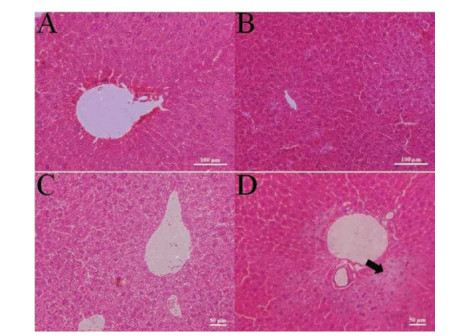
The pathological changes of the major organs confirmed the assumption. The pathological examination of the brain, liver and lung of the mice received 5 mg/kg CDs at the 1st, 7th and 28th day were showed in Fig. S5 (Supporting information), Fig. 4 and Fig. S6 (Supporting information), respectively. Compared with the control group, there were no obvious changes of brain, liver and lung of mice received 1 mg/kg and 2 mg/kg CDs and shown in the supporting information (Figs. S7–S9 in Supporting information). There was no obvious change of the brain of the mice received 5 mg/kg CDs in comparison with the control group at different periods (Fig. S5). As shown in Fig. 4D, cellular swelling and necrosis were observed in the liver of mice at 28 days. There were no obvious change of liver of mice received CDs at 5 mg/kg at 1 day and 7 days. As shown in Fig. S6C, congestion, edema and a large number of lymphocytic infiltration were observed in the lung of mice at 7 days. There were no obvious change of lung of mice received CDs at 1 day and 28 days. Fig. S10 (Supporting information) shows the TEM images of the liver and lung of the mice after single inhalation of CDs at 5 mg/kg. In lung, vacuolation was observed in the type Ⅱ alveolar epithelial cells indicated by thin white arrow show (Figs. S10A and B). Bold white arrow showed vesiculation in Kuffers cells in the liver in Figs. S10C and D. The vesiculation was formed from the phagocytosis of the damaged subcellular organelles. These results suggested that CDs induce the ultrastructural change of the lung and liver. It was consistent with the results of hematology and blood biochemical analysis. Our findings indicated that CDs induce the injury of the lung and liver when mice received CDs by single inhalation exposure with a dose-dependent and time-dependent manner.
In a word, the survival, pathological, blood biochemical index assay and biodistribution of CDs in the mice after treated through inhalation exposure demonstrate that CDs could induce injury to the mice. And the biodistribution results suggested that the major target organs of CDs are the lung and the liver. Meanwhile, the fluorescent intensity measurement was proved to be an effective method for detection the location of CDs in vivo. Although accurate quantify detection of CDs needs to be studied further, our findings may provide important information for the toxicity and distribution of carbon dots in the potential biomedical applications.
The authors acknowledge financial support from the National Natural Science Foundation of China (Nos. 61571426, 61671435, 31400854), National Hi-Tech. Research and Development Program of China (No. 2013AA032201) and Beijing Natural Science Foundation (No. 4161003).
Supplementary data associated with this article can be found, in the online version, at https://doi.org/10.1016/j.cclet.2018.04.018.
N.C. Gong, Y.L. Li, X. Jiang, X.F. Zheng, Y.Y. Wang, Anal. Sci. 32(2016) 951-956. doi: 10.2116/analsci.32.951
Q. Huang, S. Hu, H. Zhang, et al., Analyst 138(2013) 5417-5423. doi: 10.1039/c3an00510k
Q. Huang, H. Zhang, S. Hu, et al., Biosens. Bioelectron. 52(2014) 277-280. doi: 10.1016/j.bios.2013.09.003
S. Nandi, S.K. Bhunia, L. Zeiri, et al., Chem. Eur. J. 23(2017) 963-969. doi: 10.1002/chem.201604787
J. Liu, S. Yang, X. Chen, H. Wang, Curr. Drug Metab. 13(2012) 1046-1056. doi: 10.2174/138920012802850083
K.K.R. Datta, O. Kozak, V. Ranc, et al., Chem. Commun. 50(2014) 10782-10785. doi: 10.1039/C4CC02637C
S. Chaudhary, A. Umar, K.K. Bhasin, S. Singh, J. Biomed. Nanotechnol. 13(2017) 591-637. doi: 10.1166/jbn.2017.2390
F. Du, M. Zhang, X. Li, et al., Nanotechnology 25(2014) 31570231. doi: 10.1007/s12221-014-1648-z
T. Kavitha, J. Kim, S. Jang, D. Kim, I. Kang, Mater. Sci. Eng. C-Mater. 61(2016) 492-498. doi: 10.1016/j.msec.2015.12.070
P. Namdari, B. Negahdari, A. Eatemadi, Biomed. Pharmacother. 87(2017) 209-222. doi: 10.1016/j.biopha.2016.12.108
X. Ren, J. Liu, J. Ren, F. Tang, X. Meng, Nanoscale 7(2015) 19641-19646. doi: 10.1039/C5NR04685H
X. Zhu, G. Wu, N. Lu, X. Yuan, B. Li, J. Hazard. Mater. 324(2017) 272-280. doi: 10.1016/j.jhazmat.2016.10.057
X. Ren, J. Ge, S. Li, et al., J. Biomed. Nanotechnol. 13(2017) 1425-1434.
M.S. Kang, R.K. Singh, T. Kim, J. Kim, K.D. Patel, Acta Biomater. 55(2017) 466-480. doi: 10.1016/j.actbio.2017.03.054
H. Wang, S. Mukherjee, J. Ji, P. Banerjee, Q. Chen, ACS Appl. Mater. Interfaces 9(2017) 18639-18649. doi: 10.1021/acsami.7b06062
L.V. Nair, Y. Nagaoka, T. Maekawa, D. Sakthikumar, R.S. Jayasree, Small 10(2014) 2771-2775. doi: 10.1002/smll.201400418
L. Tan, B. Ma, Q. Zhao, et al., J. Biomed. Nanotechnol. 13(2017) 393-408. doi: 10.1166/jbn.2017.2356
Y. Jia, B. Ma, X. Wei, Z. Qian, Chin. Chem. Lett. 28(2017) 691-702. doi: 10.1016/j.cclet.2017.01.021
W. Liu, J. Yao, J. Jin, J. Ma, K. Masakorala, Arch. Environ. Contam. Toxicol. 69(2015) 506-514. doi: 10.1007/s00244-015-0222-z
X. Sun, X. Jin, W. Pan, et al., J. Nanosci. Nanotechnol. 16(2016) 648-653. doi: 10.1166/jnn.2016.11112
Y. Xiao, L. Liu, Y. Chen, Y. Zeng, M. Liu, Biomed. Res. Int. 2016(2016) 4016402. http://www.ncbi.nlm.nih.gov/pmc/articles/PMC5107864/
H.X. Han, Z. Jing, W. Wu, et al., Nanoscale 9(2017) 12862-12866. doi: 10.1039/C7NR04352J
A. Xiao, C. Wang, J. Chen, R. Guo, Z. Yan, J. Ecotoxicol. Environ. Saf. 133(2016) 211-217. doi: 10.1016/j.ecoenv.2016.07.026
H. Zheng, L.J. Mortensen, S. Ravichandran, K. Bentley, L.A. DeLouise, J. Biomed. Nanotechnol. 13(2017) 155-166. doi: 10.1166/jbn.2017.2337
X. Ren, J. Wei, J. Ren, L. Qiang, F. Tang, Colloid Surf. B 125(2015) 90-95. doi: 10.1016/j.colsurfb.2014.11.007
T. Liu, L. Li, X. Teng, et al., Biomaterials 32(2011) 1657-1668. doi: 10.1016/j.biomaterials.2010.10.035
T. Liu, L. Li, C. Fu, H. Liu, D. Chen, Biomaterials 33(2012) 2399-2407. doi: 10.1016/j.biomaterials.2011.12.008

Figure 1 (a) The TEM images and (b) the fluorescence intensity of CDs and (c) the survival rate of mice after treated with CDs by single inhalation.

Figure 2 Blood biochemical results of the CDs treated mice after 1 day, 7 days and 28 days. These results showed the mean and standard deviation of (a) white blood cells (WBC) (b) alanine aminotransferase (ALT), (c) aspartate aminotransferase (AST), * P < 0.05.

Figure 3 The fluorescence intensity of the lung (a, b), liver (c, d), brain (e, f), and kidney (g, h)of the experiment group at 5 mg/kg dosage.

 扫一扫看文章

扫一扫关注我们
 DownLoad:
 下载:
下载:
