Citation:
Tian Jiarui, Cui Chaojie, Zheng Chao, Qian Weizhong. Mesoporous tubular graphene electrode for high performance supercapacitor[J]. Chinese Chemical Letters,
2018, 29(4): 599-602.
doi:
10.1016/j.cclet.2018.01.027
Mesoporous tubular graphene electrode for high performance supercapacitor
Received Date:
20 November 2017 Accepted Date:
15 January 2018 Revised Date:
10 January 2018 Available Online:
22 April 2018
Abstract:
We report the fabrication of mesoporous tubular graphene (MTG) by a chemical vapor deposition method using MgO@ZnO core-shell structure as the template. The unique bi-directional ions transfer in unstack graphene layers and high mesopore ratio of MTGs allows capacitance reach 15 μF/cm2 at 0.5 A/g, and 11 μF/cm2 at 10 A/g, which is closer to theoretical value (21 μF/cm2) than SWCNTs and DWCNTs at either low or high rate. Meanwhile, MTGs exhibited good structural stability, high surface area (701 m2/g), high conductivity (30 S/cm) and low oxygen ratio (0.7 atom%), allowing excellent SC performance. The 4 V EDLC using MTGs and EMIMBF4 electrolyte exhibited high energy density in wide range of high power density and excellent cycling stability, showing strong potential in EDLC and other electrochemical energy storage systems, in addition, showing significant factor of ion transfer distance for high performance SCs especially operating at high voltage using ionic liquid electrolyte.
Electrochemical energy storage device, such as supercapacitor (SC) and secondary battery, contributed a lot to the clean, sustainable development of human society considering the negative environmental effect of the direct use of fossil fuel in metro city. SC exhibited high power density, fast charge and discharge properties, and ultra-long device life, playing a growing role in start-up, acceleration and bracing of various vehicles [1]. To meet the demands of sustainably increasing the energy density of electric double layer capacitor (EDLC), next-generation electrode should exhibit not only high capacitance value, but also high chemical stability working in the electrolyte with high potential window. Emerging carbon nanomaterials, such as carbon nanotube and grapheme [2, 3], were intensively investigated, owing to their higher specific surface area (SSA), more exohedral surface accessible to ions of electrolyte, better chemical stability. In addition, the morphology of electrode, especially the pores structures, influenced the diffusion of ions and therefore the performances of SCs [4-12]. For instance, ordered carbon nanotubes (CNT) array exhibited better performance than disordered CNT network. Vertically aligned graphene (to the current collector plate) gave a fast charge and discharge performance. 3D graphene performed better than 2D graphene under the compression since the latter is apt to stack with each other. Recently, under the assistance of the 1D porous inorganic substrate, we are able to deposit graphene inside the pores. This method produced a graphene nanofiber (GNF) [13], which have 1D morphology in macroscopic scale, but was still a 2D structure in microscopic scale. Such structure is capable of meeting the requirements of the transfer of electrons along the axial direction and the diffusion of ions cross the radial direction. However, the diameter of this GNF is still 340 nm, maybe still large for the ions of ionic liquids type electrolyte, which ion size is larger than those in aqueous and organic electrolytes [14].
We proposed here, for the first time, the fabrication of small diameter, mesoporous tubular graphene (MTGs) by a substrate assisted-CVD method. The special structure was prepared by the chemical vapor decomposition (CVD) [15] of CH4 over the template of MgO@ZnO core-shell fiber at 950 ℃. It looks like fiber on macroscopic scale, but has unstacked graphene of a high degree of graphitization with average 2 layers on microscopic scale. It allows ions adsorption on carbon surface from both outside and inside of the hollow structure, compared to graphene nanofiber [13] and single-walled carbon nanotubes (SWCNTs), and axial transfer of electron like SWCNTs. It exhibited an SSA of 701 m2/g and mesopore in a large amount, which is higher than double-walled carbon nanotubes (DWCNTs) [16]. Its relatively large diameter of 200-500 nm allowed them free of bundling, but offered the short diffusion distance of ions of electrolyte (1-ethyl-3-methylimidazolium tetrafluoroborate, EMIMBF4). As a result, the capacitance value is 15 μF/cm2 at 0.5 A/g, and 11 μF/cm2 at 10 A/g in 4 V SCs, respectively, higher than those of DWCNTs. Energy density is 55 Wh/kg, higher than that of DWCNTs with SSA of 500-860 m2/g in the present work [16]. In addition, the electrical conductivity of MTGs exhibited several times higher than CNT powder and more excellent than activated carbon (AC), carbidederived carbons (CDC) and zeolite-templated carbon (ZTC), exhibited very small resistance in SCs, showing strong potential in EDLC and other electrochemical energy storage systems.
The synthesis of MTGs consists of four steps (Fig. 1a). First, synthesize ZnO whisker, which has been described in previous literature (Fig. 1b) [17]. Next, ZnO whisker was sheathed by the precursor of MgO (Fig. 1c) [18]. In detail, ZnO whisker was immersed in a solution of 10 mmol/L Mg(NO3)2 at 99 ℃, then 0.2 mol/L NaOH was added to the solution for 40 min to obtain a white precipitate, which was the precursor. Third, synthesize hollow porous MgO fiber and remove ZnO particle, the white precipitate was calcined and reduced by a gaseous mixture (Ar: H2 = 200:50 sccm) at 950 ℃ for 1 h in a tube furnace to ensure the entire remove of ZnO. After that, graphene was in-situ deposited on porous MgO template from CH4 by CVD method (Ar:H2: CH4 = 200:50:80 sccm). At last, MgO particle was totally removed by 1 mol/L hydrochloric acid for 12 h and pure MTGs was obtained. Then followed by water washing and freeze-drying, the dry, fluffy, black MTGs was fabricated.
图 1
图 1
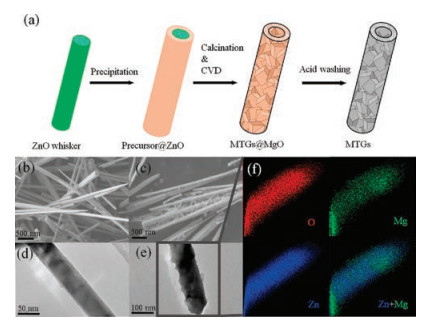
(a) A schematic illustration of MTGs from our synthesis approach. SEM image of ZnO before (b) and after (c) precipitation reaction. TEM image of a ZnO whisker before (d) and after precipitation (e). (f) EDS images of O, Mg and Zn elements of the ZnO whisker after precipitation corresponding to (e), the signal area of Mg is bigger than Zn, and signal density of Mg is lower than O and Zn.
Figure 1.
(a) A schematic illustration of MTGs from our synthesis approach. SEM image of ZnO before (b) and after (c) precipitation reaction. TEM image of a ZnO whisker before (d) and after precipitation (e). (f) EDS images of O, Mg and Zn elements of the ZnO whisker after precipitation corresponding to (e), the signal area of Mg is bigger than Zn, and signal density of Mg is lower than O and Zn.
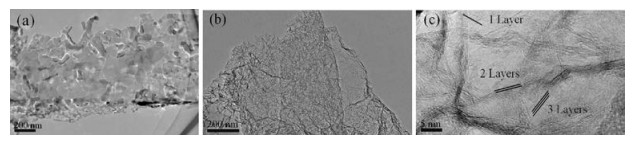
Considering the morphology of graphene depends on the substrate directly, the design of the structure of substrate would be one of the most important factors in the process. Fig. 1a presented our synthesis route. First, ZnO whisker was 1D material and easily prepared, which is the support base to the growth of the 1D material on its external surface. However, ZnO or Zn with high activity is not easy for the growth of thin layer graphene. So MgO layer with inert chemical property and even some basic property was then deposited on the surface of ZnO whisker to form a coaxial tube structure. In the third step, ZnO was reduced by H2 and the Zn species were carried away by gases to left a MgO porous tube. In methane-CVD process, methane is decomposed and carbon deposited on the pores of MgO layer. Finally, the removal of MgO species gave a pure carbon product. In detail, the diameter of ZnO whisker is 50-400 nm, and the length is several microns (Figs. 1b and d). The thickness of the precipitate shell is 20-50 nm (Figs. 1c and e), validated by energy dispersive spectrometer (EDS) (Fig. 1f). After calcination, MgO crystal with the size of 20-30 nm was obtained, which uniformly coated on the external surface of ZnO. The phase composition was observed by XRD (Fig. S1 in Supporting information). Note that, when ZnO whisker was reduced to Zn by H2, its low melting point (419 ℃) and low boiling point (907 ℃) produced a high partial pressure in gases and, therefore, all Zn species can be removed by the treatment in 1 h. The MgO tube is not regular, considering it is stacked with various MgO nanoparticles (Fig. 2a). As further shown in Fig. S2 (Supporting information), the MgO substrate had a length of around 1 micron and a diameter of 150-200 nm. The shell is relative thick under TEM, but the middle is relatively thin, exhibiting a tubular structure. Furthermore, the total removal of MgO by hydrochloric acid after carbon deposition really gave a transparent, tubular graphene structure, shown in Fig. 2b. Graphene layers (mostly 1-5 layers) on MTGs were not paralleled to each other, different from those in carbon nanotube, suggesting it is a new carbon structure (Fig. 2c). In detail, the size of MgO particles is 20-50 nm (Fig. 2a), bigger than the pore size of MTGs (Fig. 2b), suggesting the MTGs experienced the volume shrinkage in the removal of MgO substrate by HCl and during the drying process.
图 2
图 2
TEM image of a hollow MgO fiber (a), pure MTGs (b) and enlarged magnification of TEM image of pure MTGs (c).
Figure 2.
TEM image of a hollow MgO fiber (a), pure MTGs (b) and enlarged magnification of TEM image of pure MTGs (c).
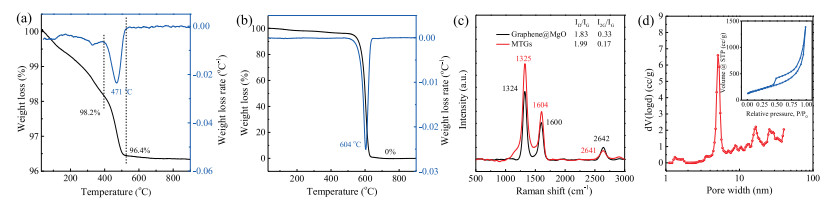
TGA characterization suggested that the burning peak of MTGs@MgO is located at 471 ℃ in oxygen, but the peak is at 604 ℃ for pure MTGs (Figs. 3a and b), confirming the thickening and stacking of graphene layer after MgO template remove. In addition, the intensity ratio of 2D band (2642 cm-1) to G band (1599 cm-1) in Raman spectra is 0.33 for MTGs@MgO, but decreased to 0.17 for MTGs (Fig. 3c), in agreement with the TGA result. Intensity ratio of D band (1324 cm-1) to G band is increased from 1.83 for MTGs@MgO to 1.99 for MTGs, suggesting the selfassemble of graphene layer resulted in the formation of some defective edge after acid washing and freeze drying. Even though, the 2D peak position (2635 cm-1) in Raman still validated that it is a mixture of few layer graphene [19]. XPS characterization reveals that carbon content is 99.2 atom%, and oxygen content is 0.7 atom% (Fig. S3 in Supporting infromation), which is much lower than that of reduced graphene oxide made by Hummers method. Low oxygen content implied the high chemical stability for the use of 4 V electrode discussed below [20-24]. Besides, magnesium content is 0.1 atom%, suggesting HCl is accessible to nearly all MgO species and MgO species were not fully encapsulated by thick carbon layer. In addition, MTGs powder exhibited a conductivity of 30 S/cm under 10 MPa by a four-point probe method, higher than that of DWCNTs and AC.
图 3
图 3
TGA curves of MTGs@MgO (a) and pure MTGs (b). (c) Raman spectra of MTGs@MgO and pure MTGs. (d) DFT pore size distribution and isothermal curve in nitrogen adsorption of MTGs (inset).
Figure 3.
TGA curves of MTGs@MgO (a) and pure MTGs (b). (c) Raman spectra of MTGs@MgO and pure MTGs. (d) DFT pore size distribution and isothermal curve in nitrogen adsorption of MTGs (inset).
Nitrogen adsorption-desorption isotherms indicated that the SSA of MgO in porous MgO template is 14.6 m2/g (Fig. S4 in Supporting infromation). Since the mass ratio of graphene in MTGs@MgO is 1.8% (Fig. 3a), MTGs had surface area of 797 m2/g before removing of MgO. The real value of MTGs after removing MgO and after drying is 701 m2/g (Fig. 3d), suggesting the volume shrinkage did not result in too serious stacking of graphene. The SSA value of MTGs is close to that of DWCNTs [16], much higher than that of MWCNTs and thermally reduced graphene oxide [25, 26].
The pore distribution of MTGs size is shown in Fig. 3d. The pore volume of micropores of 1-2 nm, mesopores of 4-7 nm and 10-40 nm contributed to 0.2%, 11.6% and 88.2%, respectively. Ions transport rely on the size, structure, and distribution of pores in carbon materials [27]. Micropores (1-2 nm) of graphene contribute to the highest capacitance, but limited rate performance owing to low conductivity and high viscosity of ionic liquids. Note that there have several wide peaks in the range of 10-40 nm, which may be associated to the cylindrical holes of MgO fiber after the removal of ZnO. Further mercury intrusion test suggested that the MTGs had sufficient macropores in the ranges of 100-4000 nm or even large (Fig. S5 in Supporting infromation). Large amounts of mesopores and macropores in MTGs would guarantee the fast ions transfer, adsorption and desorption in the electric field.
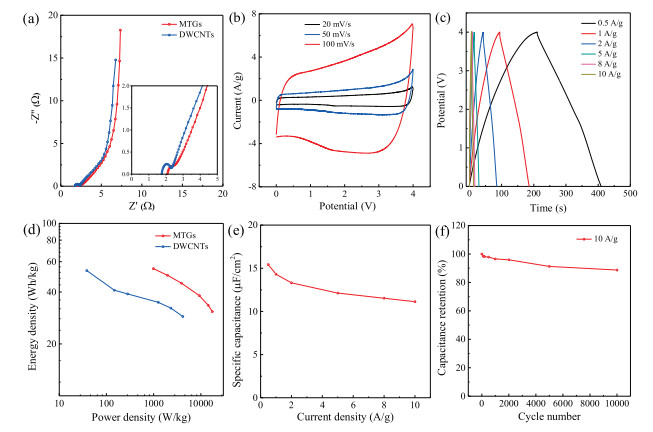
To test the performance of MTGs, methods of AC impedance, cyclic voltammetry (CV) and galvanostatic charge-discharge have been used. Nyquist plot of MTGs (Fig. 4a) shows that the equivalent series resistance (ESR) is 2.1Ω, smaller than the previous graphene nanofibers (2.2Ω) [13], and the large size graphene (3.31Ω) [28], but bigger than DWCNTs (1.8Ω). A miniature semicircle (about 0.25Ω in diameter) in high-frequency region indicated a smaller contact resistance than DWCNTs (0.7Ω). Meanwhile, a vertical curve in low-frequency region suggested high ion-transfer efficiency of hollow porous graphene structure and the SC behaved like an ideal capacitor, indicating that the decay of capacitance at high scanning rate is only owing to high viscosity of EMIMBF4 (48 mPa·s [29], compared to 1 mol/L TEABF4/PC, 2.5 mPa·s). The rectangular shape curves in CV test also approve good capacitive behavior among scan rate from 20 mV/s to 100 mV/s (Fig. 4b). Galvanostatic charge-discharge test showed that discharge times are 408, 185, 85, 30, 17, 13 s for the capacitance of 108, 100, 93, 85, 81, 78 F/g and associated energy density of 55, 50, 46, 38, 34 and 31 Wh/kg, respectively (Figs. 4c and d). The linear potential-time curves exhibited typical capacitive behavior and insignificant redox reaction caused by oxygen functional groups, water and other impurities. To deep understand the relationship between the unique structure of MTGs and their capacitance performance, the capacitance was calculated based on the SSA value of MTGs. For MTGs, the capacitance value is 15 μF/cm2 (Fig. 4e) at 0.5 A/g, close to that of previous GNF [13], but higher than SWCNTs (12-14 μF/cm2) and DWCNTs (14 μF/cm2). The capacitance of MTGs is 11 μF/cm2 at a higher scanning rate of 10 A/g, higher than both graphene nanofibers (10 μF/cm2) and DWCNTs (7.5 μF/cm2). The results indicated that at low scanning rate, capacitance performance is mostly determined by the accessible SSA of the electrode, but the diffusion of ions became the limitation at high scanning rate. Qualitatively, MTGs exhibited the unique bidirectional ions transfer channels, compared to the DWCNTs. Quantitatively, the external diameter of MTG is 200-500 nm, but its core is hollow. Thus it exhibited better diffusion characteristics across the radial direction, as compared to that of GNFs with diameter of 340 nm [13].
图 4
图 4
Nyquist plot (a), CV curves (b), galvanostatic charge-discharge curves (c), and energy density-power density curves (d) of MTGs. (e) Specific capacitance at different current density. (f) Retention of the relative capacitance of MTGs for 5, 000 cycles at current density of 10 A/g.
Figure 4.
Nyquist plot (a), CV curves (b), galvanostatic charge-discharge curves (c), and energy density-power density curves (d) of MTGs. (e) Specific capacitance at different current density. (f) Retention of the relative capacitance of MTGs for 5, 000 cycles at current density of 10 A/g.
In addition, we also performed a cycle test for analyzing the stability of MTGs in high voltage (4 V) SCs. The current density was set to 10 A/g. After 100, 500, 1000, 5000, 10000 cycles, capacitance can be kept by 98.5%, 97.8%, 96.5%, 91.3%, 88.7%, respectively (Fig. 4f). The cycling stability of MTGs is far better than commercial ACs with more oxygen functions. The redox reaction caused by Ni foam with residue water in electrolyte contributed to very insignificant pseudo-capacitance in the present work (Fig. S6 in Supporting infromation). But the effect of Ni foam on the long time repeated charge and discharge cycles should be still cared, as in the previous work [13] and in the present work. Further investigation will be focused on the controlled synthesis of MTGs with much thin layer and much higher surface area to achieve much better capacitance performance.
In summary, MTGs was successfully synthesized by CVD method using MgO@ZnO core-shell structure as the template. The unique bi-directional ions transfer in unstack graphene layers and high mesopore ratio of MTGs allows capacitance reach 15 μF/cm2 at 0.5 A/g, and 11 μF/cm2 at 10 A/g, which is much closer to theoretical value (21 μF/cm2) than SWCNTs and DWCNTs at either low or high rate. Meanwhile, MTGs exhibited good structural stability, high surface area (701 m2/g), high conductivity (30 S/cm) and low oxygen ratio (0.7 atom%), establishing excellent capacitance performance. The 4 V EDLC using MTGs and EMIMBF4 electrolyte exhibited high energy density in a wide range of high power density and excellent cycling stability, showing strong potential in EDLC and other electrochemical energy storage systems.
Acknowledgments
The author is grateful to the financial support of National Key R & D Program of China (No. 2016YFA0200102) and Beijing Municipal Science and Technology Project (No. Z161100002116012). The authors are grateful to the precursor assistance of Dr. Jing Wang and Prof. Lan Xiang.
M. Hahn, A. Würsig, R. Gallay, P. Novák, R. Kötz, Electrochem. Commun. 7(2005) 925-930. doi: 10.1016/j.elecom.2005.06.015
[22]
M. He, K. Fic, F.C. Cedil, et al., Energy Environ. Sci 9(2016) 623-633. doi: 10.1039/C5EE02875B
[23]
T. Qin, Z. Shi, M. Li, C. Wang, J. Solid State Electr. 19(2015) 1437-1446. doi: 10.1007/s10008-015-2767-1
[24]
L. Wei, M. Sevilla, A.B. Fuertes, R. Mokaya, G. Yushin, Adv. Funct. Mater. 22(2012) 827-834. doi: 10.1002/adfm.201101866
[25]
J. Yan, Q. Wang, T. Wei, et al., ACS Nano 8(2014) 4720-4729. doi: 10.1021/nn500497k
[26]
Z. Wu, Y. Sun, Y. Tan, et al., J. Am. Chem. Soc. 134(2012) 19532-19535. doi: 10.1021/ja308676h
[27]
J. Huang, B.G. Sumpter, V. Meunier, Chem.-Eur. J. 14(2008) 6614-6626. doi: 10.1002/chem.v14:22
[28]
C. Liu, Z. Yu, D. Neff, A. Zhamu, B.Z. Jang, Nano Lett. 10(2010) 4863-4868. doi: 10.1021/nl102661q
[29]
S. Zhang, X. Lu, Q. Zhou, et al., Ionic Liquids, 1st ed., Elsevier, Oxford, 2009.
Figure 1
(a) A schematic illustration of MTGs from our synthesis approach. SEM image of ZnO before (b) and after (c) precipitation reaction. TEM image of a ZnO whisker before (d) and after precipitation (e). (f) EDS images of O, Mg and Zn elements of the ZnO whisker after precipitation corresponding to (e), the signal area of Mg is bigger than Zn, and signal density of Mg is lower than O and Zn.
Figure 3
TGA curves of MTGs@MgO (a) and pure MTGs (b). (c) Raman spectra of MTGs@MgO and pure MTGs. (d) DFT pore size distribution and isothermal curve in nitrogen adsorption of MTGs (inset).
Figure 4
Nyquist plot (a), CV curves (b), galvanostatic charge-discharge curves (c), and energy density-power density curves (d) of MTGs. (e) Specific capacitance at different current density. (f) Retention of the relative capacitance of MTGs for 5, 000 cycles at current density of 10 A/g.

 下载:
下载:

 下载:
下载:


