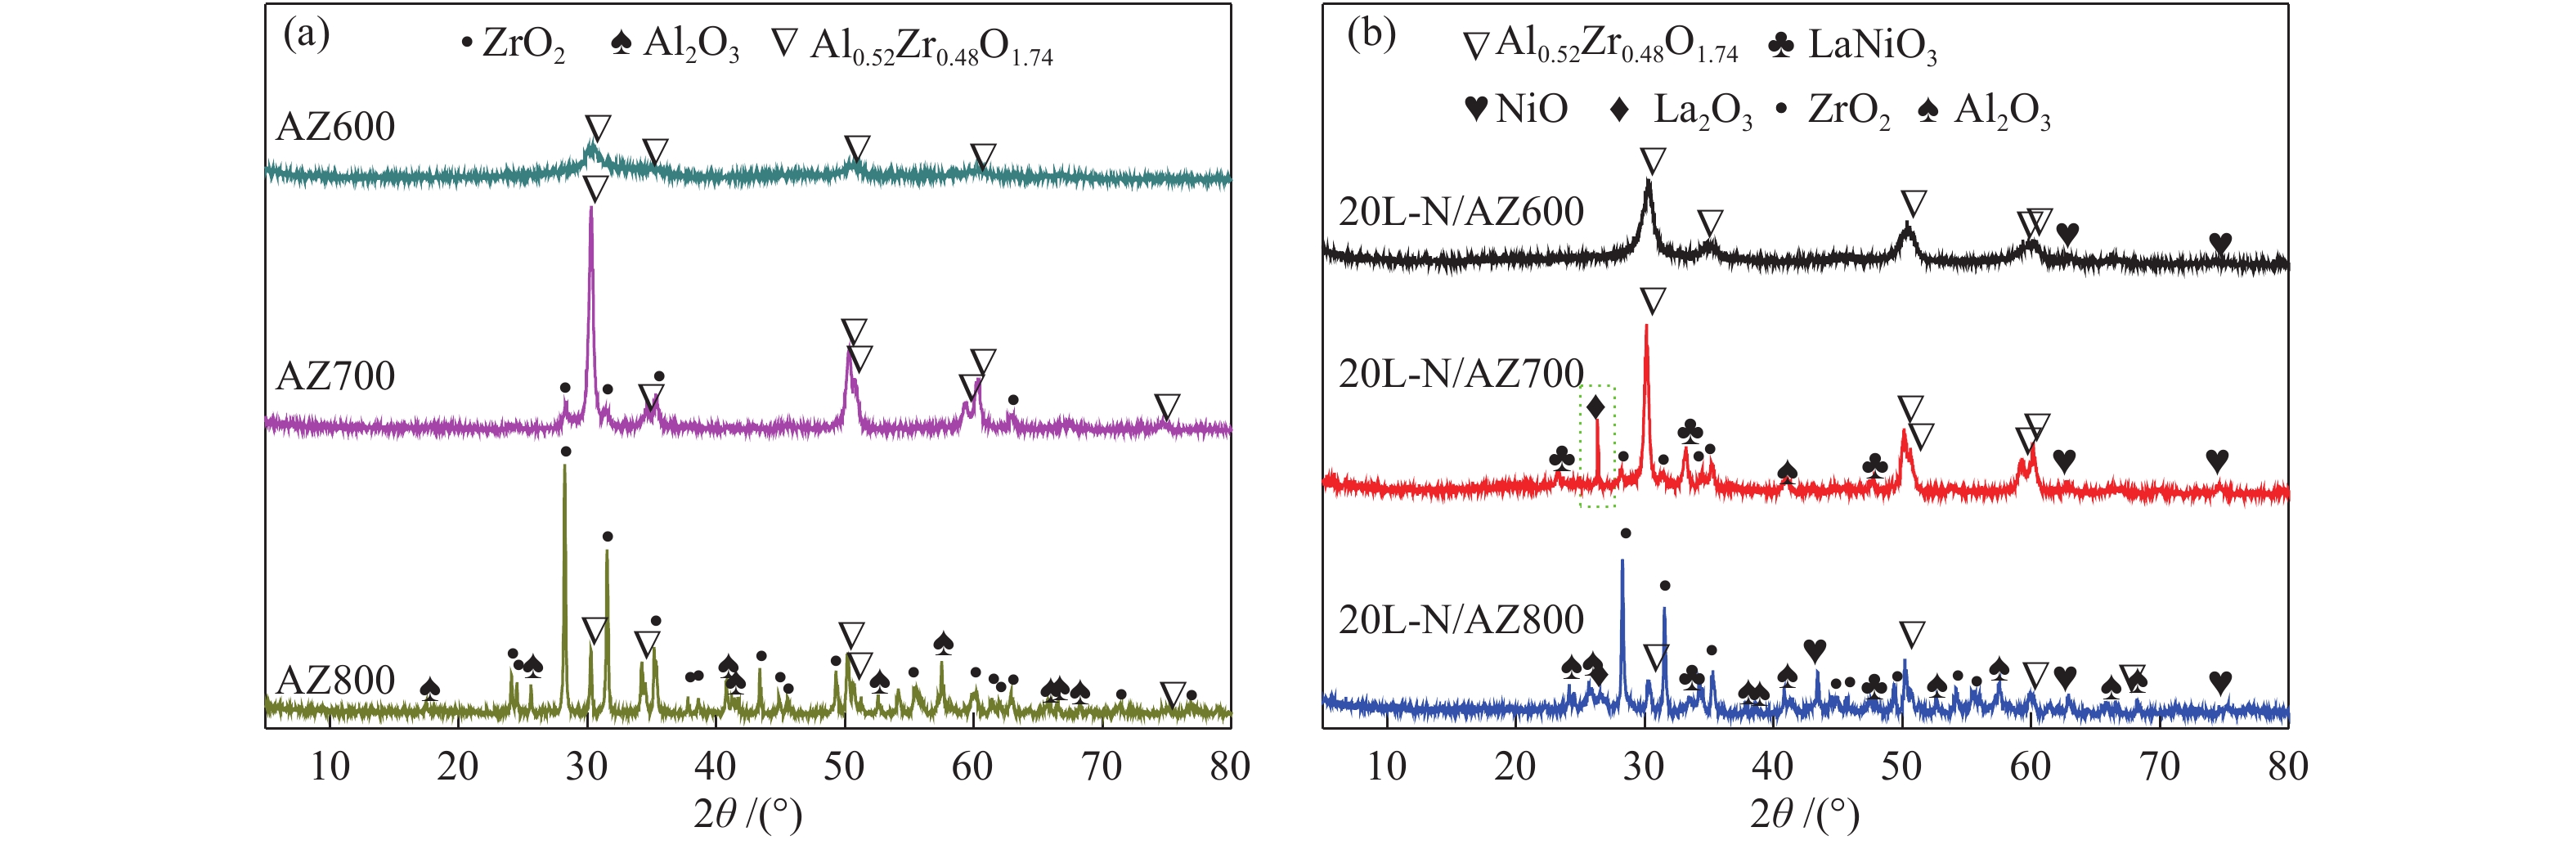
Figure 1.
XRD patterns of: (a) supports of AZx and (b) catalysts of 20L-N/AZx
Formation of perovskite-type LaNiO3 on La-Ni/Al2O3-ZrO2 catalysts and their performance for CO methanation
Hong-wei WANG , Jun-xia WU , Xiao-yan WANG , Hong WANG , Jin-rong LIU

Coal to synthesis natural gas (SNG) process has attracted increasing attention because of its potential to improve energy efficiency and ensure energy security[1, 2]. The reaction efficiency of CO methanation, the key technology for coal to natural gas, is greatly influenced by the catalyst. Significant efforts have been concentrated on the development of the catalysts for CO methanation such as Ni[3-5], Co[6], Ru[7, 8], Rh[9, 10] and Pd[11] based catalysts. Among them, Ni-based catalysts presented superiority due to their relatively high methanation activity and low price[2]. As a consequence, Ni-based methanation catalysts have been applied industrially. However, the critical issues such as carbon deposition and metal sintering of the catalysts still need to be addressed because of the strongly exothermic of CO methanation reaction[3,12].
In order to enhance the anti-sintering and carbon deposition resistance of the Ni-based catalysts, various studied have been reported on the effect of preparation method[12-15], catalyst morphology[16], second-metal doping[17-19], support[7, 20] and surface oxygen vacancy[21, 22]. To our knowledge, there is still plenty of room and opportunity for further improvements.
LaNiO3 has been used as the precursors for preparing Ni-based catalysts, which result in highly dispersed Ni nanoparticles (NPs) after reduction. The additional La2O3 surrounded on the Ni NPs can not only effectively improve the thermal stability, but also play a role in preventing carbon deposition[23, 24]. The current studies on the LaNiO3 mainly focus on CO2 reforming[25], ethanol steam reforming[26], and CO2 methanation[27]. We have exploratively prepared the La1−xCexNiO3/SiO2 catalysts for CO methanation, which exhibited satisfied catalytic activity and strong anti-carbon deposition and anti-sintering ability. In details, in the La1−xCexNiO3 nanocluster, Ni, La and Ce ions are uniformly mixed at the atomic level. Moreover, Ni0 NPs are in close contact with La2O3 and CeO2 and highly dispersed on SiO2[16].
However, the inherent specific surface area of LaNiO3 is rather small which inhibit its catalytic activity. Hence, catalysts with LaNiO3 loading on supports with large specific surface area is developed. Many supports have been adopted for CO methanation catalysts such as Al2O3[7, 17,18], SiO2[12,13,16,22], ZrO2[23, 28], CeO2[29] and TiO2[8]. Among them, Al2O3 has been industrially applied in the CO methanation catalyst[30]. However, it inclines to interact with NiO and further destroy the structure of LaNiO3. Moreover, its surface acidity is apt to cause carbon deposition. ZrO2 is a typical support with CO adsorption site i.e. utilizing hydrogen spillover, the adsorbed CO can undergo methanation on its surface[23]. However, ZrO2 is susceptible to crystalline transformation from the tetragonal phase to the monoclinic phase which significantly reduces the catalytic performance.
The Al2O3-ZrO2 composite oxide with large specific surface area and high thermal stability[28,31] has been employed in methanation[28,32], CH4/CO2 reforming[33,34], and ethanol hydrogen production reaction[35]. Researches revealed that ZrO2 inhibits the interactions between Ni and Al2O3, which improve the dispersion of Ni and promotes the reduction of NiO to Ni. As a result, it presented better methanation activity in compared to the NiO/Al2O3 catalyst. Guo et al[31] prepared ZrO2/Al2O3 supports and NiO/ZrO2/Al2O3 catalysts with different ZrO2 contents via impregnation method. It was found that the addition of ZrO2 can inhibit the formation of NiAl2O4 and weaken the interaction between Ni and Al2O3 to make NiO easier to reduce.
In this paper, the Al2O3-ZrO2 composite oxide support was prepared by hydrolysis-neutralization precipitation method, while the La-Ni/Al2O3-ZrO2 catalyst was prepared by citric acid complexation method. The catalyst structure was adjusted by varying the La-Ni loading and the calcination temperature of the supports. The formation of perovskite LaNiO3 precursor and the structural evolution after reduction was analyzed by a series of characterizations. The catalytic performance for CO methanation was evaluated on a fixed-bed reactor. The relationship between the catalyst structure and reaction performance was discussed. Formation of precursor LaNiO3 and the structural evolution after reduction was also analysed. Our aim is to analyze the cause of the good activity and stability of the La-Ni/Al2O3-ZrO2 catalyst through the formation and reduction of the precursor LaNiO3, so that measures should be taken to suppress the sintering and carbon deposition of the catalyst.
The Al2O3-ZrO2 support was prepared via precipitation method using P123 as template and denoted as AZx, where x represents the calcination temperature.
La-Ni/Al2O3-ZrO2 catalysts were prepared by citric acid complex impregnation method, and the typical process was as follows[26]. Firstly, the nickel nitrates and lanthanum nitrates were dissolved in deionized water (the molar ratio of La: Ni is equal to 1), followed by the addition of citric acid monohydrate and ethylene glycol with the molar ratio of the Ni2+ : La3+ : C6H8O7 : C2H6O2 = 0.5 ∶ 0.5 ∶ 1.2 ∶ 0.48 under stirring. Then 1.0 g of AZx powder was added into the above solution and kept stirring until the mixture became viscous. The viscous fluid was evaporated at 80 °C for 6 h and then 120 °C for 12 h. The obtained product was further calcined at 350 °C for 2 h and 700 °C for 5 h in the air with a heating rate of 1 °C/min. The as-prepared catalysts were denoted as yL-N/AZx, where L-N represents LaNiO3, y was the content of LaNiO3(y %,). Here, y = 10, 20, 30 and 40.
Powder X-ray diffraction (XRD) patterns were collected using a D8 Advance X-ray diffractometer (Bruker) with Cu Kα radiation of wavelength λ= 0.15406 nm at 40 kV and 100 mA.
Hydrogen temperature programmed reduction (H2-TPR) was carried out on PX200 (Tianjin Pengxiang Technology Co., Ltd) catalyst characterization system. 100 mg of fresh sample was pre-treated in high purity nitrogen at 200 °C for 2 h to remove the adsorbed moisture and impurities. The sample was then exposed to 10% of H2/N2 (50 mL/min) and the temperature was raised with a ramp of 10 °C/min.
The surface chemical composition was analyzed using X-ray photoelectron spectroscopy (XPS) (ESCLAB-250Xi, Thermo Fisher Scientific, USA), which performed in an ultra-high vacuum chamber with base pressure of 2 × 10⁻⁷ Pa. Samples were prepared by adhering powders to carbon substrates, and all peaks were energy-calibrated relative to the C 1s peak of adventitious carbon at 284.6 eV.
Nitrogen adsorption measurements were performed at liquid nitrogen temperature on a JW-BK112 analyzer. The samples were evacuated at 200 °C for 6 h prior to the measurements. The specific surface area and pore size distribution were calculated using the Brunauer-Emmett-Teller (BET) and Barrett-Joyner-Halenda (BJH) methods, respectively.
TEM images were taken on a JEM-2100F instrument with an acceleration voltage of 200 kV. The powder sample was dispersed in ethanol by an ultrasonic bath and a drop of the obtained suspension was dripped onto the copper grid for characterization.
In a typical catalytic test, 200 mg catalyst (40 mesh) was loaded in a fixed-bed reactor (The diameter is 8 mm and the length is 350 mm), a flow of syngas (CO/H2/Ar = 18%/54%/28%, 50 mL/min) was admitted to the reactor at a weight hourly space velocity (WHSV) of 15000 mL/(g·h) and the reaction pressure was 0.1 MPa. Prior to the activity test, the catalyst was reduced at 600 °C for 2 h in a continuous flow of pure H2 (50 mL/min) and then cooled down to room temperature followed by switch to syngas. The reaction was performed in a temperature range of 300−600 °C using an interval of 50 °C (10 °C/min). At each stage, the temperature is kept for one hour to detect the product components.
After passing through a cold trap for water condensation, the outlet stream was analyzed on-line by a SP-2100 (BeiJing Huarui Tech. Co. Ltd.) gas chromatograph equipped with a thermal conductivity detectors (TCD) and Carbo-sphere columns (TDX-01) using Ar as a carrier gas (20 mL/min). Since no C2+ hydrocarbons were detected. Stability test was conducted at 500 °C, 0.1 MPa, and 15000 mL/(g·h) for 100 h.
No C2+ signal was detected and CO2 was the only by-product. Take 20L-N/AZ700 catalyst as an example, the C balances was 98.1% (the amount of carbon deposition for the spent catalyst was about 1.3% estimated by TG.
The CO conversion, CH4 selectivity, and CH4 yield were calculated as follows:
|
|
(1) |
|
|
(2) |
where
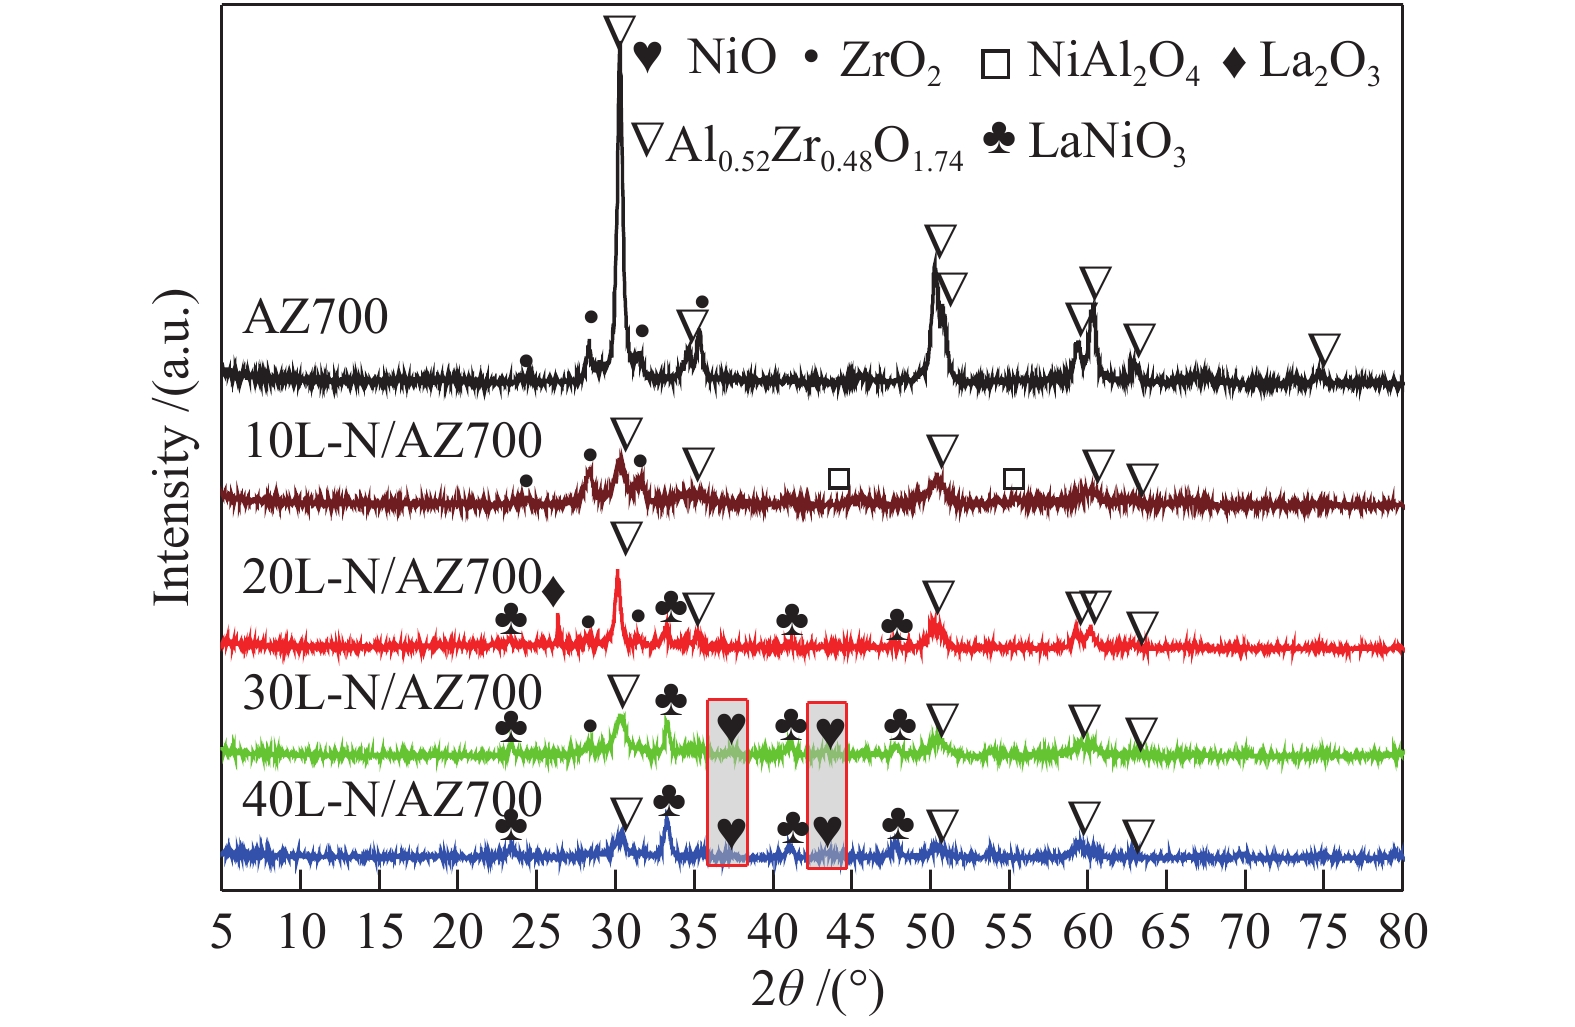
The XRD patterns of AZx supports with different calcination temperatures are shown in Figure 1(a). The peaks at 30.7°, 50.3°, 60.3°, and 74.7° correspond to the (101), (112), (211) and (220) planes of Al0.52Zr0.48O1.74. The diffraction peaks of Al0.52Zr0.48O1.74 on AZ600 are much lower than that of AZ700 and AZ800, which means the poor crystallinity at the calcination temperature of 600 °C. The AZ700 show the diffraction peaks of Al0.52Zr0.48O1.74 and ZrO2, indicating the formation of a homogeneous solid solution. In contrast, the diffraction peaks of Al2O3 and ZrO2 appear in AZ800, suggesting that the Al0.52Zr0.48O1.74 further transform to Al2O3 and ZrO2 when increasing the calcination temperature to 800 °C.
The XRD patterns of the 20L-N/AZx catalysts are shown in Figure 1(b). The diffraction peaks of 20L-N/AZ700 and 20L-N/AZ800 located at 23.26°, 33.14°, 41.3° and 47.4° are contributed to the existence of the LaNiO3. Moreover, the intensity of LaNiO3 diffraction peaks in the 20L-N/AZ800 is weaker than that of 20L-N/AZ700 catalyst which reveals that the homogeneous Al0.52Zr0.48O1.74 supports enable a better formation of Perovskite-type oxides (PTO) structure. Small reflections attributed to NiO phased are also observed, which indicate that partially Ni exist as NiO outside the perovskite structure. The XRD pattern of 20L-N/AZ700 catalyst also show the diffraction peak of La2O3 at 26.33° which is not observed for the 20L-N/AZ600 and 20L-N/AZ800 samples.
It's worth noting that this peak is found in every duplicate detection, thus the instrument errors can be excluded. A possible explanation is that the AZ700 prefers to form composite LaNiO3 phase than separated phase. Therefore, a complex oxide phase with K2NiF4 type structure may form which consists of alternating perovskite (ABO3) and rock salt (AO) structure under the appropriate La-Ni content. Compared with the ABO3, this K2NiF4 type structure presents higher crystallinity, as shown in Figure 1.
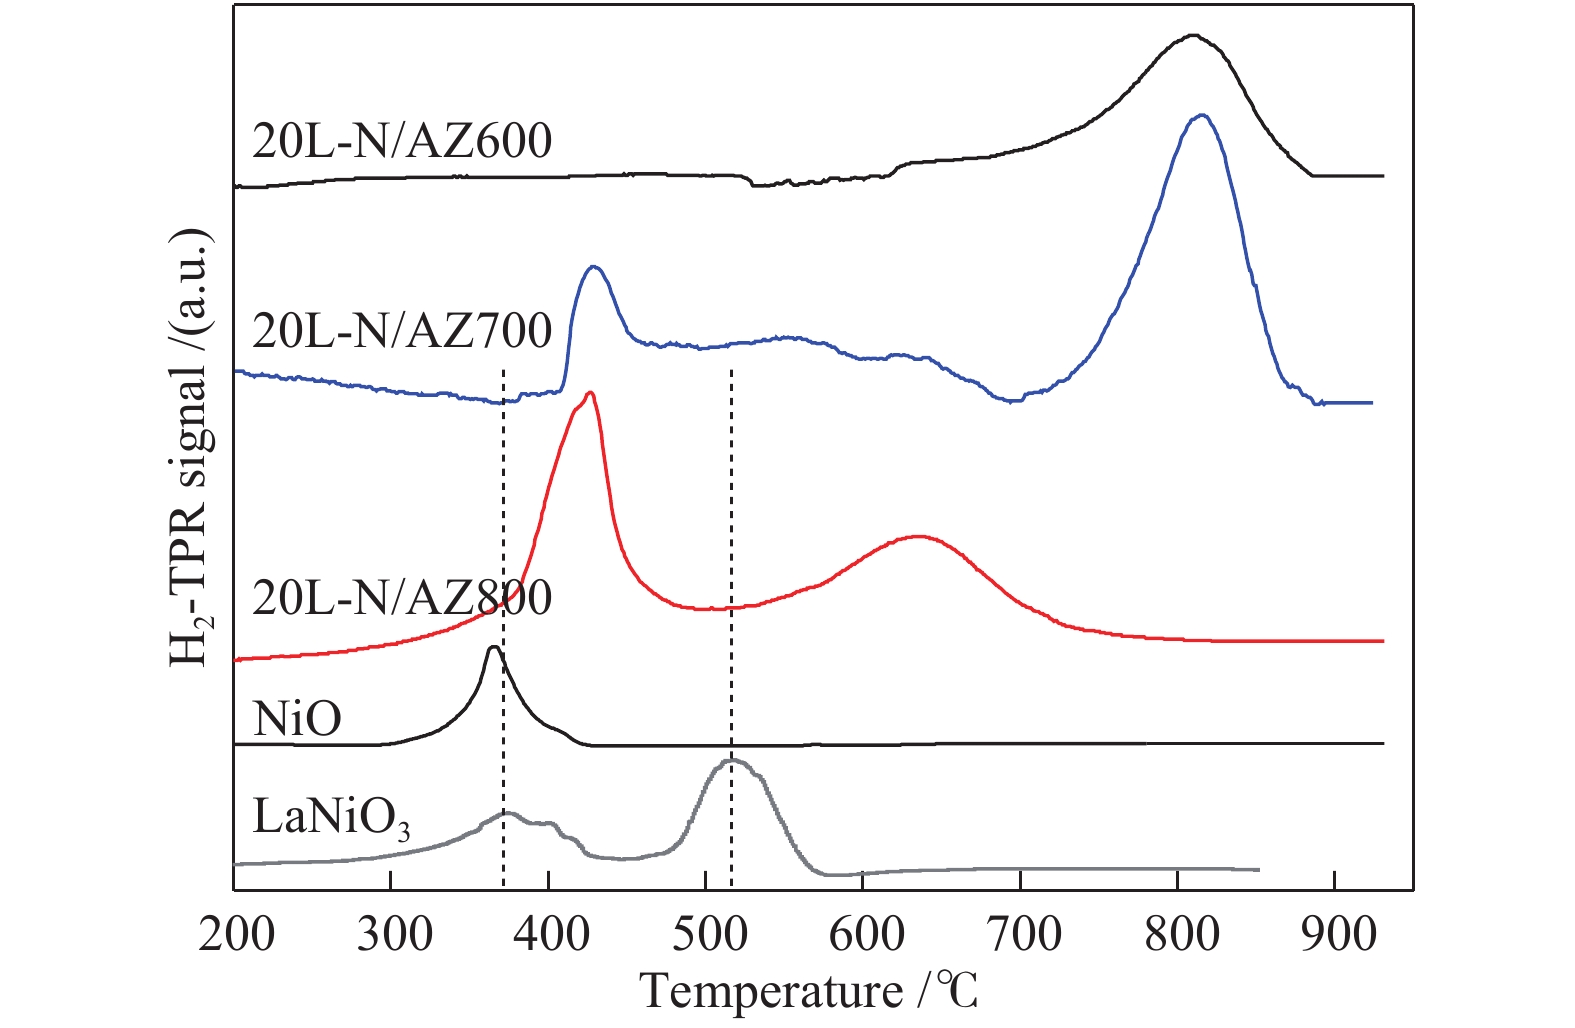
The H2-TPR profiles of 20L-N/AZx catalysts are depicted in Figure 2. Obviously, the degree of reducibility and reduction type of active components for different samples are significant difference. According to literature reports[36], the reduction of pure LaNiO3 is carried out in two steps and results in two reduction peaks[12]:
|
|
(3) |
|
|
(4) |
The reaction temperature of steps (3) and (4) are 375 and 510 °C, respectively. While the reduction peak at 800 °C is attributed to NiAl2O4. For 20L-N/AZ600, only single reduction peaks at 800 °C is observed, which indicate that the Ni is mostly exist as NiAl2O4. As for 20L-N/AZ700, besides the peak of NiAl2O4, another two peaks are observed. The first peak at 430 °C is contributed to the reduction of Ni3+ to Ni2+, and the second peak at widely range of 500−700 °C is corresponding to the reduction of Ni2+ to Ni0.
For 20L-N/AZ800, two main reduction peaks appear at around 430 and 640 °C. Theoretically, the amount of hydrogen consumption in step (4) is twice as much as that in step (3). However, the area of the first reduction peak of 20L-N/AZ800 is similar to the second reduction peak, which means that the first reduction peak contains the reduction peak of NiO which is weakly interacted with the supports. It is worth noting that there is no reduction peak for NiAl2O4 of the 20L-N/AZ800, which means that the ZrO2 in the support AZ800 inhibited the formation of the NiAl2O4, which was consistent with the previous literatures[32].
The influence of the calcination temperature of the supports on the methanation reaction of the 20L-N/AZ catalyst is shown in Figure 3. It is observed that the 20L-N/AZ600 catalyst has low CO conversion in the reaction temperature range of 300−600 °C. It is noted that the CH4 selectivity are poor due to the formation of high carbon organics or severe carbon deposition. The CO conversion and CH4 yield of 20L-N/AZ700 and 20L-N/AZ800 catalysts displayed similar variation trend. The CO conversion over the 20L-N/AZ800 is better than that of 20L-N/AZ700 when the reaction temperature is lower than 400 °C. With the further raising of methanation temperature to 400 °C, the CO conversion of 20L-N/AZ700 reach 100%. The CH4 selectivity of 20L-N/AZ700 remain 72% even at 600 °C, while the highest CH4 selectivity of 20L-N/AZ800 is only 62% (at 450 °C) in the whole reaction temperature range.
In detail, combined with the results of XRD, it can be seen that the support AZ800 undergone significant phase separation from Al0.52Zr0.48O1.74 to Al2O3 and ZrO2 during calcination at 800 °C (Figure 1(a)). Diffraction peaks of NiO are found on 20L-N/AZ800 catalyst(Figure 1(b)), and the diffraction peak of LaNiO3 is significantly weaker than 20L-N/AZ700. Moreover, H2-TPR results show that the content of the low-temperature reducible nickel in catalyst 20L-N/AZ800 is higher than that in 20L-N/AZ700, indicating that Ni has an interaction with the separated Al2O3, and the existence of Al2O3 will hinder the formation of LaNiO3. In contrast, more LaNiO3 is formed on 20L-N/AZ700 with better high temperature catalytic performance. In conclusion, the low-temperature performance is related to the NiO species while the high temperature performance is related to the LaNiO3. AZ700 seems to be the optimal catalyst support with the best performance compared with other supports calcinated at different temperatures. The formation of homogeneous solid solution of Al0.52Zr0.48O1.74 will facilitate the gelation of the perovskite structure of LaNiO3, which is benefit for the high catalytic activity.
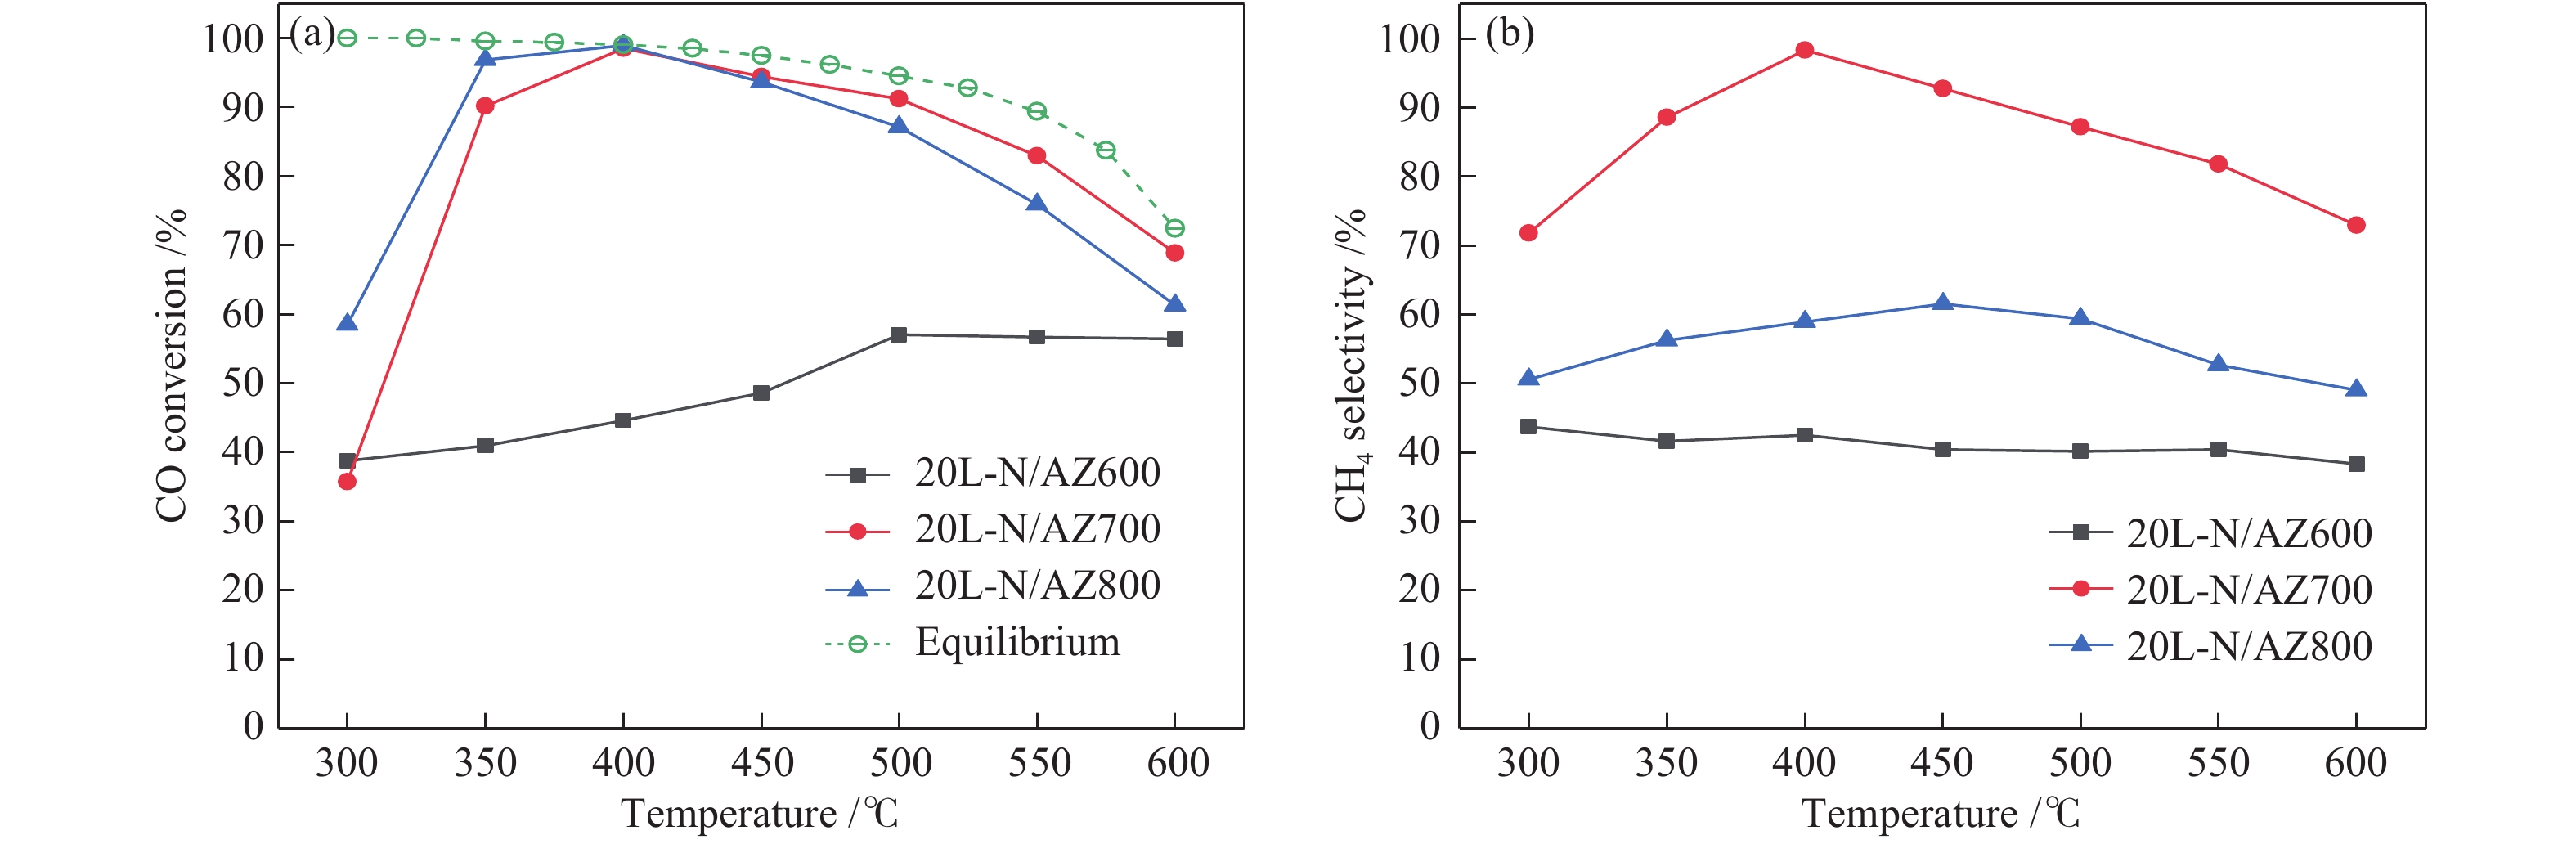
reaction conditions: p = 0.1 MPa, GHSV = 15000 mL/(g·h)
In order to better explain the effect of the formation of LaNiO3 on the high temperature performance of the catalyst, catalysts with different La-Ni loading are prepared by using AZ700 as support.
Figure 4 shows the XRD patterns of yLa-Ni/AZ700 catalysts with different La-Ni loading. Diffraction peaks assigned to LaNiO3 are detected at 23.3°, 33.2°, 44.1°, 47.7°, 53.9°, 59.6°, 69.9° and 79.4° whose intensity increase with the increase of La-Ni loading. In addition, the diffraction peak intensity of the supports sharply decrease after loading of active composites, indicating that the active component was successfully loaded onto the supports. It is important to note that the diffraction peaks of NiAl2O4 phases were only observed in the 10L-N/AZ700 catalyst. It may because that the formation of NiAl2O4 was inhibited by La2O3 with the increase of La-Ni loading. Weak diffraction peaks of NiO appear in the catalysts of 30L-N/AZ700 and 40L-N/AZ700, suggesting that not all active components form the LaNiO3. With the increase of La-Ni content, the diffraction peaks of La2O3 do not appear for 30L-N/AZ700 and 40L-N/AZ700.
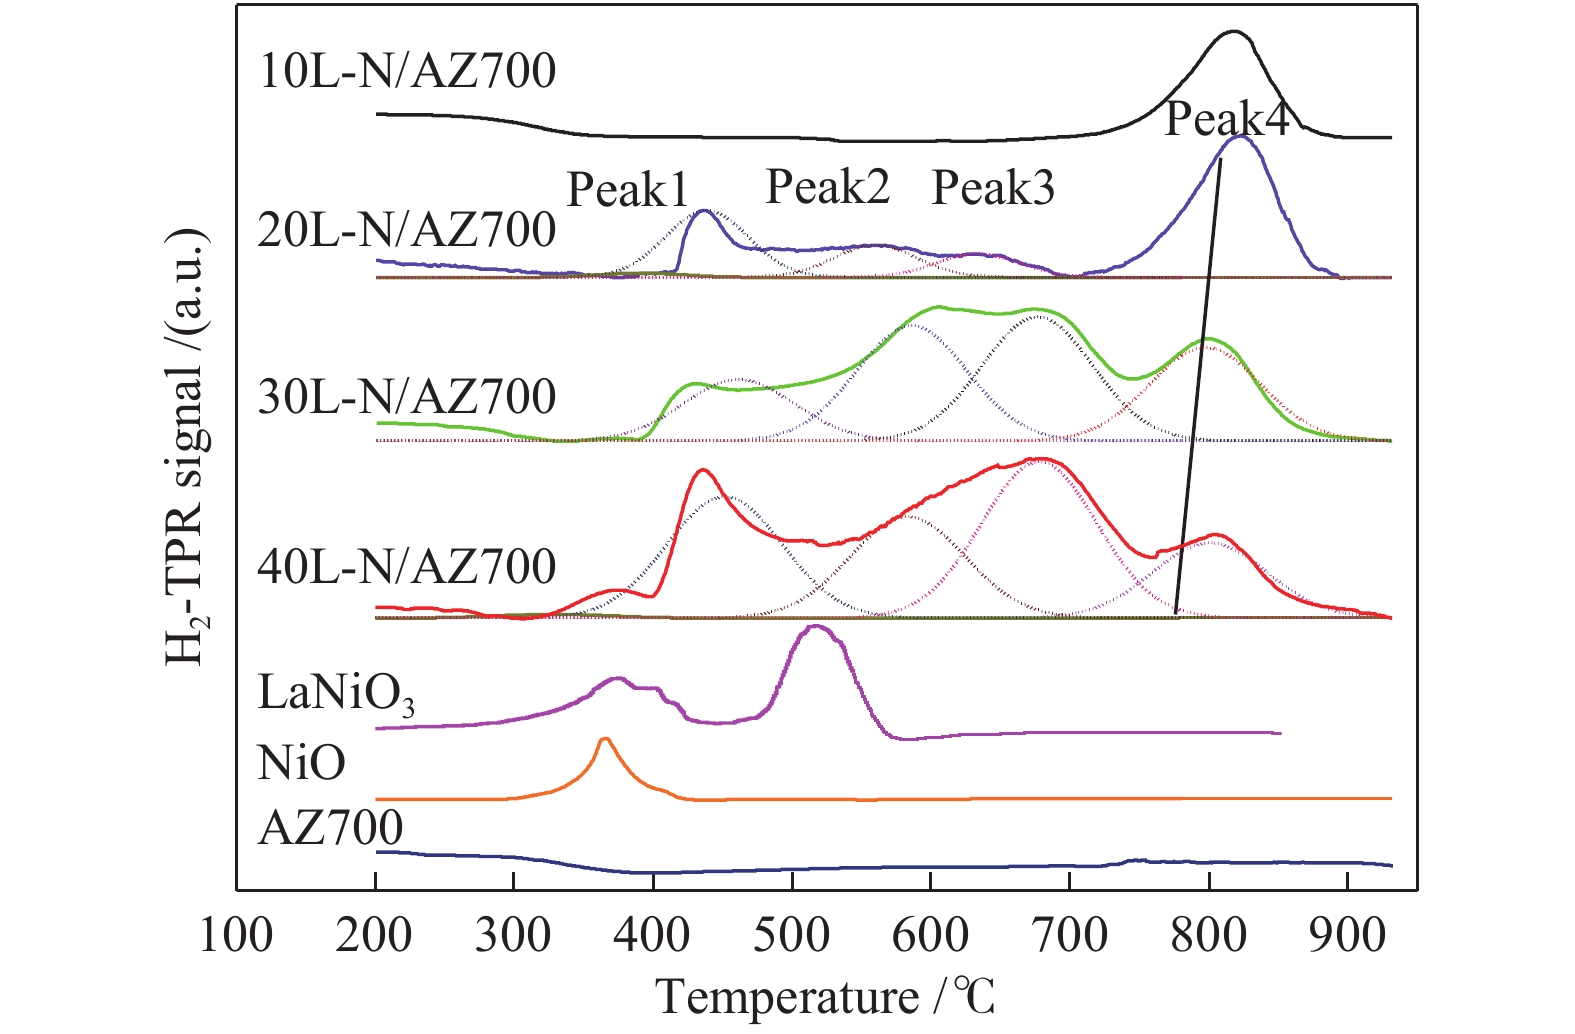
Figure 5 presents the H2-TPR profiles of the yL-N/AZ700 catalysts and Table 1 shows the percentage of each reduction peak area after the peak-fitting of the H2-TPR curve. All catalysts display the NiAl2O4 reduction peak at 800 °C (peak4). With the increase of La-Ni loading, the reduction peak of NiAl2O4 shift to lower temperatures and the peak area decrease significantly due to less formed NiAl2O4 with the increase of La species.
 下载:
导出CSV
下载:
导出CSV
| Sample | SBET a/(m2·g−1) | Pore size a/nm | Pore volume a/(cm3·g−1) | Nib/% | The proportion of the reduction peaks c/% | |||
| peak1 | peak2 | peak3 | peak4 | |||||
| AZ700 | 55.8 | 16.8 | 0.614 | − | − | − | − | − |
| 10L-N/AZ700 | 81.9 | 11.2 | 0.412 | 1.3 | − | − | − | 100 |
| 20L-N/AZ700 | 72.8 | 12.0 | 0.387 | 2.74 | 25.3 | 12.1 | 8.9 | 53.7 |
| 30L-N/AZ700 | 68.1 | 10.6 | 0.296 | 1.96 | 15.6 | 29.2 | 31.5 | 23.7 |
| 40LN/AZ700 | 38.0 | 13.0 | 0.270 | 5.16 | 31.6 | 16.6 | 34.0 | 17.8 |
| a: specific surface area of the supports and as-prepared samples were calculated using Brumauer-Emmett-Teller (BET) modeling;
b: surface nickel atom fraction determined by XPS; c: the proportion of the different reduction peaks areas through H2-TPR |
||||||||
The reduction peaks at low-temperature range of 380−450 °C (peak1) are attributed to the free nickel oxide phase which have weak interaction with the support. The 30L-N/AZ700 catalyst has the lowest hydrogen consumption peak1, and the peak located at 360 °C is observed only for the 40L-N/AZ700. Widely hydrogen-consuming overlapping peaks appear at the range of 500−700 °C except for 10L-N/AZ700. Combined withTable1, the ratio of peak2 to peak1 is close to 2 in catalyst 30L-N/AZ700. It can be seen that catalyst with 30% active components are more likely to form perovskite structure of LaNiO3.
In summary, H2-TPR results show that the La-Ni amount significantly affect the existing state and reducibility of Ni. The increase of La hinder the formation of NiAl2O4, which has been confirmed by the relevant literature[1]. Besides, LaNiO3 can be more easily formed when the La-Ni content is 30%, and the 30L-N/AZ700 catalyst show the best activity and stability at medium and high temperatures.
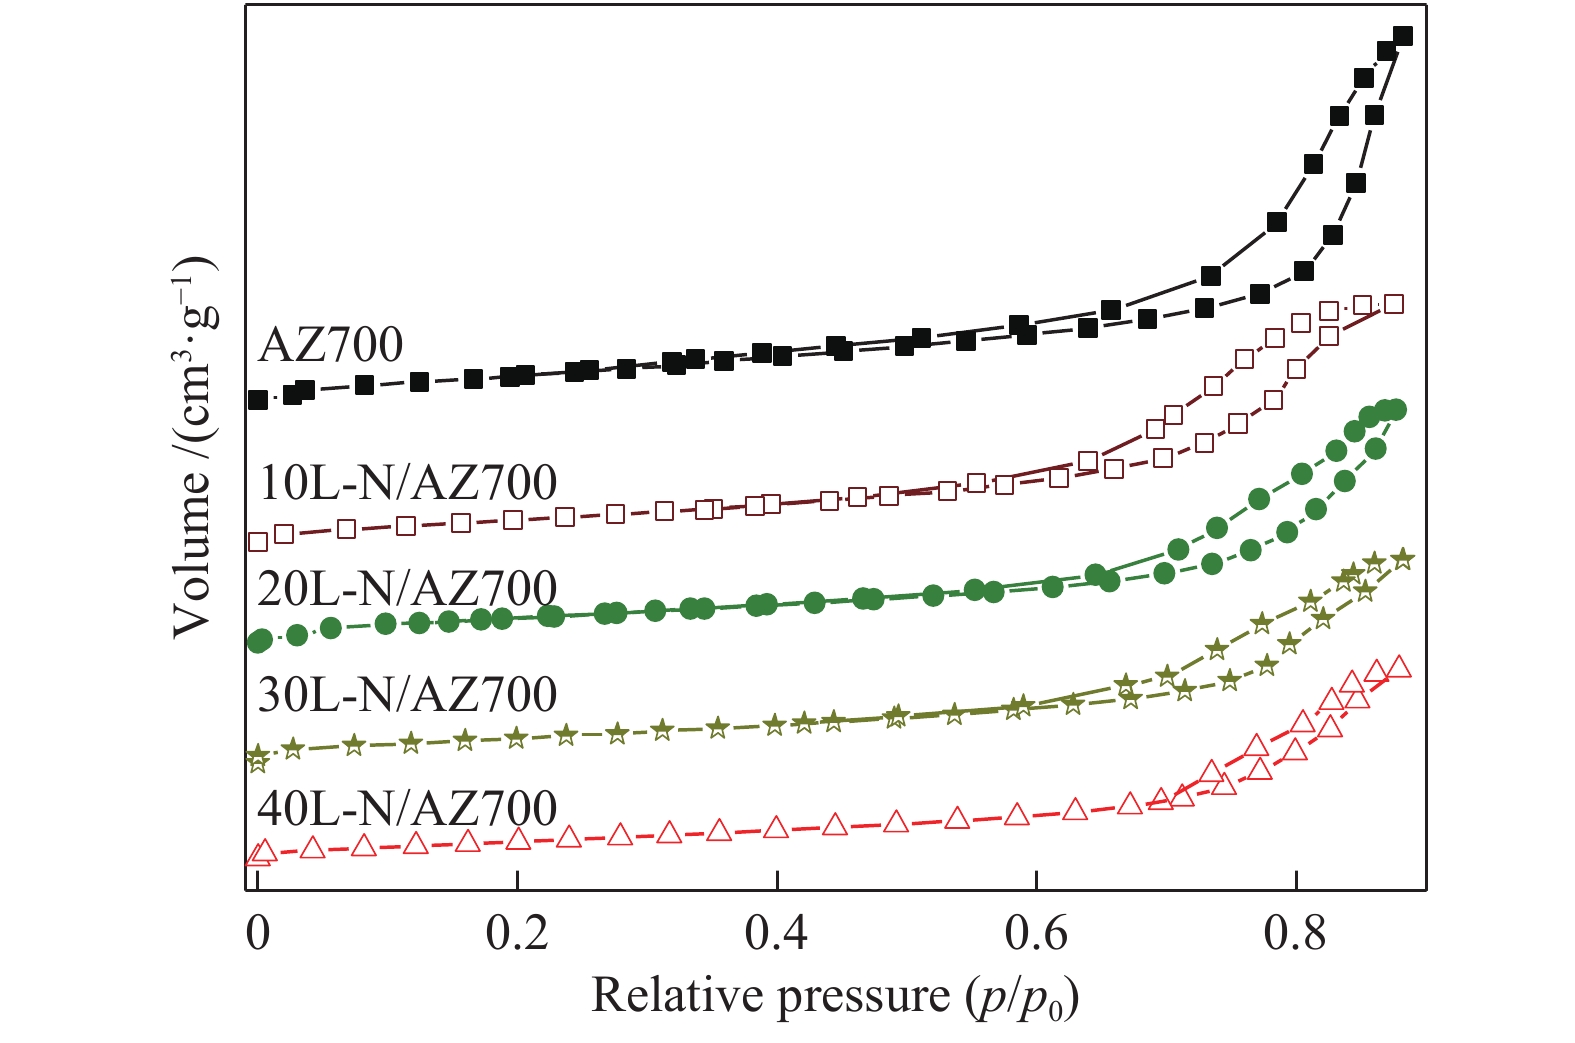
Nitrogen adsorption-desorption isotherms of the samples are shown in Figure 6. Type IV with H1 hysteresis loop are observed for all samples, revealing the mesoporous structure of the AN700 support and the as-prepared yL-N/AZ700 catalysts.
As the La-Ni content increases, the hysteresis ring moves in the direction where the relative pressure and adsorption content decrease significantly. The specific surface area, pore diameter and pore volume parameters are listed in Table 1. Interestingly, the specific surface area of the yL-N/AZ700 is even higher that of AZ700 support. There are probably two main reasons for this phenomenon: (1) The loaded active components exist in the form of “point-surface” on the surface of the support and in the pores, (2) The loaded active components are highly dispersed on the catalyst, which is also confirmed by XRD results (Figure 4). However, when the La-Ni content increase up to 40%, the formation of LaNiO3 and NiO will block part of the pores, thus leading to the sharply decreased specific surface area.
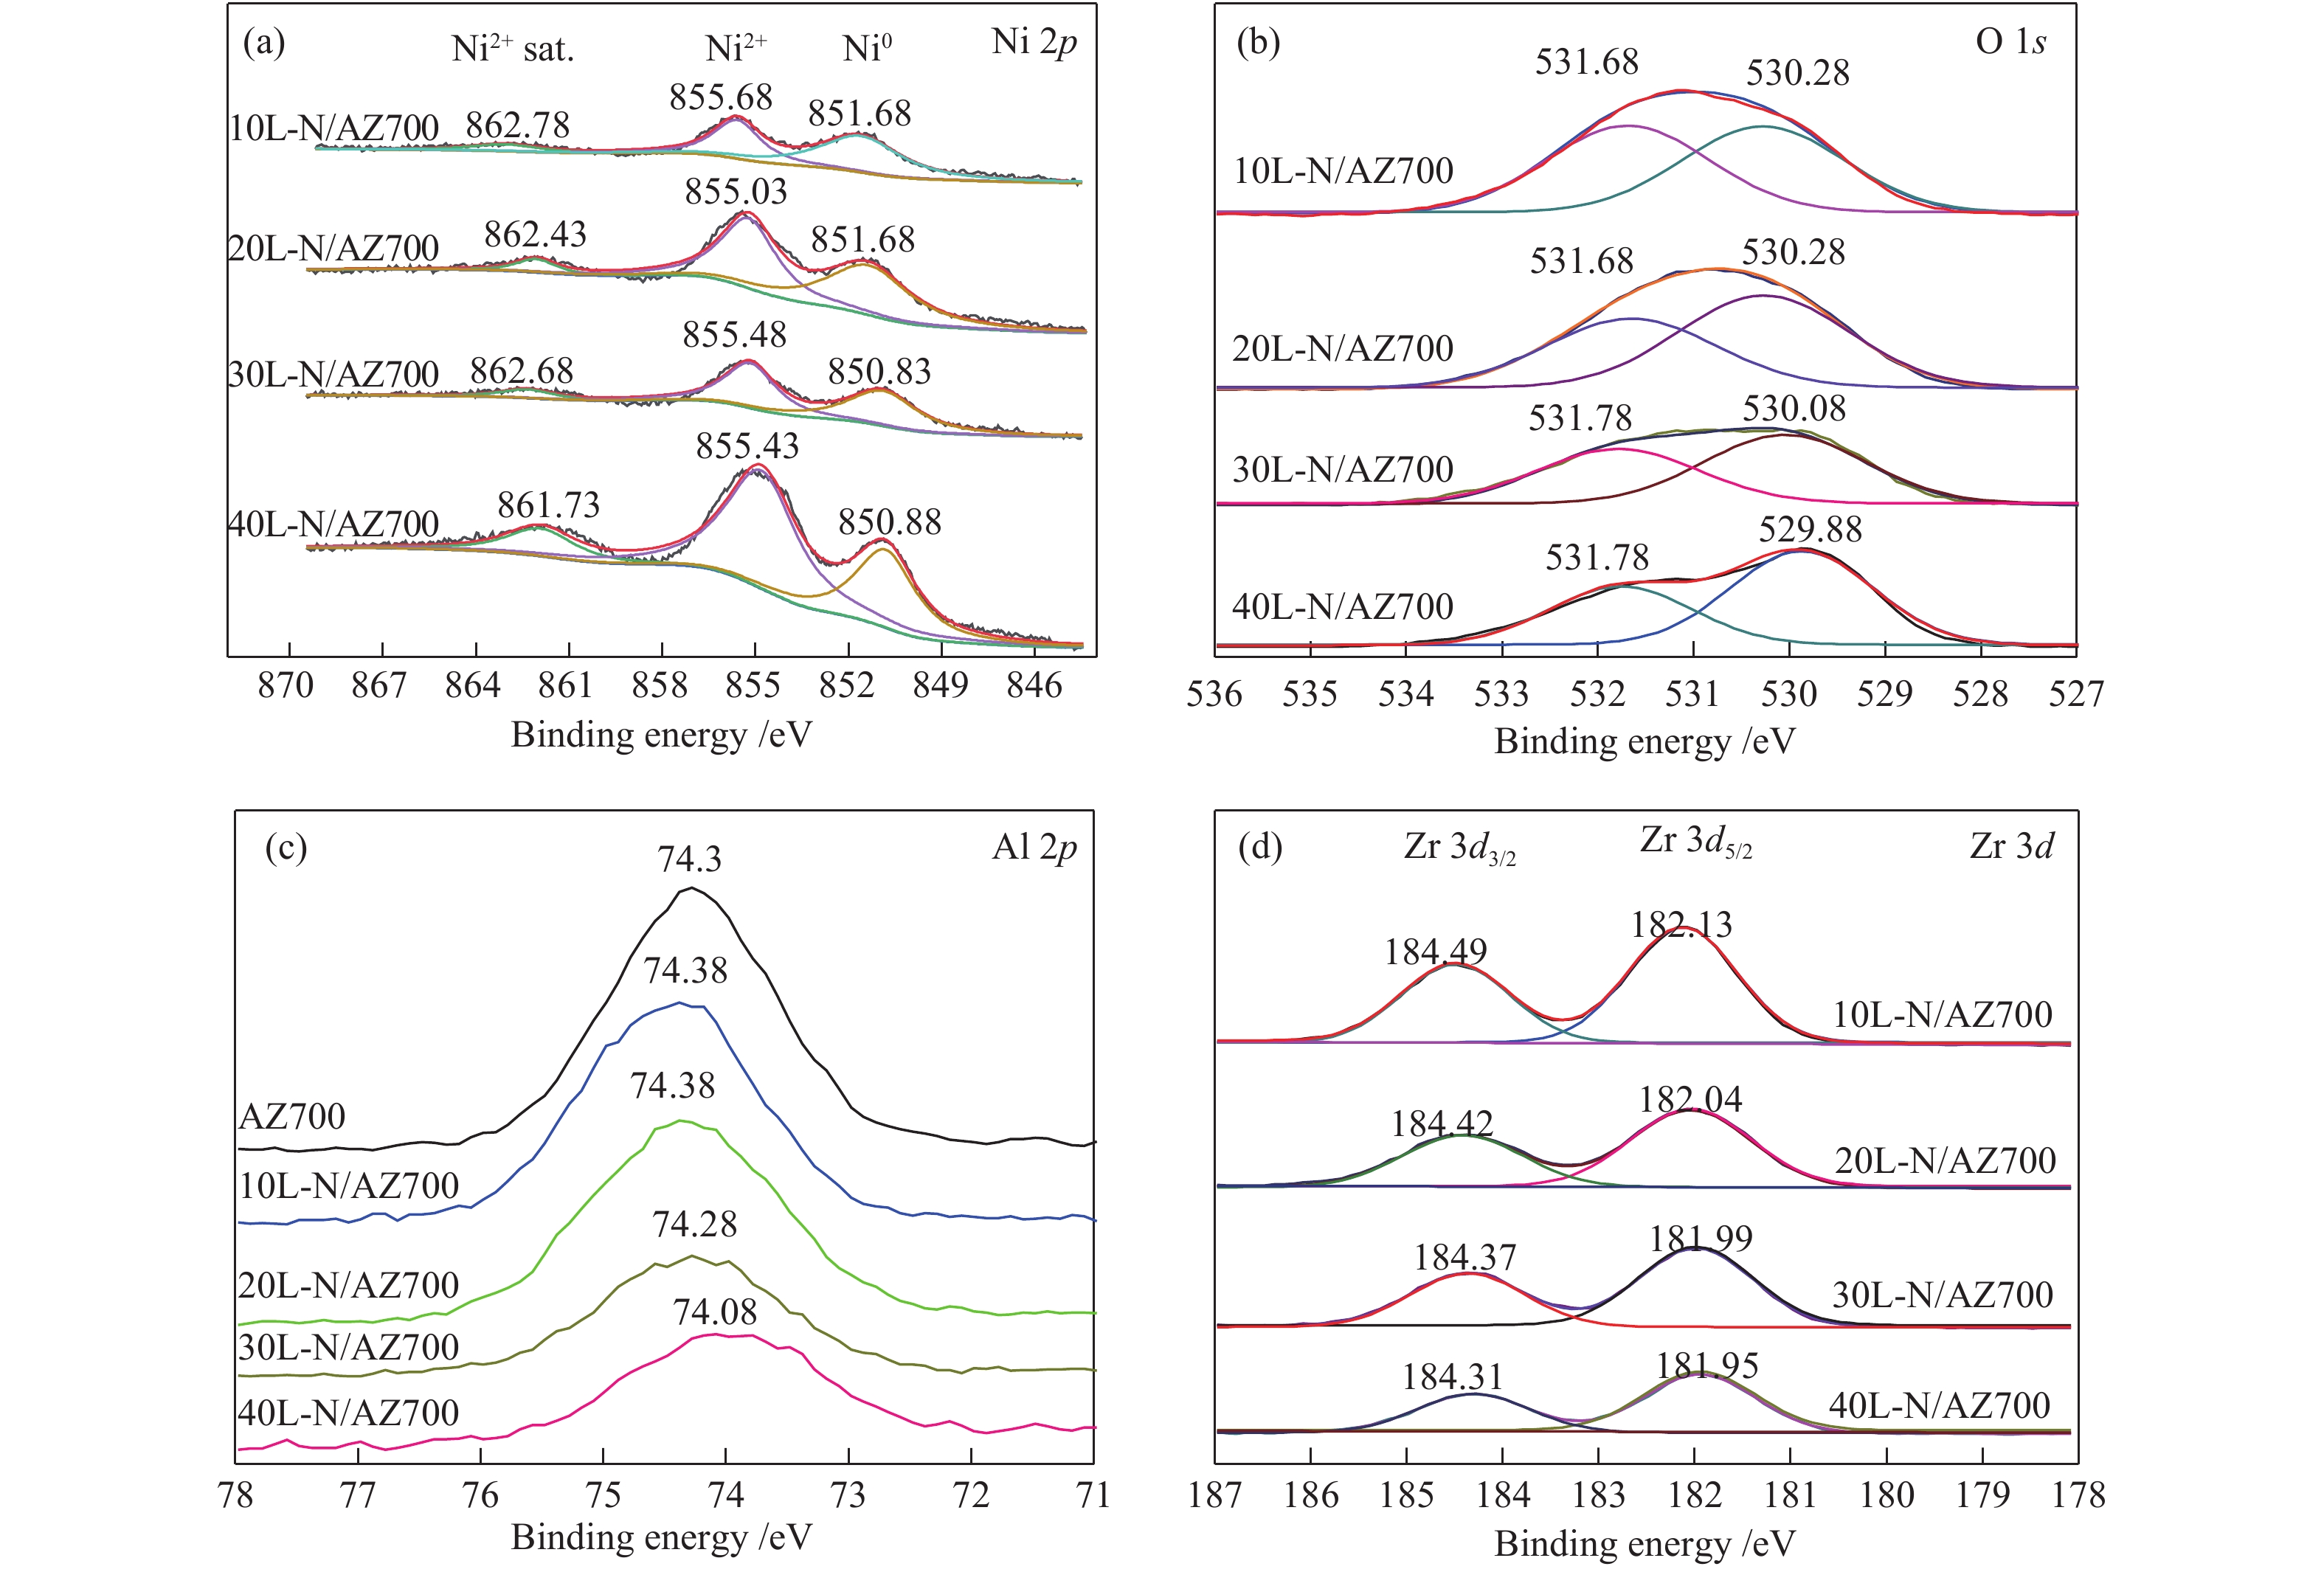
XPS is used to identify the chemical state of the reduced yL-N/AZ700 catalyst with different La-Ni loading after reduction, and the results are shown in Figure 7. La on the surface of the catalyst always exist in the state of La3+. So, only the change of Ni valence can be considered.
reduction condition: 600 °C for 2 h
As can be seen from Figure 7(a) that despite the catalysts are reduced at 600 °C for 2 h, metallic Ni0 (BE ≈ 852 eV) as well as oxidized Ni2+ (main peak BE = 856.0 eV, satellite peak BE = 862.7 eV) are observed on all catalysts, confirming that not all the nickel is reduced. Furthermore, the binding energies of Ni0 slightly decrease with the increasing of La-Ni loading due to the strong interaction between Ni and the surface Al ions, which is in agreement with the H2-TPR results.
For O 1s spectra of the catalysts (Figure 7(b)), two distinct peaks are observed. The first peak at binding energies of 531.68−531.78 eV can be attributed to the O2− in the OH− or
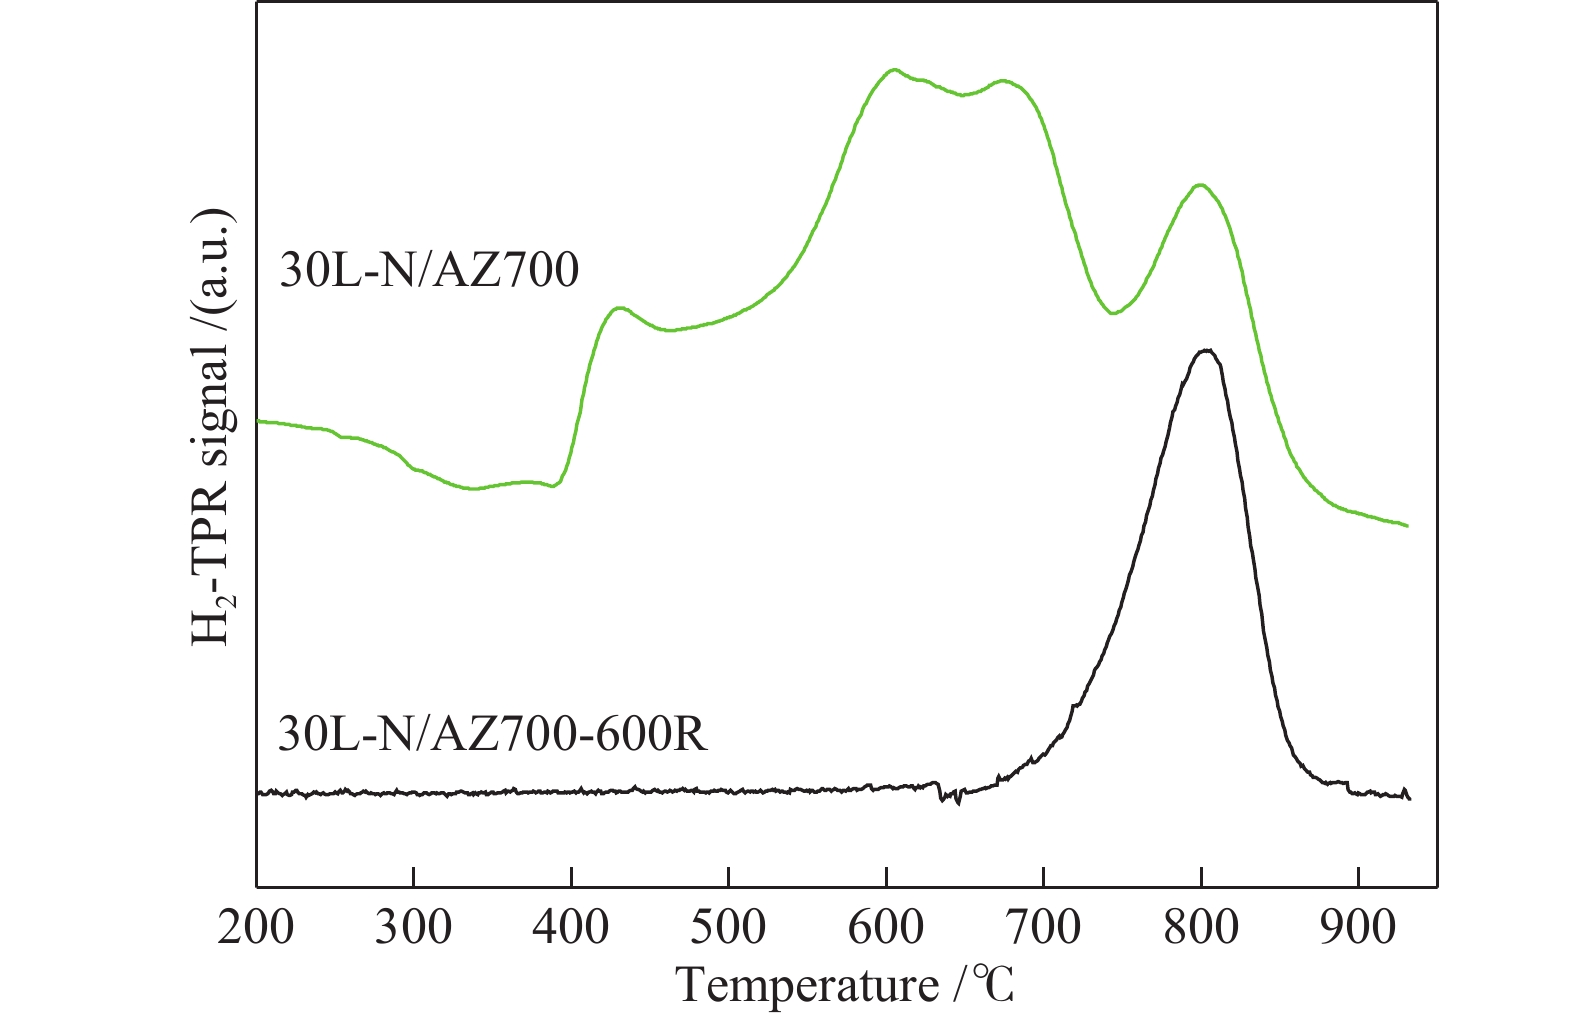
It can be seen from Figure 7(c) that the Al(2p) spectra of AZ700 show a shift from 74.3 to 73.38 eV for 10L-N/AZ700, while the shift decrease with the increasing of La-Ni loading. This is due to some nickel ions have interacted with the supports and formed spinel structure difficult to be reduced during the reduction process. The binding energy slightly decrease with La-Ni loading which means that the interaction of Al ions and adjacent ions is weakened. In order to further verify this conjecture, a secondary H2-TPR reduction on the reduced 30L-N/AZ700 catalyst (named as 30L-N/AZ700-600R) is performed, as shown in Figure 8. The reduction temperature of nickel-aluminum spinel for the 30L-N/AZ700-600R catalyst is obviously enhanced and the peak area increases compared with the 30L-N/AZ700 catalyst. These evidences indicate that the Ni ions is not completely reduced to Ni0 species during the first reduction process, some of which form hardly reduced structure of nickel-aluminum spinel with the supports, which is in accordance with the results of XPS.
The XPS spectra of Zr are displayed in Figure 7(d). Two main peaks at 184.4 and 182.1 eV can be assigned to the Zr4+ [37]. The electron binding energy of Zr4 + in all samples are slightly lower than that of stoichiometric ZrO2 (182.4 eV), indicating the existence of oxygen vacancies in the catalysts. A common sense it that, the oxygen vacancies play an important role in the dissociation of oxygen-containing chemical bonds.
The atomic percentages of Ni in the catalyst obtained by the decomposition are summarized in Table1. The order of Ni content on the catalyst surface is 40L-N/AZ700 > 20L-N/AZ700 > 30L-N/AZ700 > 10L-N/AZ700, which is in accordance with the H 2-TPR results.
The catalytic activities for CO methanation of the catalysts are tested (Figure 9). Catalysts with different La-Ni loading demonstrate significant differences in activity except for the 40L-N/AZ700. The catalytic performance of others increases initially until 400 °C and decrease in the reaction temperature range from 300 to 600 °C. Considering the fact that CO methanation belongs to strongly exothermic reaction, it follows the limitation of thermodynamic equilibrium.
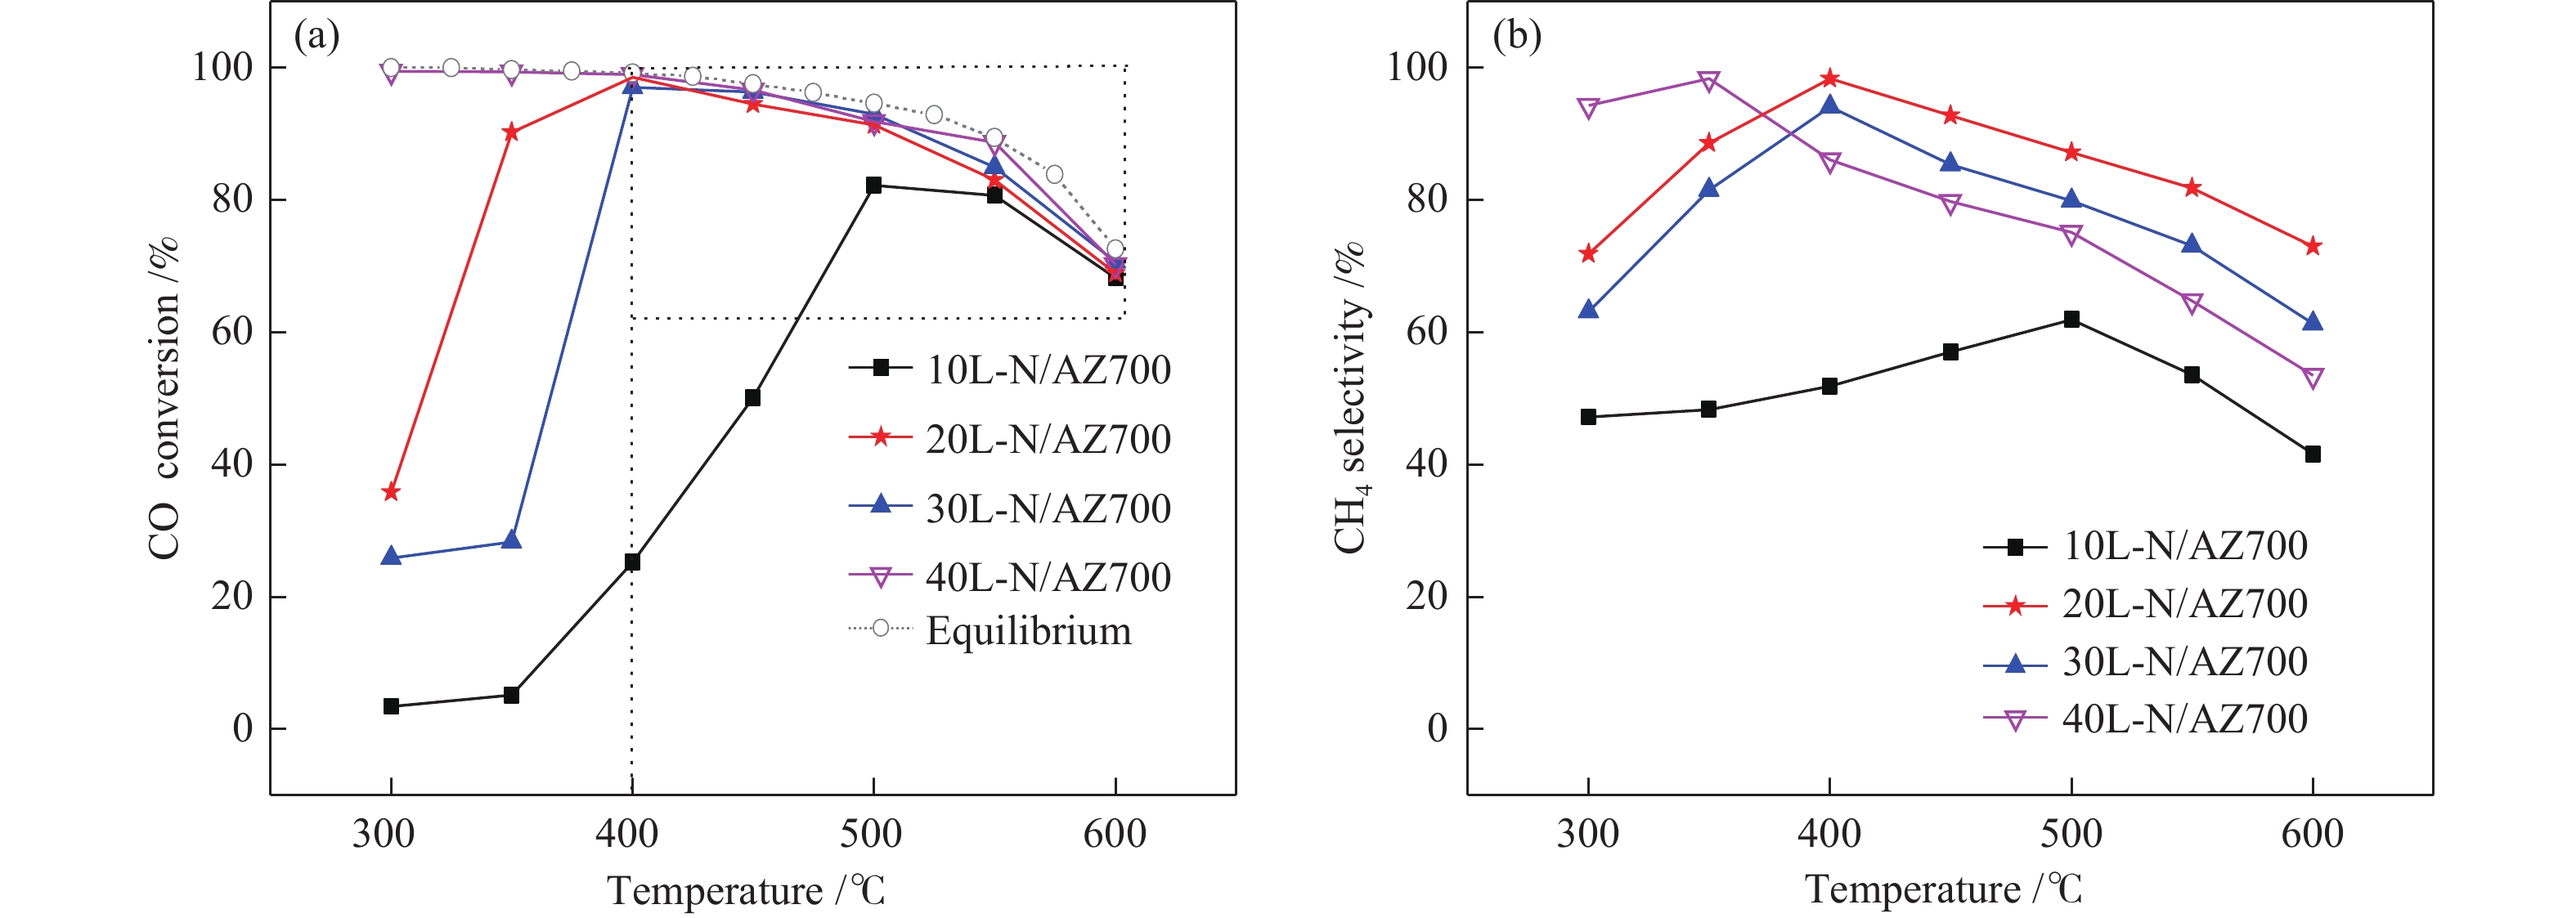
(a): CO conversion; (b): CH4 selectivity
The 10L-N/AZ700 catalyst shows poor catalytic activity due to the low Ni loading and most of which are in the form of spinel structure. The initial catalytic activity increases as La-Ni loading increase. The 40L-N/AZ700 catalyst exhibits nearly 100% CO conversion and the highest CH4 selectivity at 300 °C. The CO conversion decreases when the reaction temperature further increase because of thermodynamic limitation. The CH4 selectivity decreases from 94.2% at 350 °C to 53% at 600 °C, which presents the most severe deactivation for all catalysts. According to the aforementioned evidence from the H2-TPR, XRD and XPS, the maximum amount of free NiO and more Ni0 species formed after reduction facilitate the low-temperature performance.
On the contrary, despite the lower low-temperature activity of 20L-N/AZ700 and 30L-N/AZ700 catalysts than that of 40L-N/AZ700, they exhibit excellent catalytic performance when the reaction temperature over 400 °C. Particularly, the CO conversion and CH4 selectivity of 30L-N/AZ700 still maintain 72% and 61% when reaction temperature reach 600 °C, respectively.
CO methanation performances of catalysts with different loading content illustrate that the 30L-N/AZ700 catalyst shows superior high temperature activity (Figure 10). The results of H2-TPR and XRD demonstrate that more LaNiO3 is generated for 30L-N/AZ700 catalyst and the Ni0 reduced from LaNiO3 result in better high-temperature activity.
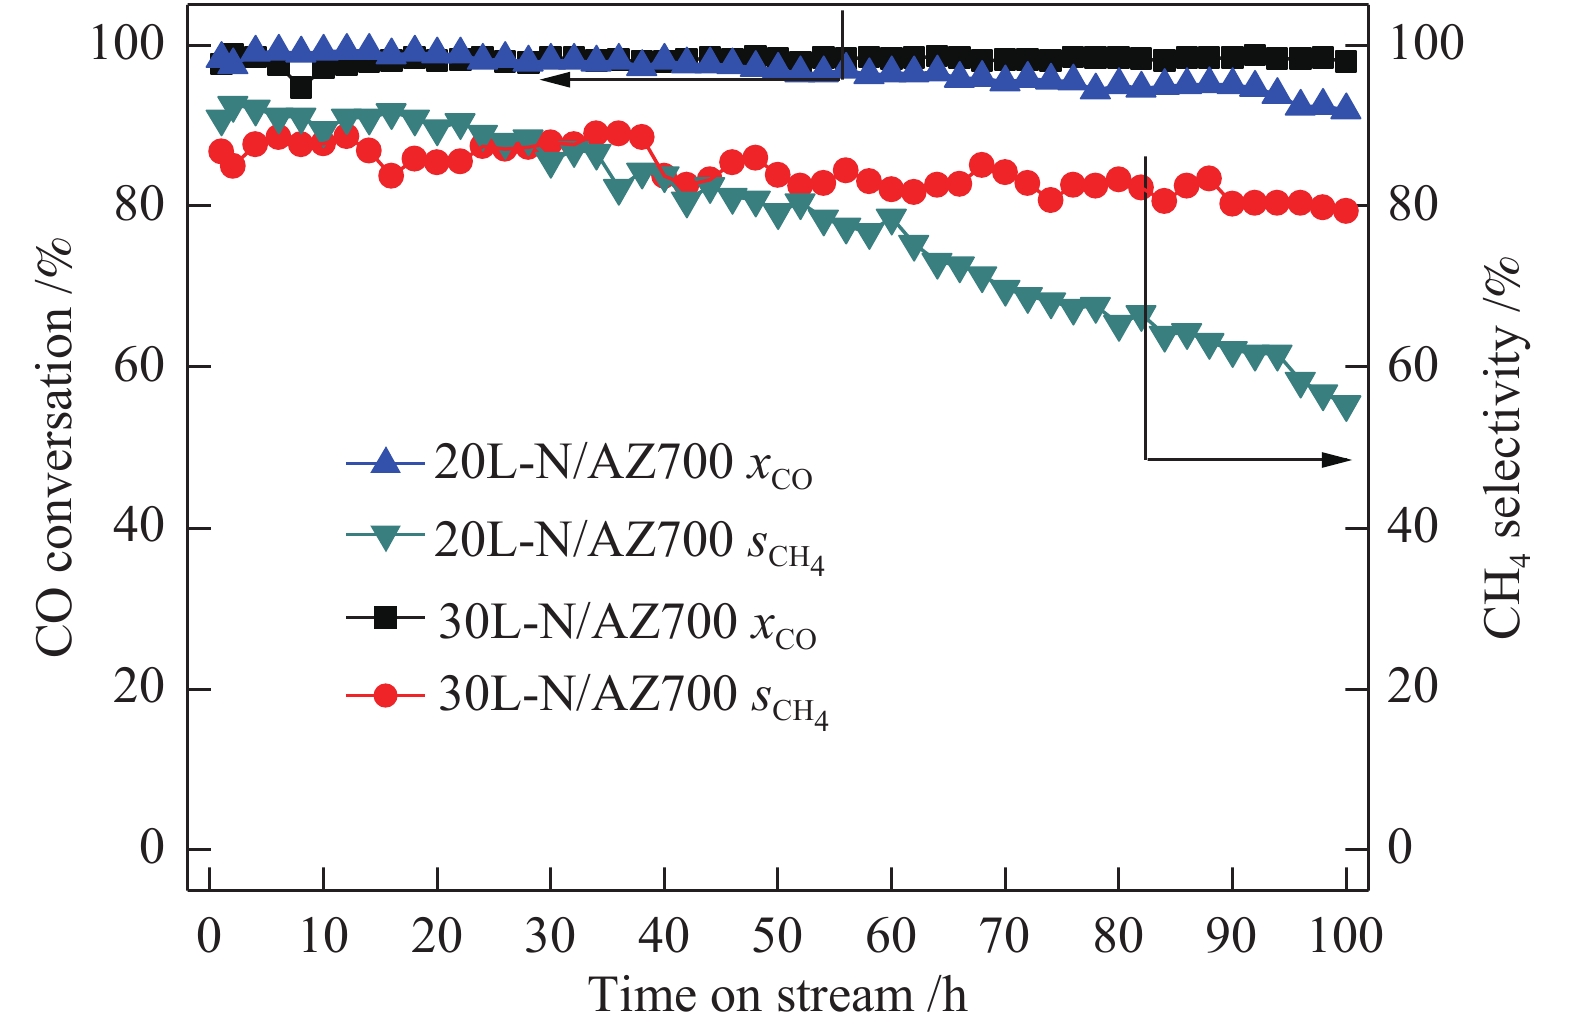
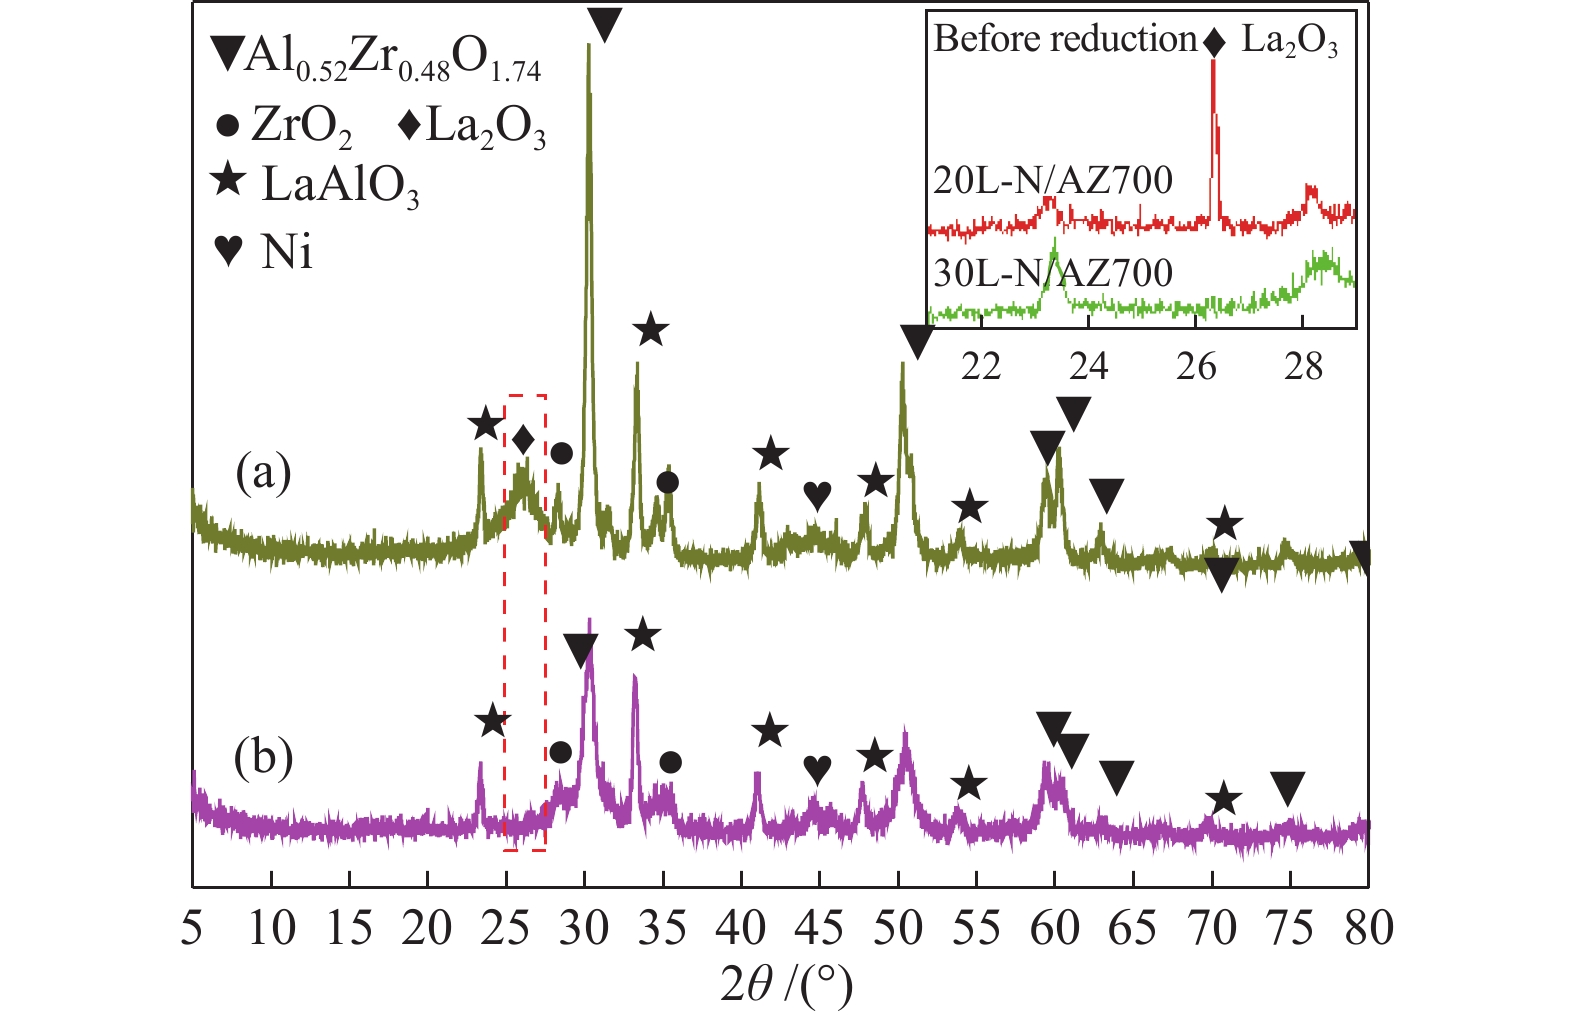
The stability test is conducted at 450 °C over the 20L-N/AZ700 and 30L-N/AZ700 catalysts and the results are shown in Figure 10. During the 100 h time on stream, the CO conversion of 30L-N/AZ700 remain stable while the 20L-N/AZ700 slightly decrease. The CH4 selectivity of 20L-N/AZ700 drop to 55% while the 30L-N/AZ700 still remain at 80%. The diffraction peaks corresponding to La2O3 can be observed in 20L-N/AZ700 catalyst which disappear in 30L-N/AZ700 (Figure 4). This may due to the La2O3 are highly distributed on 30L-N/AZ700 while clustered on the 20L-N/AZ700. To further illustrate this speculation, XRD is conducted to analyze the phase difference of the 20L-N/AZ700 and 30L-N/AZ00 catalysts after reduction at 600 °C for 2 h (named as 20L-N/AZ700R and 30L-N/AZ00R, respectively). The result are plotted in Figure 11. For both of the reduced catalysts, the diffraction peaks of LaAlO3 is detected, demonstrating that the La2O3 transform to LaAlO3 with Al2O3. The diffraction peaks of LaAlO3 in 30L-N/AZ700R are weaker than that in 20L-N/AZ700R. In addition, the diffraction peaks of La2O3 are also found for 20L-N/AZ700R which is broader than that in the 20L-N/AZ700. However, no diffraction peak of La2O3 is found for 30L-N/AZ700 catalyst before or after the reduction. These results confirm that La2O3 is highly dispersed on the reduced 30L-N/AZ700 catalyst.
reduction conditions: 600 °C for 2 h
TEM images of the reduced 20L-N/AZ700 and 30L-N/AZ700 catalysts provide more straightforward picture of the distribution of Ni and La2O3 nanoparticles. As presented in Figure12(a), Ni nanoparticles aggregate on the reduced 20L-N/AZ700 catalyst. As shown in Figure12(b), it is obvious that the La2O3 produced after reduction is clustered next to nickel nanoparticles. Figure 12(e) and (f) show that the nickel particles produced after reduction are uniformly distributed on the catalyst, and the La2O3 is distributed between the nickel particles. The TEM images in Figure 12(c) show that large amounts of filamentous carbon are formed and Ni particles are encapsulated with graphitic carbon in the tip of filamentous carbon on the spent 20L-N/AZ700 catalyst. However, no carbon accumulation is observed on the spent 30L-N/AZ700 catalyst according to the Figure 12(g). It is hard to observe the particle size and distribution state of nickel has changed after 100 h stability test compared Figure 12(f) with Figure 12(h) which suggest that La2O3 distributed uniformly on the catalyst hinder the sintering of nickel at high reaction temperature and thus improve the thermal stability of 30L-N/AZ700 catalyst.

(a) and (b): after reduction of 20L-N/AZ700; (c) and (d) after stability test of 20L-N/AZ700; (e) and (f): after reduction of 30L-N/AZ700; (g) and (h) after stability test of 30L-N/AZ700
Accordingly, it can be intuitively seen from the TEM images of Figure 12(a) and (f) that La2O3 is clustered around the nickel particles for the reduced 20L-N/AZ700, while distribute between the nickel particles in the 30LN/AZ700 catalyst. Based on this, the schematic diagram of the reduced state of the two catalysts can be shown in Figure 13.
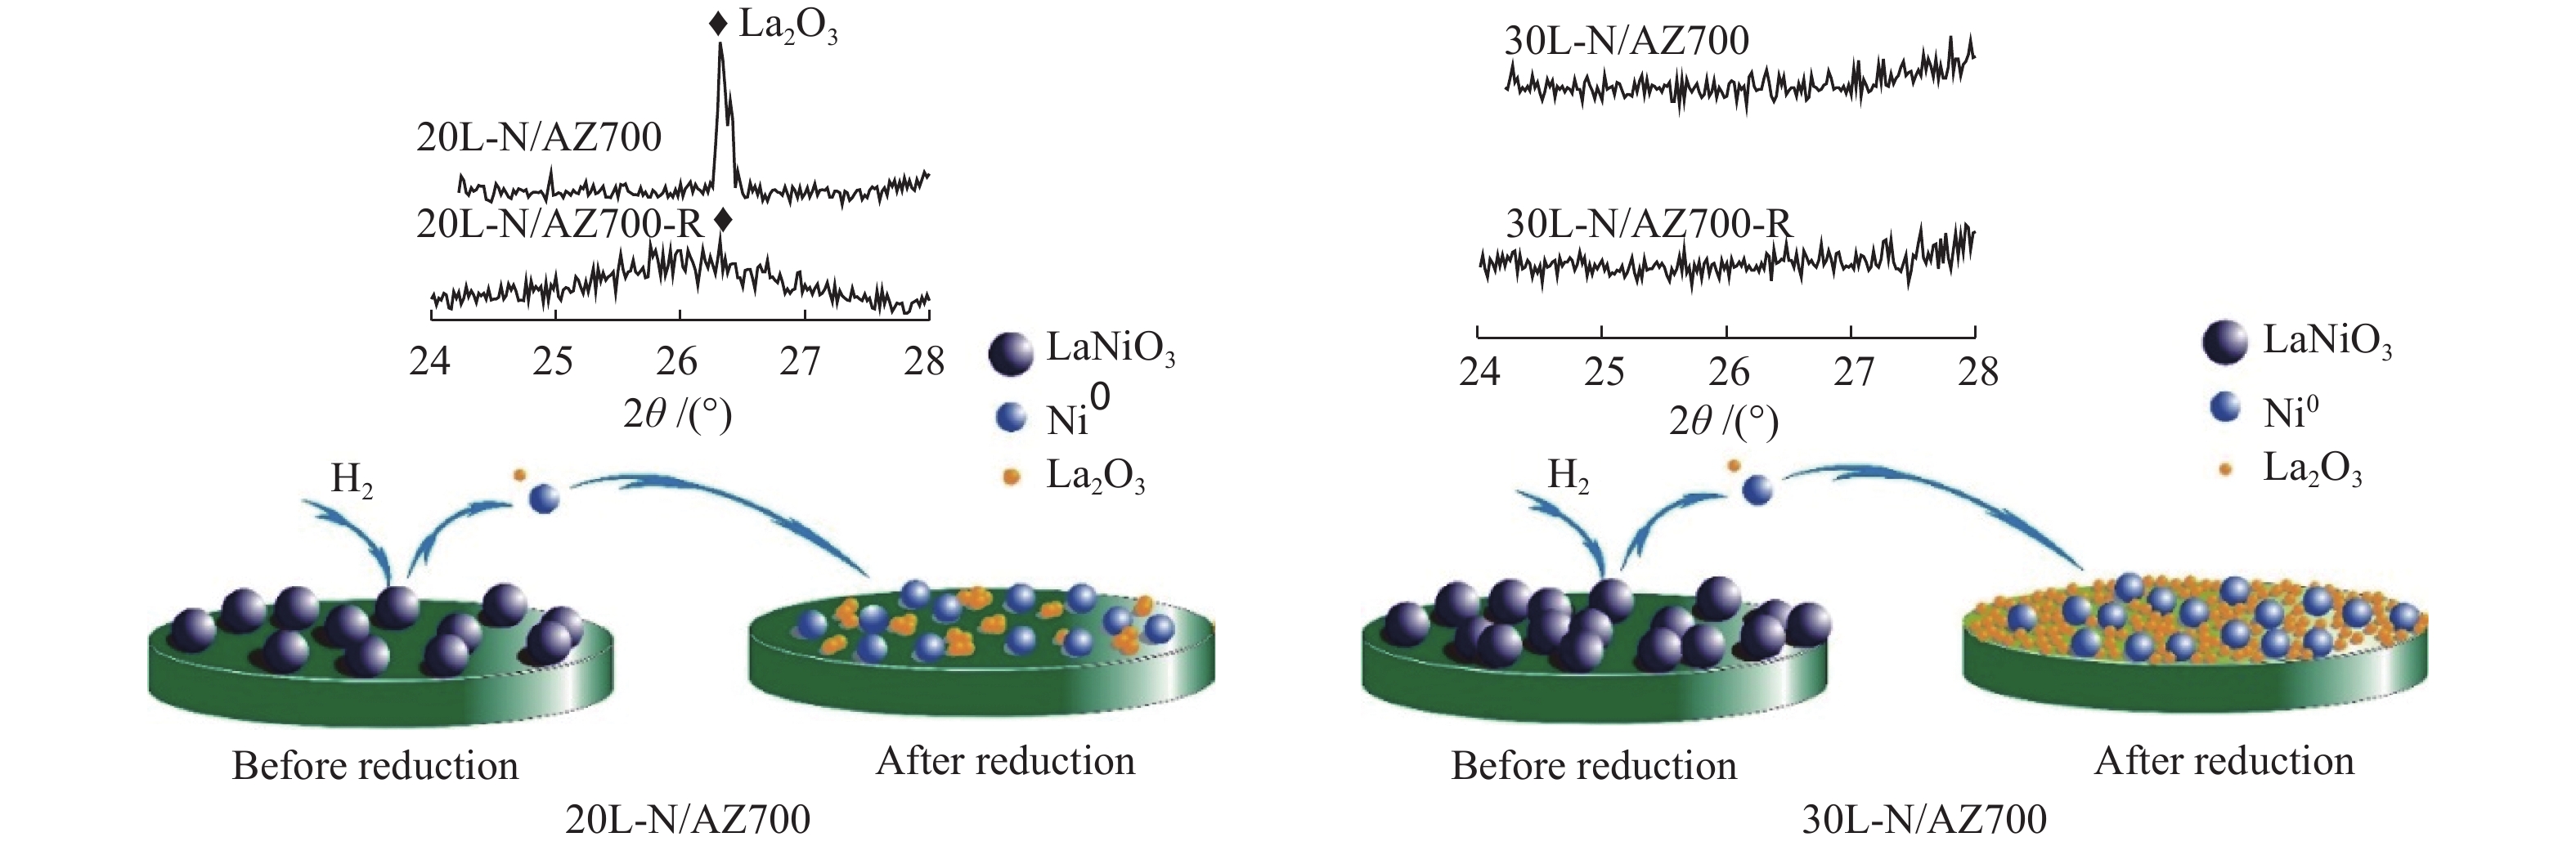
In details, La2O3 is highly dispersed on the surface of the support after the reduction of LaNiO3 for 30L-N/AZ700 catalyst. La2O3 effectively hinders the interaction between Ni0 and support, and thus inhibits the migration and aggregation of Ni particles. This is consistent with the effect of La2O3 as an assistant for CO methanation as reported previously[23]. It also indicates that the loading content of La-Ni significantly affects the structure and reduction state of the catalyst.
The biggest problem with the 30L-N/AZ700 catalyst is the lack of approving low-temperature activity. The experimental results show that the low-temperature activity of the 40L-N/AZ700 catalyst is relate to the reduction of NiO, which has a weak effect with the support. However, Ni0 reduced from NiO with weak interaction with the carrier is easy to sinter and form large Ni particles during the reaction. In addition, it does not benefit to form LaNiO3 and the specific surface area will significantly decrease when the La-Ni loading content increase to 40% (Figure 5, Figure 9 and Table 1). This suggests that excessive La-Ni content results in a decreased high temperature activity. Hence, it can be seen that only increasing the content of La-Ni can not simultaneously improve the activity and stability of the catalyst.
What causes the poor low-temperature activity of the 30 L-N/AZ700 catalyst? The H2-TPR of the 30L-N/AZ700 catalyst show that peak1 and peak2 significantly overlapped, which indicates that it is difficult to produce more Ni0 at low temperature, and the XPS results of the catalyst after reduction also confirm the results. In order to further investigate the reason, a secondary H2-TPR on the reduced 30L-N/AZ700R is conducted and the results are shown in Figure 8.
As expected, after the second reduction of 30L-N/AZ700R (Figure 8), the diffraction peak at 800 °C attributed to NiAl2O4 significantly increase compared with 30L-N/AZ700, indicating that not all Ni species are reduced to Ni0, but partly form NiAl2O4 with the Al2O3 in the support. The Ni specie entered the Al-Zr lattice and existed as NiAl2O4 is difficult to be reduced.
Al2O3-ZrO2 composite oxide support was prepared by hydrolysis-neutralization precipitation method, and LaNiO3/Al2O3-ZrO2 catalyst was prepared by citric acid complexation method. The effects of calcination temperature of support and La-Ni loading on the structure and catalytic activity were investigated. The relationship between the structure evolution and reaction performance of the catalyst before and after reduction was discussed. The relationship between the performance of La-Ni/Al2O3-ZrO2 catalyst (activity and stability) and the formation and structural evolution of LaNiO3 precursor after reduction was discussed.
The results showed that the support calcinated at 700 °C formed homogeneous Al2O3-ZrO2 solid solution which was beneficial to the formation of the perovskite LaNiO3 precursor. The Ni0 and La2O3 were formed after LaNiO3 was reduced. The Ni0 was the key factor to maintain the activity under medium - high temperature.
The La-Ni loading affected the formation of LaNiO3 precursor and the reduction state of Ni. 30% of the La-Ni loading was more favorable for the formation of perovskite LaNiO3. The Ni0 and La2O3 reduced from LaNiO3 precursor were highly dispersed on the surface of the support. The Ni0 nanoparticles were anchored by the support and La2O3 which inhibited the migration and aggregation of Ni0 particles at high temperature and thus led to high thermal stability.
SNG Synthetic Natural Gas
NPs Nano Particles
PTO Perovskite-type oxides
LIU Q, SUN J, FENG Q. A La-promoted Ni/MgAl2O4 catalyst with superior methanation performance for the production of synthetic natural gas[J]. Catal Today,2020,339:127−134. doi: 10.1016/j.cattod.2019.07.034
RONSCH S, SCHNEIDER J, MATTHISCHKE S. Review on methanation - From fundamentals to current projects[J]. Fuel,2016,166:276−296. doi: 10.1016/j.fuel.2015.10.111
HAN Y, QUAN Y, HAO P. Highly anti-sintering and anti-coking ordered mesoporous silica carbide supported nickel catalyst for high temperature CO methanation[J]. Fuel,2019,257:116006.
KAMATA H, TIAN Z Q, IZUMI Y. Dispersed and high loading Ni catalyst stabilized in porous SiO2 matrix for substituted natural gas production[J]. Catal Today,2018,299:193−200. doi: 10.1016/j.cattod.2017.03.003
ZHANG A H, ZHU J, DUAN W H. CO methanation on Ni(111) and modified Ni3Al(111) surfaces: A first-principle study[J]. Surf Sci,2007,601(2):475−478. doi: 10.1016/j.susc.2006.10.009
CASTILLO J, ARTEAGA-PÉREZ L E, KARELOVIC A. The consequences of surface heterogeneity of cobalt nanoparticles on the kinetics of CO methanation[J]. Catal Sci Technol,2019,9(22):6415−6427. doi: 10.1039/C9CY01753D
CHEN S, ABDEL-MAGEED A M, GAUCKLER C. Selective CO methanation on isostructural Ru nanocatalysts: The role of support effects[J]. J Catal,2019,373:103−115. doi: 10.1016/j.jcat.2019.03.015
ABDEL-MAGEED A M, WIDMANN D, OLESEN S E. Selective CO methanation on highly active Ru/TiO2 catalysts: Identifying the physical origin of the observed activation/deactivation and loss in selectivity[J]. ACS Catal,2018,8(6):5399−5414. doi: 10.1021/acscatal.8b00384
FAJÍN J L C, GOMES J R B, D. S. CORDEIRO M N. Mechanistic study of carbon monoxide methanation over pure and rhodium- or ruthenium-doped nickel catalysts[J]. J Phys Chem C,2015,119(29):16537−16551. doi: 10.1021/acs.jpcc.5b01837
JENEWEIN B, FUCHS M, HAYEK K. The CO methanation on Rh/CeO2 and CeO2/Rh model catalysts: A comparative study[J]. Surf Sci. 2003, 532−535: 364-369.
HU X, YAN W, DING W. Bifunctional palladium composite membrane for hydrogen separation and catalytic CO methanation[J]. Chin J Catal,2013,34(9):1720−1729. doi: 10.1016/S1872-2067(12)60636-6
LI S, GONG D, TANG H. Preparation of bimetallic Ni@Ru nanoparticles supported on SiO2 and their catalytic performance for CO methanation[J]. Chem Eng J,2018,334:2167−2178. doi: 10.1016/j.cej.2017.11.124
ZHAO B, YAO Y, SHI H. Preparation of Ni/SiO2 catalyst via novel plasma-induced micro-combustion method[J]. Catal Today,2019,337:28−36. doi: 10.1016/j.cattod.2019.04.068
ROMBI E, CUTRUFELLO M G, ATZORI L. CO methanation on Ni-Ce mixed oxides prepared by hard template method[J]. Appl Catal A:Gen,2016,515:144−153. doi: 10.1016/j.apcata.2016.02.002
ZHAI Y, XIONG J, LI C. Influence of preparation method on performance of a metal supported perovskite catalyst for combustion of methane[J]. J Rare Earths,2010,28(1):54−58. doi: 10.1016/S1002-0721(09)60050-8
GONG D, LI S, GUO S. Lanthanum and cerium co-modified Ni/SiO2 catalyst for CO methanation from syngas[J]. Appl Surf Sci,2018,434:351−364. doi: 10.1016/j.apsusc.2017.10.179
HWANG S, HONG U G, LEE J. Methanation of carbon dioxide over mesoporous nickel-M-alumina (M = Fe, Zr, Ni, Y, and Mg) xerogel catalysts: Effect of second metal[J]. Catal Lett,2012,142(7):860−868. doi: 10.1007/s10562-012-0842-0
JIANG P, ZHAO J, HAN Y. Highly active and dispersed Ni/Al2O3 catalysts for CO methanation prepared by the cation-anion double-hydrolysis method: Effects of Zr, Fe, and Ce promoters[J]. Ind Eng Chem Res,2019,58(27):11728−11738. doi: 10.1021/acs.iecr.9b00002
LI Z, ZHAO T, ZHANG L. Promotion effect of additive Fe on Al2O3 supported Ni catalyst for CO2 methanation[J]. Appl Organomet Chem,2018,32(5).
PHUNG T K, PHAM T L M, NGUYEN A-N T. Effect of supports and promoters on the performance of Ni-based catalysts in ethanol steam reforming[J]. Chem Eng Technol,2020,43(4):672−688.
ZHANG M, YU F, LI J. High CO methanation performance of two-dimensional Ni/MgAl layered double oxide with enhanced oxygen vacancies via flash nanoprecipitation[J]. Catalysts,2018,8(9).
DING C, GAO X, HAN Y. Effects of surface states over core-shell Ni@SiO2 catalysts on catalytic partial oxidation of methane to synthesis gas[J]. J Energy Chem,2015,24(1):45−53. doi: 10.1016/S2095-4956(15)60283-2
SI J, LIU G, LIU J. Ni nanoparticles highly dispersed on ZrO2 and modified with La2O3 for CO methanation[J]. RSC Adv,2016,6(15):12699−12707. doi: 10.1039/C5RA26888E
HAN Y, WEN B, ZHU M. Lanthanum incorporated in MCM-41 and its application as a support for a stable Ni-based methanation catalyst[J]. J Rare Earths,2018,36(4):367−373. doi: 10.1016/j.jre.2017.07.016
RABELO-NETO R C, SALES H B E, INOCÊNCIO C V M. CO2 reforming of methane over supported LaNiO3 perovskite-type oxides[J]. Appl Catal B: Environ,2018,221:349−361. doi: 10.1016/j.apcatb.2017.09.022
ZHAO L, HAN T, WANG H. Ni-Co alloy catalyst from LaNi1−xCoxO3 perovskite supported on zirconia for steam reforming of ethanol[J]. Appl Catal B: Environ,2016,187:19−29. doi: 10.1016/j.apcatb.2016.01.007
WANG X, ZHU L, ZHUO Y. Enhancement of CO2 methanation over La-Modified Ni/SBA-15 catalysts prepared by different doping methods[J]. ACS Sustainable Chem Eng,2019,7(17):14647−14660. doi: 10.1021/acssuschemeng.9b02563
LIU Q, GU F, GAO J. Coking-resistant Ni-ZrO2/Al2O3 catalyst for CO methanation[J]. J Energy Chem,2014,23(6):761−770. doi: 10.1016/S2095-4956(14)60210-2
ZHANG X, RUI N, JIA X. Effect of decomposition of catalyst precursor on Ni/CeO2 activity for CO methanation[J]. Chin J Catal,2019,40(4):495−503. doi: 10.1016/S1872-2067(19)63289-4
NGUYEN T T M, WISSING L, SKJØTH-RASMUSSEN M S. High temperature methanation: Catalyst considerations[J]. Catal Today,2013,215:233−238. doi: 10.1016/j.cattod.2013.03.035
GUO C, WU Y, QIN H. CO methanation over ZrO2/Al2O3 supported Ni catalysts: A comprehensive study[J]. Fuel Process Technol,2014,124:61−69. doi: 10.1016/j.fuproc.2014.02.017
LIN J, MA C, WANG Q. Enhanced low-temperature performance of CO2 methanation over mesoporous Ni/Al2O3-ZrO2 catalysts[J]. Appl Catal B: Environ,2019,243:262−272. doi: 10.1016/j.apcatb.2018.10.059
LI L, HUO M, ZHANG Y. Synthesis of nickel catalysts supported on Zr-doped ordered mesoporous Al2O3 and their catalytic performance for low-temperature CO2 reforming of CH4[J]. J Porous Mater,2017,24(6):1613−1625. doi: 10.1007/s10934-017-0401-6
SOUZA M M V M, ARANDA D A G, SCHMAL M. Reforming of methane with carbon dioxide over Pt/ZrO2/Al2O3 catalysts[J]. J Catal,2001,204(2):498−511. doi: 10.1006/jcat.2001.3398
SONG J H, HAN S J, SONG I K. Hydrogen production by steam reforming of ethanol over mesoporous Ni-Al2O3-ZrO2 catalysts[J]. Catal Surv Asia,2017,21(3):114−129. doi: 10.1007/s10563-017-9230-5
MORADI G R, RAHMANZADEH M, KHOSRAVIAN F. The effects of partial substitution of Ni by Zn in LaNiO3 perovskite catalyst for methane dry reforming[J]. J CO2 Util,2014,6:7−11. doi: 10.1016/j.jcou.2014.02.001
WANG S, ZHANG L, ZHANG W Y. Selective conversion of CO2 into propene and butene[J]. Chem,2020,6:1−20. doi: 10.1016/j.chempr.2019.12.023

Figure 3 Catalytic performance for CO methanation over L-N/AZx:(a): CO conversion; (b): CH4 selectivity
reaction conditions: p = 0.1 MPa, GHSV = 15000 mL/(g·h)

Figure 7 XPS spectra for the reduced catalysts(a): Ni 2p and La 3d; (b): O 1s; (c): Al 2p; (d); Zr 3d
reduction condition: 600 °C for 2 h

Figure 9 catalytic performance for CO methanation over yL-N/AZ700
(a): CO conversion; (b): CH4 selectivity

Figure 10 The catalyst stability test results of 20L-N/AZ700 and 30L-N/AZ700 for a continuous 100 h at 450 °C WHSV = 15000 mL/(g·h), p = 0.1 MPa

Figure 11 XRD patterns of reduced catalysts (a): 20L-N/AZ700R; (b): 30L-N/AZ700R
reduction conditions: 600 °C for 2 h

Figure 12 Representative TEM images
(a) and (b): after reduction of 20L-N/AZ700; (c) and (d) after stability test of 20L-N/AZ700; (e) and (f): after reduction of 30L-N/AZ700; (g) and (h) after stability test of 30L-N/AZ700

Figure 13 Schematic diagram of the state of the 20L-N/AZ700 and 30L-N/AZ700 catalysts before and after reduction
Table 1. Physical properties of AZ700 support and yL-N/AZ700 catalysts
| Sample | SBET a/(m2·g−1) | Pore size a/nm | Pore volume a/(cm3·g−1) | Nib/% | The proportion of the reduction peaks c/% | |||
| peak1 | peak2 | peak3 | peak4 | |||||
| AZ700 | 55.8 | 16.8 | 0.614 | − | − | − | − | − |
| 10L-N/AZ700 | 81.9 | 11.2 | 0.412 | 1.3 | − | − | − | 100 |
| 20L-N/AZ700 | 72.8 | 12.0 | 0.387 | 2.74 | 25.3 | 12.1 | 8.9 | 53.7 |
| 30L-N/AZ700 | 68.1 | 10.6 | 0.296 | 1.96 | 15.6 | 29.2 | 31.5 | 23.7 |
| 40LN/AZ700 | 38.0 | 13.0 | 0.270 | 5.16 | 31.6 | 16.6 | 34.0 | 17.8 |
| a: specific surface area of the supports and as-prepared samples were calculated using Brumauer-Emmett-Teller (BET) modeling;
b: surface nickel atom fraction determined by XPS; c: the proportion of the different reduction peaks areas through H2-TPR |
||||||||
 下载: 导出CSV

 扫一扫看文章

扫一扫关注我们