Citation:
Fanjun Kong, Jing Zhang, Yuting Tang, Chencheng Sun, Chunfu Lin, Tao Zhang, Wangsheng Chu, Li Song, Liang Zhang, Shi Tao. Introducing high-valence element into P2-type layered cathode material for high-rate sodium-ion batteries[J]. Chinese Chemical Letters,
2025, 36(8): 110993.
doi:
10.1016/j.cclet.2025.110993
Introducing high-valence element into P2-type layered cathode material for high-rate sodium-ion batteries
English
Introducing high-valence element into P2-type layered cathode material for high-rate sodium-ion batteries
School of Electronic and Information Engineering, Jiangsu Laboratory of Advanced Functional Materials, Changshu Institute of Technology, Changshu 215500, China
b.
Institute of Functional Nano & Soft Materials (FUNSOM), Soochow University, Suzhou 215123, China
c.
College of Physics, Donghua University, Shanghai 201620, China
d.
National Synchrotron Radiation Laboratory, University of Science and Technology of China, Hefei 230029, China
e.
School of Physical and Mathematical Sciences, Nanyang Technological University, Singapore 637371, Singapore
taoshi@cslg.edu.cn (S. Tao). 1 These authors contributed equally to this work.
Received Date:
07 November 2024 Accepted Date:
20 February 2025 Revised Date:
18 February 2025 Available Online:
15 August 2025
Abstract:
P2-type layered transition-metal oxides with high energy density and rich variety have attracted extensive attention for sodium-ion batteries (SIBs) in grid-scale energy storage application, but they usually suffer from sluggish kinetics and large volume change upon cycling. Herein, we designed a high-performance P2-type Na0.67Ni0.31Mn0.67Mo0.02O2 (NNMMO) cathode with regulated electronic environment and Na+ zigzag ordering modulation via high-valence Mo6+ stabilization engineering. The achieved NNMMO cathode exhibits a high-rate capability with a reversible capacity of 77.2 mAh/g at 10 C and a long cycle life with a capacity retention of 75% at 2 C after 1000 cycles. In addition, in situ X-ray diffraction and ex-situ X-ray absorption fine structure spectroscopy characterizations verify that the presence of Mo6+ also stabilizes the desodiated structure through a pinning effect, achieving an extremely low volume change of 1.04% upon Na+ extraction. The quantified diffusional analysis and theoretical calculations demonstrate that the Mo6+-doping improves the Na+ diffusion kinetics, optimizes the energy band structure and enhances the TM-O bond strength. Additionally, the as-fabricated pouch cells by paring NNMMO cathode and hard carbon anode show impressive cycling stability with an energy density of 296.7 Wh/kg. This study broadens the perspective for high-valence metal ion doping to obtain superior cathode materials and pave the way for developing high-energy-density SIBs.
Sodium-ion batteries (SIBs) have been regarded as the most promising complement to lithium-ion batteries (LIBs) for large-scale electrochemical energy storage, owing to a number of advantages including abundant sodium raw material reserves, wide distribution, low price, safety and good low temperature performance [1]. However, the current SIBs cannot satisfy the alternative long-term cycling energy power plant in rapid succession due to larger radius of Na+ and inherent limitations of cathode materials during the charge/discharge process [2]. Layered transition-metal oxides (NaxTMO2 (x ≤ 1)) with large reversible capacity and variety of compositions, have attracted intensive attention [3]. Among the NaxTMO2 materials, the mostused crystal structures are the O3 and P2 phases. It is widely accepted that P2 phase displays superior faster Na+ migration compared to that in O3 phase, because of the prismatic sublattice arrangements [4]. In particular, P2-type Na0.67Ni0.33Mn0.67O2 (NNMO) cathode shows great potential for practical SIBs application, while it still suffers from sluggish kinetics and intrinsic structural instability, which is mainly due to Na slab ordering/disordering, detrimental phase transition and MnO6 octahedral structure distortion at deep desodiation state [5,6]. Efforts have been devoted to facilitate the fast Na+ (de)intercalation and stabilize the crystal structure, such as cation doping (e.g., Li+, Mg2+, Cu2+, Co3+, Ti4+) [7]. For example, introducing Nb5+ substitution can reduce the Na+ diffusion barrier and decrease electronic band gap, which enables good battery performances at −40 ℃ [8]. Mg2+ and Ti4+ co-doping into the TM layer can contribute to the improved rate performance and smooth kinetic process [9]. However, regardless of the obtained achievements, there is a lot of room for exploration to understand the underlying optimization mechanism. The above research results inspire us to design novel P2-type NNMO cathode to obtain high rate performance by selecting high-valence cation-doping to regulate the local chemistry and simultaneously enhance the structural stability.
In this study, we developed a high-valence Mo6+ stabilization strategy to modulate the Na+/vacancy interlayer ordering and structural stabilization of NNMO. Through systematically physicochemical characterizations and electrochemical analysis, we demonstrated that the partial Mo6+ substitution can realize the modulation of electronic structure and induce highly Na+/vacancy interlayer ordering, contributing to fast charge capability and cycling stability. Consequently, the obtained Na0.67Ni0.31Mn0.67Mo0.02O2 (NNMMO) exhibited a capacity of 59 mAh/g at 30 C with a working voltage range of 2.4–4.0 V, and 77 mAh/g at 10 C with a working voltage range of 2.2–4.1 V, which is superior to that of NNMO. In situ XRD and ex situ XAFS revealed that NNMMO effectively suppresses destructive structural variation and extends cycle life due to the mechanochemical stability in this rivet phase after Mo substitution. Theoretical calculations confirmed that Mo6+-doping can simultaneously enhance the electronic conductivity and TM-O bond strength to stabilize the P2-type crystal structure, thus enabling rapid transfer of electron and Na+. Moreover, the soft-pack full cell based on NNMMO cathode and commercial hard carbon anode showed an energy density of 296.7 Wh/kg with outstanding rate performance and cycling stability.
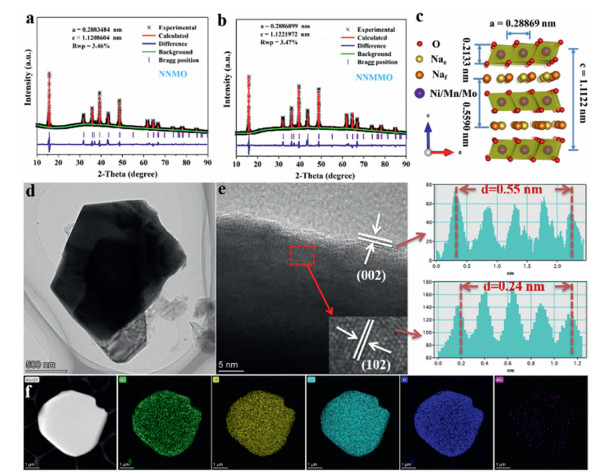
The Na0.67Ni0.33Mn0.67O2 (NNMO) and Na0.67Ni0.31Mn0.67Mo0.02O2 (NNMMO) cathode materials were prepared via solid state method under high temperature, and the corresponding crystal structures were characterized by XRD measurement. As shown in Figs. 1a and b, the obtained NNMO and NNMMO crystallize in a P2-type structure with a space group of P63/mmc. The results of Rietveld refinements with small weighted profile R-factor are provided in Tables S1 and S2 (Supporting information), which displays that a/b and c parameters of NNMMO become larger than NNMO due to Mo substitution leads to the contraction of TMO2 layers and expansion of Na layer spacing. The Mo-doping causes left shifts of the (002) peaks (Fig. S1 in Supporting information), because of an increase in the d-spacing. Based on above results, the behaviors of Mo dopants can be displayed in the schematic diagram in Fig. 1c and Fig. S2 (Supporting information). It worth noting that the newly appeared characteristic peaks between 25° and 30° can be attributed to the LZZ Na+/vacancy ordering in NNMMO [10]. The morphology of NNMO and NNMMO cathodes were firstly visualized by SEM images, showing evenly distributed flake-like particle with sizes of 1–5 µm (Figs. S3 and S4 in Supporting information). The elements analysis was performed by EDS and the corresponding atomic contents are displayed in the inset of Fig. S5 (Supporting information), revealing that the atomic stoichiometry is close to 0.31:0.67:0.02 for Ni, Mn and Mo, matching well with the designed composition. The microstructure of NNMMO was further analyzed via TEM, as illustrated in Figs. 1d and e, and the clear lattice fringes with inter spacing of 0.55 and 0.24 nm can be ascribed to the (002) and (102) planes. The elemental mapping images demonstrate the homogenous distribution of Na, Ni, Mn, Mo, and O elements over the NNMMO particle (Fig. 1f).
Figure 1
Figure 1.
Structural characterization of NNMO and NNMMO. (a, b) Rietveld refinement patterns of NNMO and NNMMO. (c) Schematic diagram of the crystal structure of NNMMO. (d, e) TEM and HRTEM images of NNMMO. (f) EDS mapping images of NNMMO.
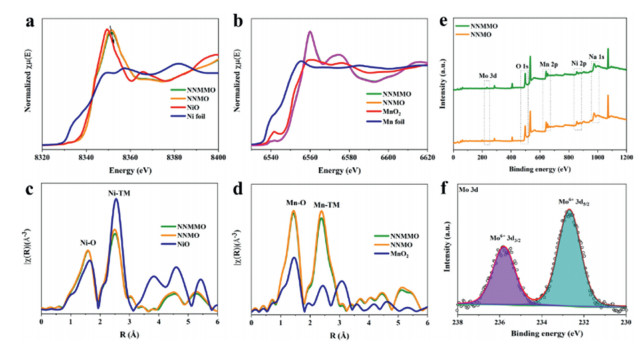
Synchrotron-based X-ray absorption fine structure (XAFS) measurement was performed to explore the effect on local configuration and valence state of NNMO by Mo-doping. From the Ni K-edge X-ray near-edge structure (XANES) spectra (Fig. 2a), we identify that the white lines of NNMO and NNMMO are the same as the NiO reference, while the peak intensity decreases for NNMMO compared to that of NNMO, attributing to the modulation of electronic local environment. For the Mo K-edge XANES spectra, the profile of NNMMO is different from the MoO3 reference, indicating that the successful doping of Mo6+ in NNMMO (Fig. S6 in Supporting information). Fig. 2b displays the Mn K-edge XANES spectra of both NNMO and NNMMO, which are almost identical with each other, suggesting that the Mo6+ doping has no effect on Mn valence. From the above XANES results, we confirmed the average valences of Ni, Mn and Mo are +2, +4 and +6, respectively [11,12]. The corresponding extended X-ray absorption fine structure (EXAFS) spectra of Ni and Mn K-edge show two peaks at about 1.5 and 2.2 Å, which are related to TM-O and TM-TM coordination shells (TM = Ni/Mn/Mo) (Figs. 2c and d), respectively. The Ni-TM and Mn-TM coordination shells display lower coordination for NNMMO compared with NNMO, suggesting that the Mo-doping into the transition metal layers causes more disordered structures, consistent with the multiple sites of Mo, Ni and Mn [13–16]. Furthermore, X-ray photoelectron spectroscopy (XPS) was employed to identify the metal valence states in the as-prepared samples. From Fig. 2e and Fig. S7 (Supporting information), it can be observed that for the Mo 3d spectrum of NNMMO, the peaks at 232.6 and 235.7 eV correspond to Mo6+ (Fig. 2f) [17]. While in the O 1s spectrum, the peak located at 531.2 eV can be attributed to the Mo-O bond, indicating that the successful Mo-doping [18].
Figure 2
Figure 2.
XAFS characterization of NNMO and NNMMO. (a, b) Ni, Mn K-edge XANES spectra. (c, d) Corresponding Ni, Mn K-edge EXAFS spectra. (e) XPS survey spectra. (f) Mo 3d XPS spectrum of NNMMO.
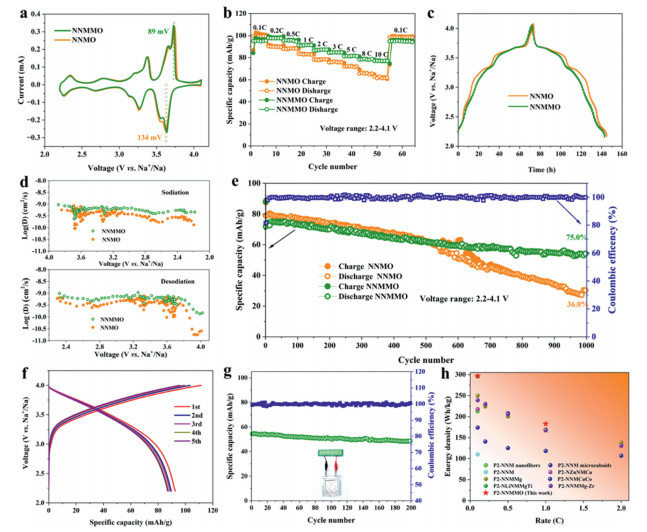
The electrochemical performances of as-prepared NNMO and NNMMO were consistently tested at the same condition. Fig. 3a compares the cyclic voltammetry (CV) curves at a scan rate of 0.2 mV/s. Four pairs of redox peaks were observed at 3.13/3.20, 3.27/3.37, 3.55/3.65 and 3.64/3.72 V, corresponding to Ni2+/Ni3+, Ni3+/Ni4+ and Na+/vacancy ordering in sodium layers [19], while the redox peaks below 2.5 V can be indexed to the redox reaction of Mn3+/4+ [20]. Indeed, Mo doping can efficiently reduce the polarization voltage (ΔV) from 134 mV to 89 mV between adjacent anodic and cathodic peaks. The galvanostatic charge/discharge (GCD) curves of NNMO and NNMMMO at 0.1 C (1 C = 150 mA/g) are presented in Fig. S8 (Supporting information). The curves of NNMMO cathode is almost coincident, suggesting that Mo-doping improves the reversible capacity retention. The rate performance comparison of NNMO and NNMMO are depicted in Fig. 3b and Fig. S9 (Supporting information), NNMMO can deliver reversible discharge capacities of 91.5, 87.2, 85.0, 81.5, 78.7, and 77.2 mAh/g at 0.5, 1, 2, 5, and 10 C within the potential range of 2.2–4.1 V, respectively, which are higher than that of NNMO. Moreover, NNMMO demonstrates a superior rate capability of 58.5 mAh/g at 30 C, which is much higher than that of NNMO (11.8 mAh/g) (Figs. S10 and S11 in Supporting information), originating from the key role of Mo6+ in modulating the local structure of NNMO. The galvanostatic intermittent titration technique (GITT) (Fig. 3c) is conducted to evaluate the Na+ diffusion kinetics in NNMO and NNMMO cathodes, and the Na+ diffusion coefficients of NNMMO are much higher than those of NNMO during the charge/discharge process (Fig. 3d). According to calculations, the average Na+ diffusion coefficient (DNa) of NNMMO is about 5.48 and 5.42 × 10⁻¹⁰ cm2/s during the charge/discharge process [21,22]. The three decreasing trends of Na+ diffusion coefficients during the desodiation/sodiation process correspond to the redox reaction of NNMO, which is consistent with the CV curves [23,24]. As expected, the calculated DNa value of NNMMO exhibits little fluctuation at different potentials compared to NNMO.
Figure 3
Figure 3.
Electrochemical performance of NNMO and NNMMO. (a) Cyclic voltammetry curves at 0.2 mV/s. (b) Rate performance comparison at voltage range of 2.2–4.1 V. (c) GITT curves at 0.1 C. (d) Corresponding calculated DNa+ from GITT curves. (e) Cycle performances at 1 C. (f) Voltage profiles of NNMMO||HC full-cell at 0.1 C. (g) Cyclic stability at 1 C. (h) Energy density of NNMMO compared with other previous reports.
The cycling performances of NNMO and NNMMO at 1 C (voltage range of 2.2–4.1 V) are compared in Fig. 3e and Fig. S12 (Supporting information). NNMMO demonstrates a superior capacity retention. After 1000 cycles, its discharge capacity still maintains 75% of the primary capacity, while it is only 36% for NNMO. The fast capacity decay of NNMO is mainly because of the pronounced volume variation at deep desodiation state with the detrimental phase transition and the Jahn-Teller effect of Mn3+ in MnO6 octahedral. These results reveal that Mo-doping could effectively improve the stability of NNMO during the sodation-desodation process. Additionally, in situ electrochemical impedance spectroscopy (EIS) is employed to assess internal resistance changes. The fitting Nyquist plots of NNMO and NNMMMO are shown in Figs. S13a and b (Supporting information) based on inset equivalent circuits. The depressed semicircle in the high-frequency region is composed of electrolyte resistance (Rs), cathode electrolyte interface resistance (Rcei) and charge transfer resistance (Rct) [25–27]. The fitting results of Rcei and Rct during the desodiation/sodiation process are plotted in Fig. S13c (Supporting information). The lower values of Rsei for NNMMO imply that the thinner thickness of the cathode electrolyte interface (CEI) layer was formed. The charge transfer impedance of both NNMO and NNMMO decreases gradually during the charge process because of the increase of the electrostatic repulsion of adjacent oxygen and the expansion of the layer spacing, which leads to the smooth and rapid migration of Na+ [23]. Moreover, the Mo-modified sample displays a much lower Rct than that of NNMO over the whole voltage range of charge-discharge process. The result indicates that Mo6+ substitution is beneficial for the interfacial stability and conductivity of electrode. Full pouch-cell with NNMMO cathode and commercial hard carbon (HC) anode was assembled to demonstrate practicability [28]. As shown in Fig. 3f, the NNMMO||HC full cell exhibits an initial specific reversible capacity of 92.4 mAh/g. The average operating voltage to reach about 3.45 V with an energy density of 296.7 Wh/kg, which is calculated based on the total mass of cathode and anode. More importantly, the full battery features excellent cycling performance with high capacity retention of 89.9% at 1 C after 200 cycles (Fig. 3g). A "NNMMO" logo with green LED lamps can be successfully lit by soft pack full-cell (inset of Fig. 3g). Fig. 3h demonstrates that the full battery constructed by NNMMO cathode display superior energy density both at 0.1 C and 1 C compared with other previous reports for P2-type cathodes, suggesting the potential for the practical applications. Based on the results, Nb5+ and Ta5+ are also considered to introduce into NNMO. The corresponding SEM images (Figs. S14 and S15 in Supporting information) display that the same morphology with NNMO, indicating that Nb5+- and Ta5+-doping do not change the morphology. Specially, the EDS and corresponding atomic contents are displayed in Fig. S16 (Supporting information), revealing that the successful doping of Nb5+ and Ta5+. The rate performance at different voltage ranges is tested and shown in Fig. S17 (Supporting information), and both samples exhibit superior rate capability.
To understand the high reversibility and structural evolution during the charge/discharge process, in situ XRD measurements were carried out between 2.2 V and 4.1 V (Figs. S18a and b in Supporting information). It can be seen that as Na+ is being extracted, the (002) and (004) peaks gradually shift leftward, whereas the (100) and (102) peaks monotonically shift rightward, indicating the expansion of c axis and contraction of ab plane due to the oxidation of TM ions. In addition, these peaks can shift back to their original positions after discharge process, which manifest that the structure of NNMMO is highly reversible. Note that no additional diffraction peaks can be observed after three cycles, suggesting that a complete solid-solution behavior for NNMMO [29,30]. The detailed lattice parameters variation determined from the in situ XRD patterns is displayed in Fig. S18c (Supporting information). The change ratio of a and c is about 1.19% and 1.53%, respectively. The maximal unit cell volume change of NNMMO is only 1.02%, which is far less than the previous reports [20,31]. Apparently, Mo6+-doping can enhance the lattice structural stability and suppress the phase transformation, achieving ultra-low volumetric changes toward a zero-strain cathode (Fig. S18d in Supporting information).
To further explore the Mo6+ substituion effect on the local structure changes, we performed ex situ XAFS spectra under different charge/discharge states. The Ni K-edge XANES spectra show a significant shift to higher energy compared to the pristine electrodes after charging to 4.1 V, which is recovered to the original position, indicating that Ni has a high redox reversibility with Ni2+/Ni3+/4+ for NNMMO (Fig. S19a in Supporting information) [32,33]. By comparison, Mn and Mo K-edge XANES spectra do not demonstrate any change, suggesting that Mn4+ and Mo6+ are electrochemically inactive in the range of 2.2–4.1 V (Figs. S19b and S20 in Supporting information). The corresponding EXAFS spectra of NNMMO are shown in Figs. S19c and d (Supporting information), where the first peak at the 1.5 Å and second peak at 2.5 Å represent the TM-O and TM-TM bonds, respectively. When discharged to 2.2 V, the TM-O and TM-TM coordination strengths return to their pristine level, indicating that NNMMO has a high structural stability during the desodiation/sodiation process [34]. The result suggests that the incorporation of Mo helps alleviating the evolution of local environment of nickel and restrain irreversible migration of cations from transition metal layers [35,36].
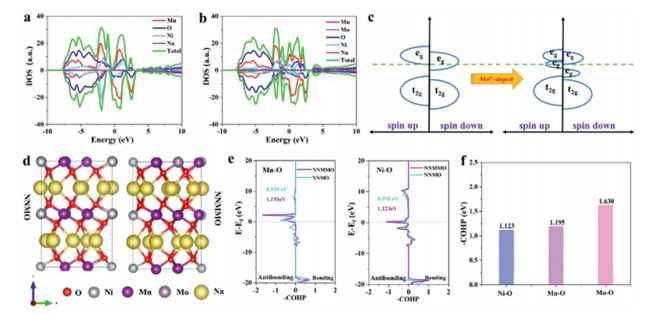
To further investigate the effect of Mo6+-doping on microstructural evolution for NNMO over cycling, ex situ XRD characterizations after 200 cycles at 1 C were performed. As shown in Fig. S21 (Supporting information), NNMMO demonstrates no characteristic peak at 11.6°, which suggests Mo incorporation could improve the air stability of NaxTMO2 by exchanging Na+ with H+ [10,37]. Moreover, no P2’ phase can be observed, indicating that the crystalline is well sustained after 200 cycles. TEM is applied to analyze microstructure changes before and after cycling (Fig. S22 in Supporting information). It is clearly observed that the bulk structure remains almost unchanged and amorphous layer forms on the surface with a thickness of 2.5 nm. In contrast, NNMO suffers from a severe surface degradation, and thicker CEI film with a thickness of 5.2 nm is formed, which confirms that the Mo6+-doping suppresses the water molecules from inserting into the crystal lattice and structural distortion during the cyclic process. To explore the influence of Mo infusion on the intrinsic electronic structure of NNMO, density functional theory (DFT) calculations were implemented. Figs. 4a and b show the density of states (DOS) for NNMO and NNMMO. The states of Mo-doped cathode shifted toward lower energy level, benefiting from the additional electrons and enhanced electron localization [38,39]. Interestingly, it can be observed that the Mn eg orbital splits into two peaks for spin up and spin down, respectively. Notably, one of them moves below the Fermi level after Mo-doping (Fig. 4c and Fig. S23 in Supporting information), suggesting the enhanced electronic conductivity. The crystal orbital Hamilton population (COHP) calculation is applied to investigate the effect of Mo-doping on TM-O bonds strength (Fig. 4d). The comparison of Ni-O and Mn-O bonds strength in NNMO and NNMMO was displayed in Fig. 4e. The COHP analysis indicates that the introduction of Mo6+ enhances the Ni-O (0.998 eV vs. 1.123 eV) and Mn-O (0.939 vs. 1.195 eV) bond strengths. It is well known that larger value of –COHP indicates stronger TM-O bond and higher stability of crystal structure. Furthermore, the TM-O bond energies in NNMMO are provided in Fig. 4f. It is apparent that the introduction of stronger Mo-O (1.630 eV) improves the electrochemical cyclic stability of NNMMO during the desodiation/sodiation process, which is consistent with the results of in situ XRD, ex situ XAFS and long-cycle test [40].
Figure 4
Figure 4.
Theoretical investigations on the effect of Mo-doping in NNMO. (a) Total density of states (DOS) for NNMO and (b) NNMMO cathode. (c) Schematic pDOS of NNMO and NNMMO. (d) The optimized structures of NNMO and NNMMO. (e) Comparison of COHP values of Ni-O and Mn-O bonds after Mo-doping. (f) COHP results of NNMMO.
In summary, we demonstrate a pinning effect strategy by introducing high-valence Mo6+ into P2-type NNMO for high-performance SIBs. Owning to its structural compatibility, the Mo-doping is demonstrated to greatly enhance the structure reversibility and Na+ diffusion kinetics, leading to superior rate capability and cyclic stability. Specially, a reversible capacity of 77 mAh/g at 30 C and a capacity retention of 75% at 2 C after 1000 cycles can be obtained. In situ XRD verifies that NNMMO has persistent structural stability and achieves an ultra-low volume change (1.04%) during the Na+ (de)intercalation process. Ex-situ XAFS and TEM confirm that the Mo-doping induces the formation of a stable CEI film and restrains the surface degradation, thus preventing parasitic reactions during the cyclic process. DFT calculations reveal Mo-doping into the lattice optimizes the energy band structure and engenders stronger TM covalent with O, thereby improving electrochemical performance. Our work clearly offers new insights into rational design of high-rate P2-type layered cathodes and help build practical SIBs with improved sustainability.
Declaration of competing interest
The authors declare that they have no known competing financial interests or personal relationships that could have appeared to influence the work reported in this paper.
This work is partly supported by the National Natural Science Foundation of China (Nos. 12275189 and 11705015), Natural Science Foundation of the Jiangsu Higher Education Institutions (No. 23KJA430001), Collaborative Innovation Center of Suzhou Nano Science & Technology. The authors thank BL13SSW of Shanghai Synchrotron Radiation Facility (SSRF) and BL 1W1B of Beijing Synchrotron Radiation Facility (BSRF) for providing the beamtime.
Supplementary materials
Supplementary material associated with this article can be found, in the online version, at doi:10.1016/j.cclet.2025.110993.
[1]
A. Rudola, R. Sayers, C.J. Wright, J. Barker, Nat. Energy 8 (2023) 215–218. doi: 10.1038/s41560-023-01215-w
[2]
N.T. Aristote, K.Y. Zou, A. Di, et al., Chin. Chem. Lett. 33 (2022) 730–742.
[3]
M. Yuan, H. Liu, F. Ran, Mater. Today 63 (2023) 360–379.
P.F. Zhou, Z.N. Che, J. Liu, et al., Energy Storage Mater. 57 (2023) 618–627.
[39]
C.L. Zhao, Z.P. Yao, Q.D. Wang, et al., J. Am. Chem. Soc. 142 (2020) 5742–5750. doi: 10.1021/jacs.9b13572
[40]
Z.H. Wu, Ni Y. X, S. Tan, et al., J. Am. Chem. Soc. 145 (2023) 9596–9606. doi: 10.1021/jacs.3c00117
Figure 1
Structural characterization of NNMO and NNMMO. (a, b) Rietveld refinement patterns of NNMO and NNMMO. (c) Schematic diagram of the crystal structure of NNMMO. (d, e) TEM and HRTEM images of NNMMO. (f) EDS mapping images of NNMMO.
Figure 3
Electrochemical performance of NNMO and NNMMO. (a) Cyclic voltammetry curves at 0.2 mV/s. (b) Rate performance comparison at voltage range of 2.2–4.1 V. (c) GITT curves at 0.1 C. (d) Corresponding calculated DNa+ from GITT curves. (e) Cycle performances at 1 C. (f) Voltage profiles of NNMMO||HC full-cell at 0.1 C. (g) Cyclic stability at 1 C. (h) Energy density of NNMMO compared with other previous reports.
Figure 4
Theoretical investigations on the effect of Mo-doping in NNMO. (a) Total density of states (DOS) for NNMO and (b) NNMMO cathode. (c) Schematic pDOS of NNMO and NNMMO. (d) The optimized structures of NNMO and NNMMO. (e) Comparison of COHP values of Ni-O and Mn-O bonds after Mo-doping. (f) COHP results of NNMMO.

 DownLoad:

 下载:
下载:


