Citation:
Hao Hu, Jiacheng Wang, Si Zhang, Ben Zhang, Cuinan Jiang, Hong Tian, Xunxin Gu, Yang Sheng, Zhenghuan Zhao, Meng Li, Lu Zheng, Jing Li. Hierarchical and flexible electrode with precise H2-production for in vivo liver cancer therapy[J]. Chinese Chemical Letters,
2025, 36(12): 110866.
doi:
10.1016/j.cclet.2025.110866
Hierarchical and flexible electrode with precise H2-production for in vivo liver cancer therapy
English
Hierarchical and flexible electrode with precise H2-production for in vivo liver cancer therapy
Department of Hepatobiliary Surgery, Second Affiliated Hospital, Army Medical University, Chongqing 400038, China
b.
MOE Key Laboratory of Low-grade Energy Utilization Technologies and Systems, CQU-NUS Renewable Energy Materials & Devices Joint Laboratory, School of Energy & Power Engineering, Chongqing University, Chongqing 400044, China
c.
Southwest Technology and Engineering Research Institute, Chongqing 400039, China
d.
Jiangsu Key Laboratory of Environmentally Friendly Polymeric Materials, School of Materials Science and Engineering, Changzhou University, Changzhou 213164, China
e.
College of Basic Medical Sciences, Chongqing Medical University, Chongqing 400016, China
xqyylj@163.com (J. Li). 1 These authors contributed equally to this work.
Received Date:
03 November 2024 Accepted Date:
15 January 2025 Revised Date:
14 January 2025 Available Online:
15 December 2025
Abstract:
Liver cancer is a major killer threatening human health worldwide. At this stage the clinical choice to the treatment of liver cancer is a combination of surgery, chemotherapy and radiotherapy. Alternatively, using hydrogen to treat cancer has great prospects and development space. Herein, we fabricated a hierarchical and flexible electrode that being able to continuously generate hydrogen in vivo in the deep abdominal liver through efficient water electrolysis to kill tumor cells and regulate the tumor microenvironment. The flexibility of the electrode facilitated to fit the tumor surface and thus improved the contact area of hydrogen therapy. By in situ growth of molybdenum disulfide on a hierarchical carbon skeleton, improved reaction kinetics and smaller impedance with a low overpotential of 1.02 V at −10 mA/cm2 in cell culture medium and Tafel slope of 73 mV/dec were achieved. Animal experiments showed that the electrode could effectively inhibit the growth of human hepatocellular carcinoma cells in nude mice by efficient H2-production in vivo. The apoptosis rate of cancer cells reached 81.8%, and the proliferation rate decreased to 3.39%. Moreover, this treatment does not affect the growth of normal hepatocytes according to the results of cell experiments. This study demonstrated that the in vivo hydrogen production by our flexible electrode is a safe and effective treatment for liver cancer, with the advantages of minimal invasiveness, simple operation, low side effects and low cost.
Liver cancer is the sixth most prevalent form of cancer globally, with its incidence on the rise worldwide [1]. It is projected that by 2025, over one million individuals will be affected by liver cancer annually [2]. In China, the most populous country, the number of cases has reached a staggering 18.3 per 100, 000 residents [3]. Its high fatality rate positions it as the fourth leading cause of cancer-related deaths worldwide [1]. The primary risk factors for hepatocellular carcinoma (HCC) include hepatitis B virus (HBV), hepatitis C virus (HCV), obesity, excessive alcohol consumption, and aflatoxin exposure among others [4]. Additionally, primary cholangitis cirrhosis, hyperpigmentation, α1-antitrypsin deficiency and other diseases can also contribute to the development of HCC [2].
Unfortunately, the current treatment options for liver cancer are limited, necessitating consideration of the patient's hepatic function, physical condition, and stage of liver cancer at detection [5]. Surgical resection is typically the preferred treatment for early-stage liver cancer when one or more tumors are confined to the liver. However, despite surgical intervention, the recurrence rate among HCC patients remains high [5–7]. Liver transplantation has emerged as a strategy that effectively reduces postoperative recurrence; however, it is not suitable for most HCC patients due to stringent requirements regarding donor and recipient liver function as well as staging of the disease [8,9]. Targeted therapy has emerged as a novel approach in liver cancer treatment. Sorafenib, being the first-line drug in targeted therapy, simultaneously acts on tumor tissue and abnormal blood vessel proliferation [10,11]. However, sorafenib is associated with significant drug resistance and side effects while exhibiting a low objective response rate (OR) of only 2% [12]. Despite recent discoveries of new therapeutic targets, clinical trials still report a median progression-free survival (PFS) of less than 1 year for primary liver cancer patients [13,14].
The current treatment methods are unsatisfactory in improving the survival rate of patients. However, surgical trauma, systemic toxicity, and drug resistance associated with long-term use of therapeutic drugs contribute to poor prognosis, reduced survival time, and increased risk of recurrence for patients undergoing these traditional treatments [15,16]. Therefore, there is a need for effective, cost-efficient, and targeted therapies that can enhance the therapeutic effect of HCC while minimizing treatment-related toxicity. In this context, non-drug therapies, such as local hyperthermia [17,18] and gas therapy [19,20], hold significant prospects and development potential.
In 2007, Ohsawa et al. found that hydrogen dissolved in cell-free systems at different concentrations could selectively remove hydroxyl radical (•OH) and nitric peroxide anion (ONOO−) effectively, showing strong antioxidant effect without affecting hydrogen peroxide (H2O2) and nitric oxide (NO) as well as the ultra-oxygen anion groups (•O2−), which is a reactive oxygen species (ROS) of great importance in physiological functions [21]. Hydrogen, being a low molecular weight gas, possesses the ability to rapidly permeate through physiological barriers and cell membranes within the body, thereby exhibiting significant potential for gas therapy. Numerous studies have demonstrated that hydrogen can effectively decelerate the onset and progression of inflammation, facilitate tissue regeneration, regulate lipid metabolism and glucose metabolism, as well as exert biological effects such as anti-apoptosis and anti-aging properties [22–24].
Furthermore, recent years have witnessed the affirmation of hydrogen's role in cancer treatment [25–28]. The therapeutic mechanism of hydrogen for cancer remains unclear, some scientists found that hydrogen not only change the local tumor microenvironment through redox reactions, but also play an antitumor role by activating caspase-independent apoptotic pathways and reducing lipid oxidation [29]. But other scientists believe that H2 is used to change the structure of proteins by affecting the water cooperation of biomolecules [30]. It has also been found that hydrogen may induce systemic immune response while treating tumors. Cytotoxic T lymphocytes (CTLS) generated in the hydrogen treatment group increased more in distal metastases than that without hydrogen therapy achieving the purpose of preventing or treating tumor metastasis [24]. Although more extensive research is required to elucidate the mechanisms by which H2 exerts its various biological functions, numerous studies have suggested that H2 has the potential for therapeutic and prophylactic uses. No adverse effects have been observed with H2, even at higher concentrations for an extended time [31,32]. Its anti-tumor ability makes it possible to use hydrogen in the treatment of HCC.
However, no enzyme has been found to produce hydrogen in the human body yet, while merely a small amount of hydrogen may be produced by gut bacteria via breaking down carbohydrates, which is far from sufficient for hydrogen treatment. Therefore, current hydrogen treatment is limited to oral administration of hydrogen-rich water or inhalation of hydrogen [33–35]. Such a low utilization of hydrogen cannot achieve either targeted therapy or precisely controlled release. It was also noticed that as an inflammable and explosive gas, hydrogen has certain risks in transportation and use. Thus, the application of hydrogen in clinical work is limited greatly. To address the limitations mentioned above, one promising way to achieve the effect of hydrogen therapy is to produce hydrogen in vivo by electrolysis of water that is abundant in the body. A few researchers have made explorations by developing certain materials or devices for in vivo hydrogen production and application [36–41]. These therapeutic devices can generate hydrogen and related by-products for tumor treatment by hydrolysis or electrolysis of water. However, due to its instability of curative effect and tough implement in the body of its treatment conditions, the application of these new treatments there are great limitations.
In fact, electrocatalytic hydrogen evolution reaction (HER) is an important semi-reaction for water splitting to produce high-quality hydrogen. In the field of energy, electrocatalytic water splitting to produce hydrogen is a promising renewable energy conversion and storage technology, in which hydrogen can not only be used as fuel for hydrogen fuel cells and engines, but also as an important chemical raw material for ammonia production [42–44]. Especially, high-performance catalytic electrodes are most crucial aspect in the process of HER, and various noble metal substitutes, earth-abundant layered transition metal dichalcogenides (TMDs), such as molybdenum disulfide (MoS2), have attracted tremendous attention as potential HER catalysts [45–51].
In particular, the hydrogen adsorption free energy of its marginal sites is similar to that of nitrogen fixing enzymes that can catalyze HER efficiently in nature, which has great potential [52,53]. However, as a semiconductor, molybdenum disulfide has low electrical conductivity, which affects its performance as an electrocatalyst [54,55]. Moreover, due to its serious self-accumulation and agglomeration characteristics, its marginal sites cannot be effectively exposed in HER process [56]. Therefore, molybdenum disulfide needs to be combined with carbon cloth (CC) [57], graphene [58] and other conductive materials [59–61] to enhance its conductivity and effective edge sites to enhance its ability as HER electrocatalyst [46]. Inspired by the prominent catalytic property of MoS2, we propose to design a biocompatible electrode to achieve highly efficient and controllable in vivo H2-production for hydrogen therapy.
In order to increase the contact area with controllable in vivo H2-production at the liver lying deep within the abdominal cavity, CC as a flexible material with excellent electrical conductivity is chosen as a suitable candidate of catalytic electrode for HER [62,63]. Considering that tumor cells are at the micrometer scale, it is necessary to find a micro-nano catalyst that can produce hydrogen to achieve maximum therapeutic effect. Since the CC provides abundant surface-active adsorption sites, the catalytic ability of its HER can be further improved by combining with molybdenum disulfide to increase the efficiency of hydrogen production [55–57,61].
In this study, molybdenum disulfide was grown in situ using a hierarchical carbon skeleton as a carrier to form an ultra-thin and hierarchical nanosheet electrode MoS2@ hierarchical carbon skeleton (CPY) (MOC). The hierarchical carbon skeleton consists of flexible CC and carbon nanowire (CNw), a conductive polymer branch growing vertically on it. The in situ grown MoS2 showed a nano-flower shape in a unique way, which significantly expanded the surface area involved in the reaction, to expose more edge active sites and enhance its electrical conductivity [48]. MOC was covered on the surface of liver tumor tissue to closely contact with tumor cells using surgical sutures by minimally invasive surgery, and connected with a conductive wire out of the body to achieve the therapeutic effects of electrizing in vitro and precise H2-production in vivo.
The TMDs MoS2 HER material exhibits low energy consumption and high efficiency in hydrogen production. Moreover, the flexible nano-electrode of MOC can conform well to tumor tissue, while the microscopic nano-needle design enhances interaction with tumor cells for targeted and controllable in situ hydrogen therapy.
The MOC nanosheet applied in this paper is prepared using electrodeposition method, in general, polypyrrole was deposited and grown on CC, followed by carbonization at high temperature in nitrogen to obtain a multistage carbon skeleton (Fig. S1 in Supporting information). Molybdenum disulfide was then vertically grown on the hierarchical carbon skeleton by hydrothermal method in order to increase the effective area of HER reaction, the conductivity of molybdenum disulfide, and expose as many active sites of molybdenum disulfide as possible. The thickness of the MOC is approximately ~0.5 mm, which is essentially equivalent to the thickness of the CC substrate. This relatively thin thickness and good flexibility facilitate effective adherence of the electrode to the tumor site.
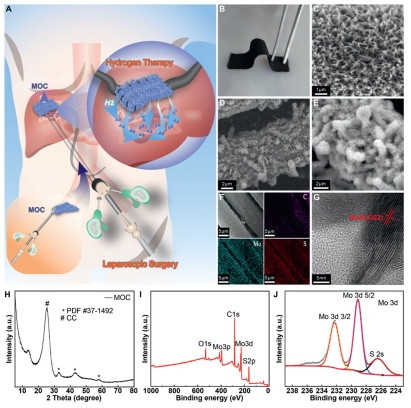
Because of the deformability of CC, the nanosheets we get are flexible. Relying on the flexibility of the material, we can apply it to clinical treatment through minimally invasive surgical methods (Figs. 1A and B). The MOC is fixed on the liver by laparoscopy, and the lead is fixed outside the body, so that long-term gas therapy can be carried out. What is more, hydrogen can production can be carried out with minor voltage, so the treatment time and frequency can be reasonably controlled by portable power supply or battery to achieve the effect of out-of-hospital treatment. Moreover, the process of treatment is safe and convenient, which can reduce the burden of postoperative rehabilitation and follow-up treatment greatly. Hydrogen therapy is not only suitable for adjuvant therapy after early-stage liver cancer resection, but also suitable for patients with advanced liver cancer who have no chance of surgery.
Figure 1
Figure 1.
Macroscopic and microscopic morphology and surface characteristics of MOC. (A) As a flexible material, it can be used in vivo through minimally invasive surgical methods. (B) MOC has good flexibility and shaping properties. (C) Scanning electron microscope (SEM) image of surface morphology of CPY. (D, E) SEM images of surface morphology of MOC at different magnification. (F) Energy dispersive spectrometer (EDS) mapping of MOC. (G) TEM image of MOC. (H) The XRD pattern of MOC. (I) The full XPS spectrum of MOC. (J) High-resolution XPS spectra of Mo 3d.
Generally, this treatment method takes advantage of the flexibility of the CC and attaches MOC tightly to the surface of organs, avoiding the risk of organ bleeding and tumor cell spread due to the destruction of the tumor capsule. Reducing abdominal tissue trauma and bleeding is also beneficial to prevent postoperative intestinal adhesion. It also increases the area of H2 reaction with tumor cells. Since its essence is to achieve the purpose of treatment by precise H2-production in vivo, MOC outside the liver capsule also does not increase the risk of liver fibrosis. Besides, it can be extended to other types of tumor treatment or adjuvant therapy by changing the shape of MOC.
Increasing the catalyst's overall active area, reaction kinetics, and charge mass transfer impedance are all priorities in our work. A three-dimensional hierarchical structure can be observed by scanning electron microscopy. Nanoscale carbon needle arrays were grown on smooth carbon fiber substrates (Fig. 1C). These carbon needle arrays are electrochemically coated tightly on a bare carbon fiber substrate, providing favorable anchor sites for subsequent catalyst loading. These nanofibers demonstrate needle-like and cross-linked structure, forming a three-dimensional porous multilayer. We used carbon needle array as the substrate to deposited MOC catalyst through hydrothermal, carbonization and other experimental methods (Figs. 1D and E). The surface of the hierarchical carbon skeleton provides a large number of anchor points for molybdenum disulfide and a channel for electron transport. EDS mapping was also performed on the synthesized catalyst MOC, showing elements such as Mo, S and C are uniformly dispersed on the electrode surface (Fig. 1F). Representative transmission electron microscopy (TEM) image of MOC shows the interplanar spacing of 0.63 nm, which corresponds to the (002) crystal plane of 2H-MoS2 (Fig. 1G).
The crystal structures of MOC samples are characterized by X-ray diffraction (XRD). As shown in Fig. 1H, the XRD patterns of MOC samples display phases CC and MoS2, denoted by "#" and "*" respectively. Peaks located at 14.4°, 32.7°, 33.5°, 44.1°, and 58.3° can be identified as (002), (100), (101), (006), and (110) planes of 2H-MoS2 (ICDD-PDF #37-1492) [45,60].The presence of characteristic peaks of MoS2 confirms its successful synthesis. Furthermore, the samples always show characteristic peaks of 2H phase graphite due to the presence of CC in all samples. The surface elemental composition and valence state of the as-fabricated samples were determined via X-ray photoelectron spectroscopy (XPS), and the electronic interaction at the catalyst interface was investigated using the difference in binding energies of each element. The Mo 3d orbitals divide into a pair of Mo 3d3/2 and Mo 3d5/2 in pure sample MoS2, with binding energies of 232.5 and 229.36 eV, correspondingly, which belongs to the Mo4+ in MoS2. However, some small satellite peaks occur around 233 and 235 eV, primarily due to Mo6+ produced by oxidation of the MoS2 surface. There is a small peak at the lower binding energy of 226 eV, which is the S 2s orbital (Figs. 1I and J).
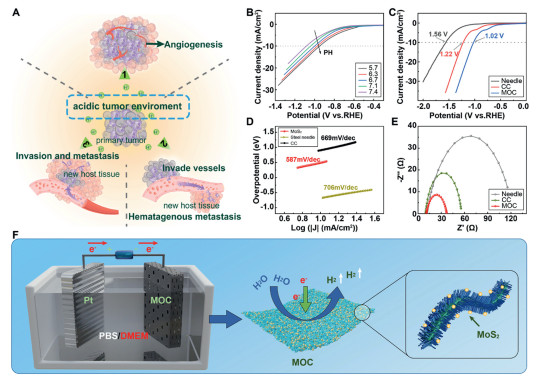
Due to vigorous metabolism and abnormal ion exchange, the body fluid environment of tumor cells is slightly acidic [64–67]. The body fluid pH of different tumor cells is 6.0–7.0 [68]. The acidic microenvironment promotes angiogenesis in tumor tissue, further increases the blood supply of tumor tissue, and accelerates the growth and development of tumor cells [69]. Moreover, the acidic environment also helps tumor cells to invade the blood vessel wall, allowing them to enter the blood stream and undergo hematogenous metastasis. The acidic tumor microenvironment can also help tumor cells to invade and metastasize in healthy target tissues (Fig. 2A) [64]. In addition, the hypermetabolic state of HCC cells causes local hypoxia of liver tissue, which further stimulates the synthesis of angiogenic factors and accelerates the invasion and metastasis of HCC cells [70,71]. By carrying out HER in the tumor site, the generated hydrogen and oxygen can synergistically regulate the balance of redox reactions in the tumor site to improve the local acidic microenvironment and hypoxia of the tumor.
Figure 2
Figure 2.
Hydrogen evolution performance of MOC in different environments. (A) Mechanisms by which a micro acidic environment promotes tumor growth and metastasis. (B) Hydrogen evolution capacity of MOC in DMEM with different pH. (C) Comparison of hydrogen evolution ability of CC, NEEDLE and MOC in DMEM (pH 7.4). (D) Taphil slope of CC, NEEDLE, MOC. (E) EIS of CC, NEEDLE, MOC. (F) Schematic diagram of the operation of hydrogen evolution of MOC in different electrolytes.
In order to better simulate the crystal and colloid environment in vivo, Dulbecco's modified eagle medium (DMEM) and phosphate buffer saline (PBS) were used as electrolytes to test the hydrogen evolution ability of MOC under different pH conditions (Fig. 2B and Fig. S2 in Supporting information). Experiments show that the hydrogen evolution capacity of MOC is increased under acidic conditions in both crystal and colloid electrolytes. As acidic electrolyte increases, the corresponding hydrogen evolution performance also will increase. This is more beneficial for MOC to produce more hydrogen for treatment under the acidic environment of the tumor.
Based on the consideration of clinical application, steel needle and CC were selected as working electrodes respectively for comparative discussion with MOC. Foil electrode and Ag|AgCl electrode are used as counter electrode and reference electrode. The Needle electrode shows the worst HER performance with an overpotential of 1.56 V at −10 mA/cm2 in DMEM (Fig. 2C). However, the overpotential of CC and MOC was 1.22 and 1.02 V, respectively under the same reaction conditions. This activity trend is due to the different surface areas of the reaction and materials. The overpotential of MOC is lower than that of CC and steel needle, which makes MOC nanoelectrodes have greater advantages when used for hydrogen treatment.
Tafel slope of the catalyst is an important kinetic parameter. The pure substances CC and steel needle have Tafel slopes of 669 and 706 mV/dec, respectively (Fig. 2D). MOC exhibits the smaller Tafel slope of 73 mV/dec which means faster reaction kinetics. In addition, electrochemical impedance spectroscopy (EIS) is utilized to further study the kinetics of the HER interface reaction. In Nyquist plots, the diameter of the semicircles in the high-frequency region reflects the charge transfer resistance (Rct). It represents the resistance of charge transfer between electrolyte and electrode interface and is an important electrode kinetic parameter. The MOC exhibits the lowest Rct and the fastest reaction rate, consistent with the LSV and Tafel slope results, presenting a much lower charge-transfer resistance than those of pure CC and steel needle (Fig. 2E).
It can be seen that the Rct of MOC nanosheets has been significantly improved through the action of hierarchical carbon skeleton. Besides, MOC nanosheets is actually a kind of microscopic three-dimensional and hierarchical structure, which not only increases the surface area of the reaction greatly, but also fully exposes the active site of molybdenum disulfide, further enhancing the hydrogen evolution ability of MOC nanosheets (Fig. 2F).
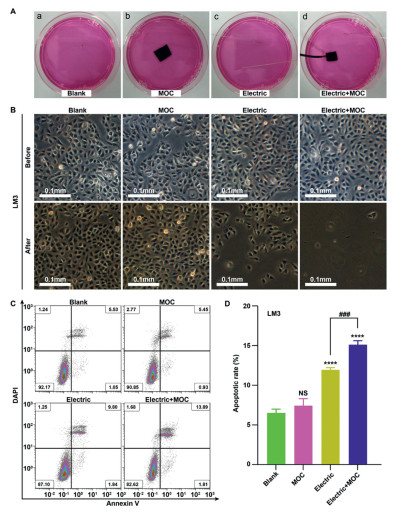
In this study, hepatoma cells and hepatocytes cultured in vitro were divided into four groups to investigate the effects of MOC nanosheets, electrification, and H2-production on cells (Fig. 3A).
Figure 3
Figure 3.
Cell experiments. (A) Cells were divided into four groups: (a) Control group without any treatment; (b) Cells were incubated with MOC; (c) Electrifying the cells with a steel needle; (d) Cells were electrified with MOC. (B) Comparison of the results of four groups of cells after experiments. Scale bar: 0.1 mm. (C) After experimental treatment, the cells were collected for flow cytometry analysis. (D) The apoptosis rate of the four groups of cells. Data are presented as mean ± standard error of mean (SEM) (n = 3). NS, not significant vs. blank group. ****P < 0.0001 vs. blank group. ###P < 0.001.
Microscopic images showed the comparison of the number and morphology of HCC cells in each group under inverted optical microscope before and after experimental intervention (Fig. 3B). The growth of liver cancer cells in blank group and MOC group was not affected significantly after the experimental interference. HCC cells in electric group showed obvious cell death in the hydrogen producing cathode, but the number of tumor cells that died was not as high as in the electric + MOC group. The analysis of flow cytometry has also confirmed the experimental results (Fig. 3C), it can be seen that the death rate of liver cancer cells in the electric + MOC group reached 15.70% (Fig. 3D). The apoptosis rate of the four groups of cells confirmed that MOC nanosheet itself had no effect on the growth of tumor cells without electricity. The simple electrification will still have a certain impact on the growth of tumor cells because of the inevitable HER. By contrast, MOC nanosheet can promote the death of liver cancer cells significantly as more H2-production by HER.
It is worth noting that the hydrogen treatment of MOC was conducted in a petri dish, with the cathode and anode areas clearly demarcated. The microscopic observations presented exclusively depict HCC cells located at the cathode region, where they were extensively exposed to a substantial amount of hydrogen generated by the cathode (Fig. S3 in Supporting information). Consequently, the evident demise of LM3 cells occurred. This was also confirmed by calcein acetoxymethyl ester/propidium iodide (calcein-AM/PI) staining (Fig. S4 in Supporting information). In addition, the number and morphology of liver cancer cells did not change at the anode producing oxygen, indicating that the growth of liver cancer cells was not affected by the generated oxygen under the conditions of this experiment.
Conversely, other regions within the culture dish especially at the anode where oxygen is produced did not exhibit noticeable cell death due to limited exposure time and hydrogen concentration. Flow cytometry analysis revealed that even in the experimental group utilizing MOC electrolysis, only 15.7% of total cells throughout the culture dish exhibited cancer cell death. A significant number of viable HCC cells persisted during this restricted experimental duration. Multiple experiments showed that the number of dead HCCLM3 cells was positively correlated with the contact area between hydrogen and cells, and the oxygen produced by the anode had no significant effect on the growth of liver cancer cells.
After JC-1 staining (Fig. S5 in Supporting information), normal mitochondria showed red fluorescent monomers, while damaged mitochondria showed green fluorescent monomers. It was found that the electric + MOC group treated with hydrogen had significant changes in mitochondrial membrane permeability. This may be due to the inhibition of mitochondrial respiration of cancer cells by hydrogen to achieve the tumor-killing effect [70].
This work also performed experiments on normal growing hepatocytes (Fig. S6 in Supporting information). Under the microscope, there was no significant difference in cell morphology and number among the four groups after different experimental interventions, which was also confirmed by flow cytometry analysis. This indicates that MOC nanosheet materials, electrification, and HER are safe and have no effect on normal liver cells.
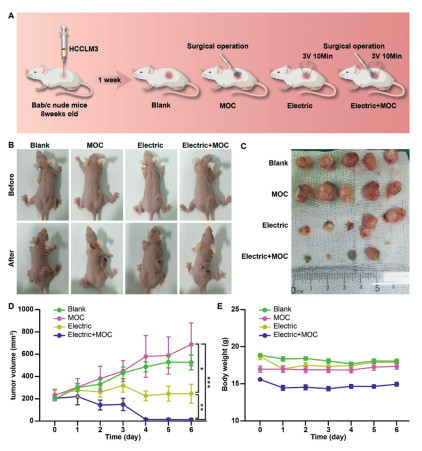
In order to inoculate human HCC cells in experimental animals successfully, the BALB/c nude mice (6–8 weeks old) with no thymus were selected. All experimental procedures were approved by the Institution (Laboratory Animal Welfare and Ethics Committee of the Army Medical University). Twenty BALB/c nude mice of similar tumor size were selected and divided into four groups randomly to investigate the effects of MOC nanosheet, electricity and HER on tumor growth in nude mice (Fig. 4A). During the experiments, the impact of surgery on tumor growth was minimized by protecting the blood supply to the tumor tissue as possible as we can.
Figure 4
Figure 4.In vitro animal experiments. (A) BALB/c nude mice inoculated with HCCLM3 were randomly divided into four groups for different experimental treatments. (B) Tumor changes in BALB/c nude mice before and after experimental treatment. (C) The actual size of the removed tumor after experimental treatment. (D) Tumor size over time. *P < 0.05, **P < 0.01, ***P < 0.001. (E) Curves of body weight over time in BALB/c nude mice. Data are presented as mean ± SEM (n = 5).
After a week of experimental intervention, the growth of tumors is observed by measuring their sizes every day (Figs. 4B and C). The growth of tumor of the blank group and MOC group were positively correlated with time (Fig. 4D). The growth of tumor in the electric group was somewhat limited, but it did not reduce completely. The tumor growth in the electric + MOC group was inhibited significantly and the tumor shrank gradually.
Statistical analysis showed that there were no significant differences in tumor's growth between the blank group and the MOC group, indicating that MOC nanosheet itself had no significant effect on tumor growth in mice. It also proved that surgery had little effect on tumor growth. On the contrary, the growth of tumor was inhibited significantly in both the electric group and the electric + MOC group, indicating that the interference of both groups had a significant therapeutic effect on the growth of tumor in mice because of the H2-production. It is worth noting that HER will also be generated in the process of electrocuting with the steel needle. The hydrogen produced is confined under the skin and has a therapeutic effect on tumor cells. However, the effectiveness of hydrogen treatment is limited by the small yield. This is a further indication of hydrogen generation is positive correlation with tumor treatment effect.
The body weight of the surgically treated mice decreased slightly, but remained stable throughout the treatment period (Fig. 4E). This indicates that treatment with MOC does not affect the growth and development of nude mice.
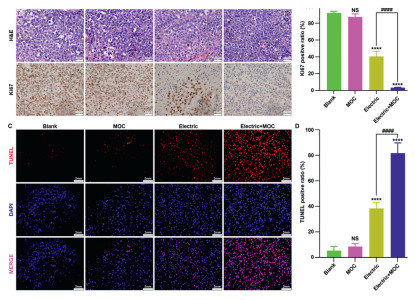
The observation was further confirmed by comparing the tumor tissues from each group. HE staining of the extracted tissue specimens confirmed that the extracted tissue was tumor tissue (Fig. 5A). Four groups of tumor tissues were stained with Ki67 to observe the proliferation of tumor cells (Figs. 5A and B). The proportion of Ki67 positive cells in the blank group and MOC group reached 92.01% and 87.36%, there are no obvious differences between the two groups, which means that MOC has little influence on the proliferation of tumor cells without electricity. Nevertheless, the proportion of Ki67 positive cells in the electric group reached 40.59%, which shows a decrease in proliferation of tumor cells. Furthermore, the positive proportion of electric + MOC group after HER treatment was decreased to 3.39% significantly lower than that of electric group.
Figure 5
Figure 5.
Immunohistochemistry of tumor tissue. (A) H&E staining and KI67 staining of tumor tissue. Scale bar: 40 µm. (B) The proportion of Ki67-positive cells in each group. (C) TUNEL fluorescence staining of tumor tissues. Scale bar: 2 mm. (D) The proportion of TUNEL-positive cells in each group. Data are presented as mean ± SEM (n = 4). NS and ****P < 0.0001 vs. blank group. ####P < 0.0001.
Terminal dexynucleotidyl transferase-mediated dUTP nick end labeling (TUNEL) fluorescence staining was performed on the tumor tissues to observe apoptosis of tumor cells (Figs. 5C and D). The percentage of TUNEL stained positive cells in blank group and MOC group was 5.30% and 8.54%, while that in electric group reached 38.43% and as high as 81.80% in electric + MOC group. Obviously, the apoptosis of tumor cells was significantly increased after HER.
It can be concluded that hydrogen produced by HER can effectively inhibit the proliferation of tumor cells and promote their apoptosis. MOC itself has no effect on cell proliferation or apoptosis. MOC as a hierarchical and flexible nanosheets electrode have higher HER activity, can inhibit the proliferation of tumor cells significantly and promote apoptosis of tumor cells by precise H2-production in vivo.
To verify the biosafety of treatment with MOC. Hearts, livers, spleens, lungs, and kidneys from four groups of treated nude mice were removed, fixed in formalin, and embedded in paraffin. After sectioning, hematoxylin-eosin staining (H&E) was used to observe the damage of each tissue and organ under the microscope (Fig. S7A in Supporting information). It can be seen that after gas treatment, the important functional organs of the nude mice were not affected, and there was no destruction of tissue morphology or cell necrosis. After testing the liver and kidney function indexes of nude mice after the experiment (Figs. S7B and C in Supporting information), owing to the influence of subcutaneous human liver cancer tissues, the alanine aminotransferase (ALT) indices of the four groups of nude mice all exhibited considerable fluctuations, but remained at a relatively low level overall. Meanwhile, there was no obvious difference in the creatinine (CREA) indices among the groups. These data suggest that gas therapy with MOC does not affect the normal physiological function of the vital organs.
Hydrogen therapy for tumor treatment has been widely reported and supported by previous studies which become a potentially effective therapeutic strategy with few side effects and low cost. However, the lack of endogenous hydrogen source is the main obstacle to limit the application of hydrogen therapy. To address this issue and achieve in vivo production, we proposed to use nanostructure 2D MoS2, which are known as highly efficient hydrogen producing electrode, to prepare a MOC nanosheet that can be applied deep abdominal liver cancer. Relying on the flexible hierarchical carbon skeleton, its hierarchical nanostructure characteristics greatly increased HER reaction area, exposed more active reaction sites, and increased the efficiency of hydrogen production. In vitro cell experiments demonstrated that the efficient hydrogen production of MOC could effectively inhibit the growth of HCC cells without affecting the proliferation of normal liver cells. Animal experiments further proved that MOC nanosheets can inhibit the proliferation of tumor cells and promote their apoptosis through sufficient hydrogen produced by precise H2-production in vivo. The body weight, tissue section images, and organ function of the nude mice did not change during the treatment, demonstrating the in vivo safety of the investigated MOC nanosheets. Relying on the flexible structure of MOC, it can target the treatment of liver cancer located in the deep abdominal cavity. The shortcomings of hydrogen therapy, such as untargeted, uncontrollable and difficult clinical implementation, are solved, providing a new idea for the clinical application of hydrogen therapy.
Declaration of competing interest
The authors declare that they have no known competing financial interests or personal relationships that could have appeared to influence the work reported in this paper.
CRediT authorship contribution statement
Hao Hu: Writing – original draft, Data curation, Conceptualization. Jiacheng Wang: Writing – review & editing, Conceptualization. Si Zhang: Formal analysis, Data curation. Ben Zhang: Writing – original draft, Data curation. Cuinan Jiang: Writing – original draft, Data curation. Hong Tian: Formal analysis, Data curation. Xunxin Gu: Writing – original draft, Data curation. Yang Sheng: Writing – review & editing. Zhenghuan Zhao: Writing – review & editing. Meng Li: Writing – review & editing, Project administration, Funding acquisition, Conceptualization. Lu Zheng: Writing – review & editing, Supervision, Funding acquisition. Jing Li: Supervision, Project administration, Funding acquisition.
Acknowledgments
This work was financially supported by research grants from the Natural Science Foundation of China (No. 52173235), Science and Technology Innovation and Improving Project of Army Medical University (No. 2021XJS24) Science and Technology Innovation Capability Enhancement Project of Army Medical University (No. 2022XJS20), Key Innovation Project for Clinical Technology of the Second Affiliated Hospital of Army Medical University (No. 2018JSLC0025).
Supplementary materials
Supplementary material associated with this article can be found, in the online version, at doi:10.1016/j.cclet.2025.110866.
[1]
I.D. Nagtegaal, R.D. Odze, D. Klimstra, et al., Histopathology 76 (2020) 182–188. doi: 10.1111/his.13975
[2]
J.M. Llovet, R.K. Kelley, A. Villanueva, et al., Nat. Rev. Dis. Prim. 7 (2021) 6. doi: 10.1038/s41572-020-00240-3
Figure 1
Macroscopic and microscopic morphology and surface characteristics of MOC. (A) As a flexible material, it can be used in vivo through minimally invasive surgical methods. (B) MOC has good flexibility and shaping properties. (C) Scanning electron microscope (SEM) image of surface morphology of CPY. (D, E) SEM images of surface morphology of MOC at different magnification. (F) Energy dispersive spectrometer (EDS) mapping of MOC. (G) TEM image of MOC. (H) The XRD pattern of MOC. (I) The full XPS spectrum of MOC. (J) High-resolution XPS spectra of Mo 3d.
Figure 2
Hydrogen evolution performance of MOC in different environments. (A) Mechanisms by which a micro acidic environment promotes tumor growth and metastasis. (B) Hydrogen evolution capacity of MOC in DMEM with different pH. (C) Comparison of hydrogen evolution ability of CC, NEEDLE and MOC in DMEM (pH 7.4). (D) Taphil slope of CC, NEEDLE, MOC. (E) EIS of CC, NEEDLE, MOC. (F) Schematic diagram of the operation of hydrogen evolution of MOC in different electrolytes.
Figure 3
Cell experiments. (A) Cells were divided into four groups: (a) Control group without any treatment; (b) Cells were incubated with MOC; (c) Electrifying the cells with a steel needle; (d) Cells were electrified with MOC. (B) Comparison of the results of four groups of cells after experiments. Scale bar: 0.1 mm. (C) After experimental treatment, the cells were collected for flow cytometry analysis. (D) The apoptosis rate of the four groups of cells. Data are presented as mean ± standard error of mean (SEM) (n = 3). NS, not significant vs. blank group. ****P < 0.0001 vs. blank group. ###P < 0.001.
Figure 4In vitro animal experiments. (A) BALB/c nude mice inoculated with HCCLM3 were randomly divided into four groups for different experimental treatments. (B) Tumor changes in BALB/c nude mice before and after experimental treatment. (C) The actual size of the removed tumor after experimental treatment. (D) Tumor size over time. *P < 0.05, **P < 0.01, ***P < 0.001. (E) Curves of body weight over time in BALB/c nude mice. Data are presented as mean ± SEM (n = 5).
Figure 5
Immunohistochemistry of tumor tissue. (A) H&E staining and KI67 staining of tumor tissue. Scale bar: 40 µm. (B) The proportion of Ki67-positive cells in each group. (C) TUNEL fluorescence staining of tumor tissues. Scale bar: 2 mm. (D) The proportion of TUNEL-positive cells in each group. Data are presented as mean ± SEM (n = 4). NS and ****P < 0.0001 vs. blank group. ####P < 0.0001.

 DownLoad:

 下载:
下载:


