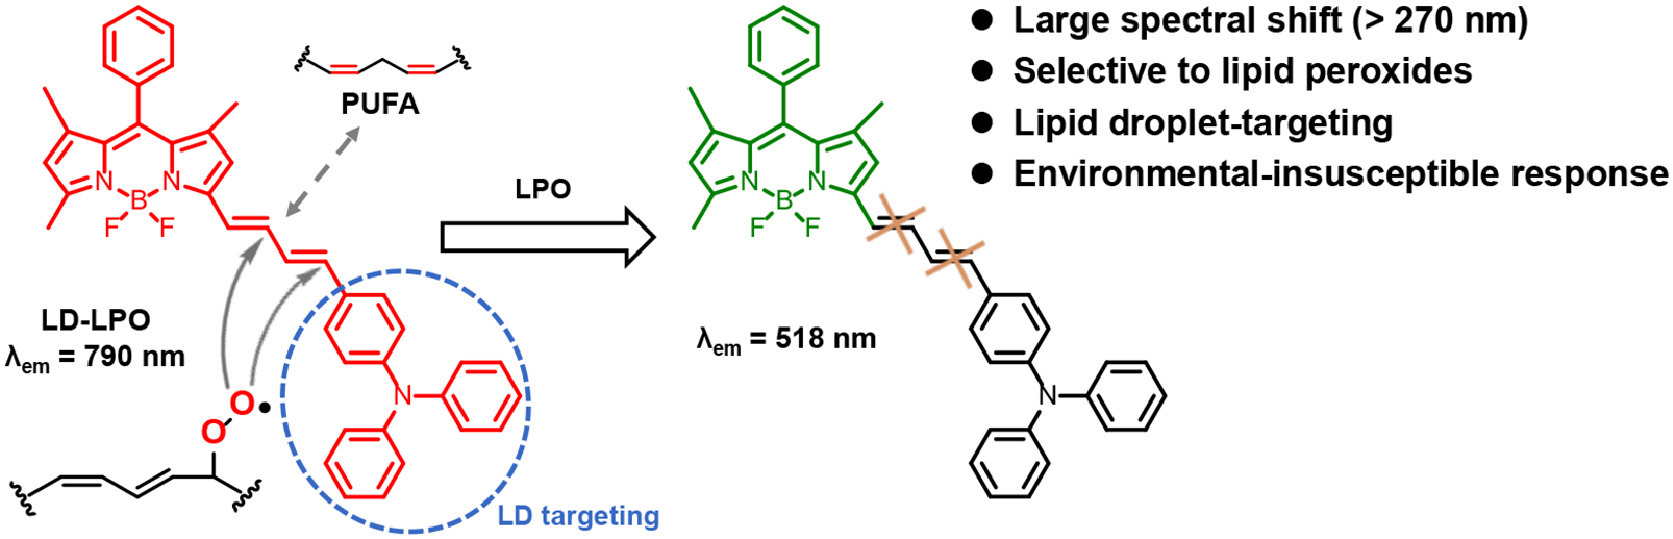
Scheme 1.
Design and fluorescence response mechanism of LD-LPO to lipid peroxides.
A lipid droplet-targeting fluorescence probe for monitoring of lipid peroxidation in ferroptosis and non-alcoholic fatty liver disease
Quan Lu , Lulu Zhang , Zihan Chen , Jiajia Lv , Jie Gao , Xinmin Li , Hongyu Li , Wen Shi , Xiaohua Li , Huimin Ma , Zeli Yuan

Ferroptosis is an iron-dependent regulated cell death process, involved in a variety of important physiological and pathological processes, such as development, aging, immunity, tumorigenesis and neurodegeneration [1–4]. Despite the complex molecular mechanism of ferroptosis, it is now clear that lipid peroxidation (LPO) of polyunsaturated fatty acids (PUFA) is the final execution step in ferroptosis, and subcellular lipid structures are the major sites of LPO [5–7]. Lipid droplets (LDs) is an endoplasmic reticulum-derived lipid organelle found in a wide variety of cells, consisting of a monolayer phospholipid membrane and a hydrophobic lipid core [8]. As the main intracellular lipid storage organelles, LDs is probably a major site of LPO, and play critical roles in the regulation of ferroptosis [9,10]. Given the pivotal role of LDs in lipid metabolism and their lipid structural characteristics, in situ monitoring of LPO processes in LDs is of great significance for ferroptosis studies. However, the detailed study on this topic has not been carried out, probably due to the lack of LD-targeting tools for the analysis of LPO.
Organic small molecule fluorescence probe is one of the most effective tools for the detection of physiological active species in biosystems [11–16], with the advantages of high sensitivity, high imaging resolution, favorable biocompatibility and real-time in situ imaging. Although a large number of fluorescence probes have been developed for imaging of ferroptosis [17–19], these studies are mainly focused on detecting small molecular physiological species of the upstream ferroptosis regulation, for example, reactive oxygen species (ROS) [20–23] and biothiols [24–28]. The commercial probes for LPO, for example C11-BODIPY581/591, do not show any organelle-targeting specificity [20,29]. The currently reported probes to image LDs during ferroptosis are mainly based on monitoring microenvironmental factors (e.g., viscosity, polarity) within LDs [30–35]. Till now, no effort has been made to develop a LD-targeting probe to study the final execution step of ferroptosis (i.e., LPO) in LDs, which encouraged us to develop such a probe.
The LD-targeting LPO fluorescence probe (LD-LPO) developed in this work is shown in Scheme 1. LD-LPO is designed with a boron dipyrromethene (BODIPY) fluorophore as the signal unit, which has stable fluorescence and high quantum yield [36,37]. On the BODIPY fluorophore, a conjugated diene unsaturated chain was modified as recognition motif to mimic the structure of PUFA [38,39]. Upon reacting with lipid peroxides, the π-conjugation of the conjugated diene chain is broken, leading to a great spectral shift (>270 nm) from LD-LPO's own longer emission (790 nm) to the shorter emission of BODIPY fluorophore (518 nm). A triphenylamine group is introduced to the end of the conjugated diene chain to increase the lipophilicity of the probe, giving it a suitable n-octanol/water partition coefficient (LogP) for selective accumulation in LDs [40,41]. LD-LPO shows high selectivity to lipid peroxides over other common oxides, even the highly active ROS, such as hydroxyl radicals (•OH). Furthermore, the fluorescence response of LD-LPO to lipid peroxides is insusceptible to environment, which is extremely important for accurate monitoring of LPO in LDs due to the hydrophobic lipid core [8] and environmental variations during ferroptosis (e.g., polarity and viscosity) [30–35] within LDs. LD-LPO has been used to image LPO in ferroptosis and the ferroptosis-associated non-alcoholic fatty liver disease (NAFLD), demonstrating its utility for monitoring LPO levels in biosystems.
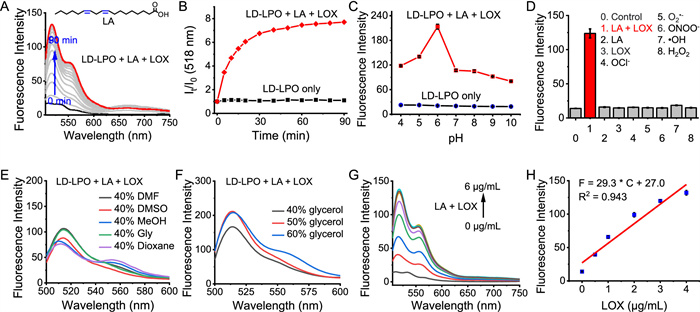
LD-LPO could been readily prepared via a three-step synthetic procedure (Scheme S1 in Supporting information). Compound 1 [42] and compound 2 [43] were firstly prepared by the reported methods, followed by their condensation reaction to obtain LD-LPO. LD-LPO and all of the intermediates were characterized by proton nuclear magnetic resonance (1H NMR), carbon nuclear magnetic resonance (13C NMR) spectrometry and high-resolution mass spectrometry (HR-MS) (Figs. S1–S7 in Supporting information). In phosphate buffer [containing 40% N,N-dimethylformamide (DMF) as co-solvent], LD-LPO has a maximum absorption at about 620 nm, and a weak fluorescence emission at about 790 nm with excitation at 605 nm (Fig. S8 in Supporting information). Then, the spectroscopic properties of LD-LPO before and after reacting with lipid peroxides were tested to investigate whether LD-LPO is able to monitor LPO. Herein, Lipid peroxides were prepared by the peroxidation of PUFAs with the catalysis of lipoxygenase (LOX) [44]. As a result, in the presence of LA (PUFA with two C═C bonds) and LOX, the longer-wavelength absorption band of LD-LPO at 610 nm showed an obvious decrease, indicating the broken of conjugated diene chain recognition group after oxidation of the probe, along with the gradually increase of the new peak at 505 nm, consistent with that of the BODIPY fluorophore (Fig. S9 in Supporting information). This significant spectral change was attributed to the destruction of π-conjugation of LD-LPO after the reaction with lipid peroxides. The recognition group, the conjugated diene chain, has a similar structure to PUFAs and can be easily oxidized by lipid peroxides during LPO process to shorten the conjugated structure [38,39], resulting in a large spectral blue shift. This was also supported by the color change from blue to pink after the probe reacted with LA and LOX (Fig. S9A). On the other hand, upon the addition of LA and LOX, a gradually increased fluorescence peak was found at 518 nm (Fig. 1A), with an about 7.7-fold fluorescence enhancement. We also tested the fluorescence response of LD-LPO to the peroxidation of another PUFA, γ-LA (with three C═C bonds), which resulted in a similar fluorescence increase at 518 nm to that of LA catalyzed by LOX (Figs. S10A and B in Supporting information). In contrast, the monounsaturated fatty acid oleic acid (OA) and the saturated fatty acid stearic acid (SA), which were not capable of undergoing peroxidation, did not cause any fluorescence response even in the presence of LOX (Figs. S10C and D in Supporting information). These results indicate that LD-LPO is capable of monitoring LPO process.
It has been reported that conjugated diene group may be oxidized to carboxyl, hydroxyl, carbonyl or epoxy products upon reaction with LPO [39,45]. The possible reaction products were then identified (Fig. S11 in Supporting information). In the thin-layer chromatography (TLC) analysis, two main fluorescent components (Ⅰ and Ⅱ) could be found in the reaction mixture of LD-LPO and LOX/LA (Fig. S11A). The two fluorescent components were then isolated and subjected to liquid chromatography–mass spectrometry (LC–MS) analysis, and it was found that they were not single compounds, but mixture of multiple products (Fig. S11B). Some possible products were proposed by matching their molecular weight in the mass spectrum (Fig. S11C). Most importantly, the mixed solution of component Ⅰ and component Ⅱ showed similar absorption and fluorescence emission spectra to those of LD-LPO in response to LPO (Fig. S12 in Supporting information). Thus, it can be confirmed that the spectral changes after the reaction of LD-LPO with LPO are resulted from the cleavage of the diene group, generating a variety of oxidation products and contributing together to the spectral response.
Next, the response rate of LD-LPO to LPO was investigated. As shown in Fig. 1B, in the presence of LA and LOX, the fluorescence intensity shows a rapid enhancement to reach a maximum response at about 30 min, and remains unchanged to at least 90 min; as a control, the probe itself do not show any fluorescence change, indicating its good stability. In addition, to examine whether pH conditions interfere with the detection of LPO, the fluorescence responses of LD-LPO to lipid peroxides were determined in phosphate buffers with different pH value. As shown in Fig. 1C, a maximum fluorescence response was found at pH 6.0, which was resulted from the higher catalytic activity of LOX at this pH condition [46,47]. However, the response remains constant over the pH range of 7.0–10.0, covering the physiological pH condition. In addition, the fluorescence response is not affected by temperature in the range of 30–40 ℃, covering the physiological temperature (Fig. S13 in Supporting information).
Due to the oxidative state of the intracellular environment during ferroptotic cell death, selective monitoring of LPO in this process requires the probe to be undisturbed by ROS. Therefore, LD-LPO was reacted with a series of potential ROS interferences, including OCl−, O2•−, ONOO−, •OH and H2O2, to examine its selectivity for lipid peroxides. As expected, these common ROS did not cause any response of LD-LPO, even the highly active ROS, such as •OH and ONOO− (Fig. 1D). In addition, neither the change in the absorption spectra nor the color conversion was observed after the reaction of LD-LPO with other ROS (Fig. S14 in Supporting information). Besides, other common physiologically active species, for example, protein, amino acids, vitamins, metal ions, did not interfere with the detection of lipid peroxides by LD-LPO as well (Fig. S15 in Supporting information).
Another key precondition is the independence of LD-LPO response from environmental factors (e.g., polarity and viscosity), because of the hydrophobic and viscous lipid core of LDs [8] and the changes in their internal viscosity and polarity during ferroptosis [30–35]. As shown in Figs. S16A and B (Supporting information), although the fluorescence of LP-LPO itself is insensitive to changes in viscosity, it undergoes a significant spectral red-shift and decrease in fluorescence intensity with the increase of polarity, may be due to the D-π-A structure of LD-LPO, which is usually sensitive to the changes in ambient polarity [48]. However, the fluorescence response of LD-LPO to lipid peroxides (LA + LOX) remains unchanged with the change of polarity and viscosity conditions (Figs. 1E and F), as indicated by the fluorescence tests in phosphate buffer and co-solvents with different polarities (including the low-polarity 1,4-dioxane) [49], and in phosphate buffer containing 40%–60% glycerol, with viscosity η varying from approximately 26.4–107 cP [20], comparable to the viscosity of LDs [50]. This is extremely important for accurate monitoring of LPO within LDs. The large spectral shift (>270 nm) before and after reaction with lipid peroxides also helps to avoid interference from the environmentally sensitive fluorescence signal of LD-LPO itself. Together, the above results suggest LD-LPO is suitable for the rapid and selective detection of LPO under physiological conditions.
The fluorescence responses of LD-LPO to different level of lipid peroxides were then studied at the physiological pH condition (pH 7.4) after a 30-min reaction. Here, LD-LPO was reacted with a fixed amount of LA (500 µmol/L) and different concentrations of LOX (0–6 µg/mL). As a result, the fluorescence intensity at 518 nm of LD-LPO increased linearly with the concentration of LOX in the range of 0–4 µg/mL (Figs. 1G and H), with a linear equation of F = 29.3 × C + 27.0 (R2 = 0.943), demonstrating that LD-LPO is capable of quantitative monitoring of LPO. Furthermore, we have also performed the absorption titration with different level of LPO. As shown in Fig. S17A (Supporting information), with the increase of LOX concentration, the absorption at 610 nm gradually decreased, accompanied by a new absorption peak rising at 505 nm. In addition, the absorbance at 505 nm showed a good linear increase with the concentration of LOX in the range of 0–4 µg/mL (Fig. S17B in Supporting information), similar to that of fluorescence detection.
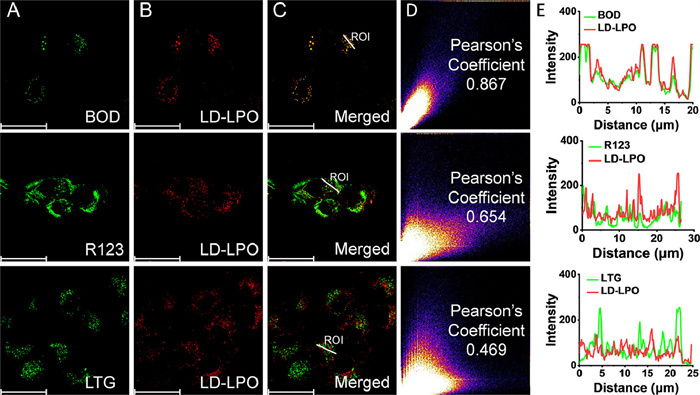
LD-LPO was then used for fluorescence imaging in living cells. Before that, the biocompatibility of LD-LPO was evaluated by cell counting kit-8 (CCK-8) assays. At a concentration of no more than 35 µmol/L, LD-LPO did not cause markedly cell viability decrease (Fig. S18 in Supporting information), suggesting the good biocompatibility of LD-LPO. Then, the LD-targeting ability of LD-LPO was studied by colocalization imaging of LD-LPO and commercial organelle dyes (Fig. 2). The commonly used LDs dye BODIPY 493/503 (BOD), mitochondria dye rhodamine 123 (R123) and lysosome dye Lyso-Tracker Green (LTG) were employed because of their green fluorescence (∼500–530 nm), which can be easily distinguished from the longer wavelength (>600 nm) intrinsic fluorescence of LD-LPO. It was found that in HT-1080 cells, the fluorescence signal of the LD-LPO channel had a very high overlap with that of the BOD channel, with a Pearsonʼs coefficient of 0.867. In contrast, the colocalization imaging of LD-LPO with R123 or LTG showed a very poor overlap of fluorescence signals, with a Pearson's coefficient of 0.654 and 0.469, respectively. These data demonstrated the good LD-targeting ability of LD-LPO.
The capability of LD-LPO to image LPO process was investigated in cells with oxidative stress. Phorbol-12-myristate-13-acetate (PMA), an activator of reduced nicotinamide adenine dinucleotide phosphate (NADPH) oxidase [51], can induce the overproduction of ROS, and thus increase the intracellular LPO level. The cells were therefore treated with PMA for 4 or 8 h, and then stained with LD-LPO for fluorescence imaging. As shown in Fig. S19 (Supporting information), gradually increased fluorescent signals were found in both HT-1080 cells and LO2 cells as the time of PMA incubation was prolonged, implying the higher intracellular LPO level with longer incubation time. Furthermore, co-incubation with liproxstatin-1 (Lip-1) or ferrostatin-1 (Fer-1) (two lipophilic antioxidants) [52] clearly led to the disappearance of fluorescence signal in the cells. These results further support the ability of LD-LPO to monitor LPO in cells by fluorescence imaging.
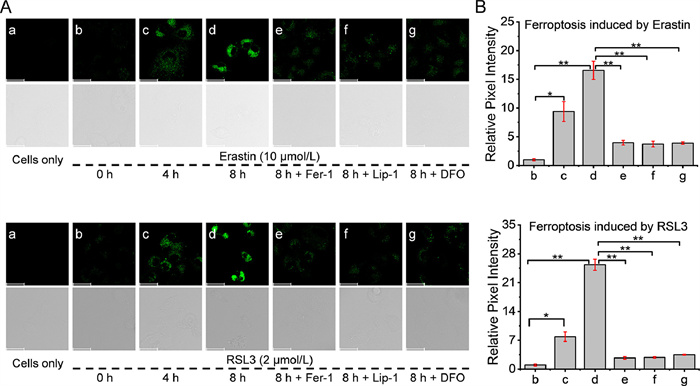
On the basis of the favorable LD-targeting ability and LPO imaging performance of LD-LPO, the in situ visualization of the LPO process within LDs during ferroptosis was comprehensively studied for the first time. The ferroptosis-susceptible HT-1080 cells were chosen as a model cell and incubated with the ferroptosis inducer erastin [2], which blocks the uptaking of cystine by the cystine/glutamate antiporter system Xc−, leads to the depletion of intracellular biothiols (e.g., cysteine and glutathione) and accumulation of lipid peroxides. As can be seen in Fig. 3, LD-LPO shows a rather weak fluorescence in the untreated cells, implying the negligible LPO level in normal cells; however, a 4- or 8-h treatment with erastin produces a significant fluorescence enhancement of 9.4- or 16.6-fold, respectively, consistent with the increase in total intracellular LPO level during ferroptosis [2]. In addition, the co-incubation of ferroptosis inhibitors [deferoxamine (DFO), Lip-1, Fer-1] effectively reduced the intracellular LPO levels. Glutathione peroxidase 4 (GPX4) is an innate intracellular eliminator for lipid peroxides using glutathione as reductant [3]. HT-1080 cells were also treated with another ferroptosis inducer (1S,3R)-RSL3 (RSL3), a potent inhibitor of GPX4 [53]. Similarly, a 4- or 8-h treatment with RSL3 also produces a significant fluorescence enhancement of 7.9- or 25.3-fold, respectively. These results show that LD-LPO is able to provide a relative quantification of LPO levels during ferroptosis. The LPO process in another cell line, LO2 cells, was also monitored (Fig. S20 in Supporting information). LO2 cells treated with either erastin or RSL3 showed a significant increase in LPO level as well, as indicated by the fluorescence enhancement of LD-LPO. In addition, the colocalization imaging of LD-LPO with common organelle dyes (including those for LDs, mitochondria and lysosomes) has also been performed in the ferroptotic cells with LPO. As shown in Fig. S21 (Supporting information), LD-LPO exhibited a good overlap behavior with the commercial LDs dye Nile red in the ferroptotic HT-1080 cells, indicating that LD-LPO can target LDs even after reaction with lipid peroxides. The above findings suggest that LD-LPO can indeed achieve the in situ visualization of LPO within LDs during ferroptosis.
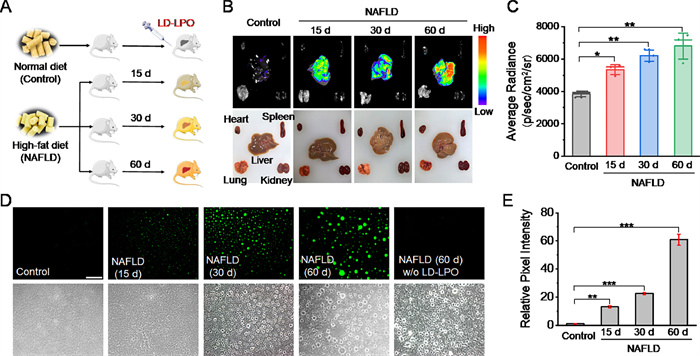
As ferroptosis is associated with a large number of diseases, the imaging performance of LD-LPO in ferroptosis-associated disease was also investigated. NAFLD is a typical ferroptosis-associated liver disease caused by lipid metabolism disorder [5]. NAFLD is characterized by an accumulation of LDs. LPO process plays a key role in the onset and progression of this disease. Herein, BALB/c male mice were fed with high-fat diet (HFD) to develop NAFLD models and intravenously injected with LD-LPO for fluorescence imaging of LPO (Fig. 4A). All animal experiments were approved by the Experimental Animal Ethics Committee of Zunyi Medical University (approval number: [2021] 2-422). Oil red O staining and hematoxylin and eosin (H&E) staining were employed to confirm the successful development of NAFLD models (Fig. S22 in Supporting information). After injected with LD-LPO, the NAFLD mice (with a 60-d HFD-feeding) were euthanized at different time to investigate the fluorescence change and distribution (Fig. S23 in Supporting information). It was found that the liver showed the maximum fluorescence after injected with LD-LPO for 2 h, and no obvious fluorescence signal was observed in other organs (heart, lung, spleen, kidney). Next, the NAFLD mice with different HFD-feeding time were subjected to fluorescence imaging (Fig. 4B). As expected, compared with the normal mice, a gradually increased fluorescence signal could be found in the liver with the prolonged HFD-feeding time (15–60 d, Fig. 4C), indicating the elevated LPO levels and also suggesting that LD-LPO can be used to monitor LPO in NAFLD. In addition, the liver tissues of NAFLD mice were also prepared into frozen slices for imaging. As seen from Fig. 4D, the green fluorescent spots in the NAFLD groups gradually accumulate and become larger in size, may be due to the accumulation of LDs in NAFLD. Most importantly, the increase of fluorescence intensity (Fig. 4E) further supported the elevated LPO level in NAFLD and revealed the close connection between LPO and this disease.
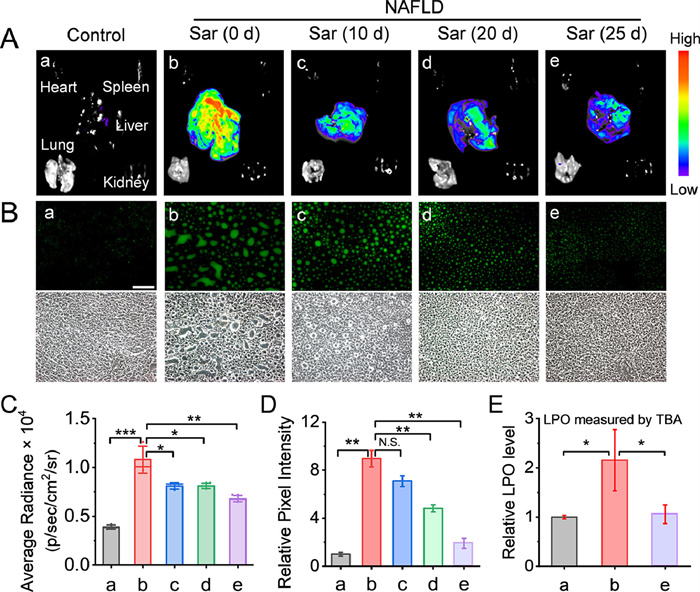
To further study its imaging capability for LPO, LD-LPO was used to monitor the LPO level variations during medicine treatment of NAFLD. Saroglitazar [54,55], a dual peroxisome proliferator activated receptor-α/γ agonist, can promote the lipid metabolism and reduce the lipotoxic load in liver and has therefore been used to treat NAFLD. The mice were consecutively fed with HFD for 30 d, intermittently administered with saroglitazar on day 5, 10 or 20, then injected with LD-LPO for imaging (Fig. S24 in Supporting information). As shown in Figs. 5A and C, the fluorescence intensity of the liver in NAFLD group showed a significant decrease after a 10-, 20-, 25-d administration of saroglitazar, respectively, indicating that saroglitazar can efficiently reduce the accumulation of lipid peroxides in the liver. It can also be seen from the images of the liver slices that the green fluorescence spots became smaller and dimmer with the treatment of saroglitazar (Figs. 5B and D). In addition, by detecting the serum biochemical indicators (Fig. S25 in Supporting information), the liver injury-associated aspartate aminotransferase (AST) and alanine aminotransferase (ALT) levels were found to decrease significantly with saroglitazar treatment, whereas the renal injury-associated creatinine (CREA), urea and uric acid (UA) levels did not show obvious change. The above results suggest that saroglitazar can alleviate the symptoms of NAFLD, probably by promoting lipid metabolism and thus reducing the level of LPO and the aggregation of LDs in the liver. To further verify the reliability of LD-LPO for monitoring of LPO, thiobarbituric acid (TBA) assay [56], a traditional method to detect lipid peroxides, was also employed to monitor the LPO level in NAFLD models with saroglitazar treatment. As shown in Fig. 5E, the TBA assay presented a similar result to that of LD-LPO monitoring, with an apparently increased LPO level in the NAFLD liver and an efficient restoration after saroglitazar treatment. Taken together, the above findings clearly indicate that LD-LPO is indeed a usable tool for monitoring LPO levels in animal models.
In conclusion, a LD-targeting fluorescence probe (LD-LPO) has been developed for monitoring LPO. LD-LPO exhibits a rapid, selective and particularly environmental-insusceptible fluorescence response to lipid peroxides and good LD targeting ability. LD-LPO is able to visualize LPO within LDs in situ during erastin- or RSL3-induced ferroptosis. In addition, LD-LPO has also been used to image LPO in the ferroptosis-associated NAFLD, and to evaluate the medicine treatment of NAFLD with saroglitazar, demonstrating its utility for monitoring LPO levels in biosystems. The favorable analytical and imaging performance of LD-LPO may allow its application in more ferroptosis-associated physiological and pathological processes.
The authors declare that they have no known competing financial interests or personal relationships that could have appeared to influence the work reported in this paper.
Quan Lu: Methodology, Investigation, Conceptualization. Lulu Zhang: Investigation. Zihan Chen: Investigation. Jiajia Lv: Investigation. Jie Gao: Investigation. Xinmin Li: Investigation. Hongyu Li: Writing – original draft, Methodology, Investigation, Conceptualization. Wen Shi: Writing – review & editing, Supervision. Xiaohua Li: Writing – review & editing, Supervision. Huimin Ma: Writing – review & editing, Supervision. Zeli Yuan: Writing – review & editing, Supervision.
We are grateful for the financial support from the National Natural Science Foundation of China (Nos. 82060626, 22004137, 22164022, 22174147, 22074151, 22374153, 22174148), Excellent Youth scientific and technological talents of Guizhou Province (No. Qiankehe platform talents [2021]5638), Talents of Guizhou Science and Technology Cooperation Platform (No. [2020]4104), Science and Technology Innovation Team of Higher Education of Guizhou Provincial Education Department (No. Qianjiaoji [2023]073), Future Science and Technology Elite Talent Cultivation Project of Zunyi Medical University (No. ZYSE-2021-01), Zunyi Science and Technology Plan Project (No. Zunshi Keren Platform [2023] 2).
Supplementary material associated with this article can be found, in the online version, at doi:
X. Jiang, B.R. Stockwell, M. Conrad, Nat. Rev. Mol. Cell Biol. 22 (2021) 266–282. doi: 10.1038/s41580-020-00324-8
S.J. Dixon, K.M. Lemberg, M.R. Lamprecht, et al., Cell 149 (2012) 1060–1072.
B.R. Stockwell, J.P. Friedmann Angeli, H. Bayir, et al., Cell 171 (2017) 273–285.
J. Yin, X. Zheng, Y. Zhao, et al., Angew. Chem. Int. Ed. 63 (2024) e202402537.
X. Wang, Y. Zhou, J. Min, et al., Front. Med. 17 (2023) 173–206.
B.R. Stockwell, Cell 185 (2022) 2401–2421.
M.K. Foret, R. Lincoln, S.Do Carmo, et al., Chem. Rev. 120 (2020) 12757–12787. doi: 10.1021/acs.chemrev.0c00761
S.J. Dixon, J.A. Olzmann, Nat. Rev. Mol. Cell Biol. 25 (2024) 424–442. doi: 10.1038/s41580-024-00703-5
Z. Lin, J. Liu, R. Kang, et al., Adv. Biol. 5 (2021) 2100396.
Y. Bai, L. Meng, L. Han, et al., Biochem. Biophys. Res. Commun. 508 (2019) 997–1003.
K. Li, S. Xu, M. Xiong, et al., Chem. Soc. Rev. 50 (2021) 11766–11784. doi: 10.1039/d1cs00408e
Z. Zeng, S.S. Liew, X. Wei, et al., Angew. Chem. Int. Ed. 60 (2021) 26454–26475. doi: 10.1002/anie.202107877
X. Wu, R. Wang, N. Kwon, et al., Chem. Soc. Rev. 51 (2022) 450–463. doi: 10.1039/d1cs00543j
L. Lian, R. Zhang, S. Guo, et al., Chin. Chem. Lett. 34 (2023) 108516.
H. Pan, X. Chai, J. Zhang, Chin. Chem. Lett. 34 (2023) 108321.
J. Yin, L. Xu, H. Yang, et al., Anal. Chem. 96 (2024) 355–363. doi: 10.1021/acs.analchem.3c04335
Y.L. Qi, H.R. Wang, L.L. Chen, et al., Chem. Soc. Rev. 51 (2022) 7752–7778. doi: 10.1039/d1cs01167g
J. Yin, J. Zhan, Q. Hu, et al., Chem. Soc. Rev. 52 (2023) 2011–2030. doi: 10.1039/d2cs00454b
H. Li, Y. An, J. Gao, et al., Chemosensors 10 (2022) 233.
H. Li, W. Shi, X. Li, et al., J. Am. Chem. Soc. 141 (2019) 18301–18307. doi: 10.1021/jacs.9b09722
Z. Li, Talanta 212 (2020) 120804.
H. Li, Y. An, X. Luo, et al., Chem. Eng. J. 476 (2023) 146749.
C. Shao, J. Yuan, Y. Liu, et al., Proc. Natl. Acad. Sci. U. S. A. 117 (2020) 10155–10164. doi: 10.1073/pnas.1917946117
X. Jiang, J. Chen, A. Bajić, et al., Nat. Commun. 8 (2017) 16087.
Q. Chen, Y. Wang, T. Yue, et al., Anal. Chem. 95 (2023) 1949–1957. doi: 10.1021/acs.analchem.2c04209
L.L. Wang, Y.R. Zhang, M.H. Zheng, et al., Chem. Eng. J. 466 (2023) 143104.
T. Liang, T. Qiang, L. Ren, et al., Chem. Sci. 13 (2022) 2992–3001. doi: 10.1039/d1sc05930k
X. Di, C. Ge, Y. Liu, et al., Talanta 232 (2021) 122467.
G.P.C. Drummen, L.C.M. van Liebergen, J.A.F. Op den Kamp, et al., Free Radic. Biol. Med. 33 (2002) 473–490.
B. Dong, W. Song, Y. Lu, et al., ACS Sens. 6 (2021) 22–26. doi: 10.1021/acssensors.0c02015
K.N. Wang, L.Y. Liu, D. Mao, et al., Angew. Chem. Int. Ed. 60 (2021) 15095–15100. doi: 10.1002/anie.202104163
P. Xie, J. Liu, X. Yang, et al., Sens. Actuators B: Chem. 365 (2022) 131937.
R. Chen, Z. Li, C. Peng, et al., Anal. Chem. 94 (2022) 13432–13439. doi: 10.1021/acs.analchem.2c02260
W. Wang, L. Chai, X. Chen, et al., Biosens. Bioelectron. 231 (2023) 115289.
J. Hong, Y. Liu, X. Tan, et al., Biosens. Bioelectron. 240 (2023) 115646.
H.B. Cheng, X. Cao, S. Zhang, et al., Adv. Mater. 35 (2023) 2207546.
M. Poddar, R. Misra, Coord. Chem. Rev. 421 (2020) 213462.
D. Su, X. Wang, W. Zhang, et al., Trends Anal. Chem. 146 (2022) 116484.
X. Zhang, B. Wang, C. Wang, et al., Anal. Chem. 87 (2015) 8292–8300. doi: 10.1021/acs.analchem.5b01428
Y. Zhao, W. Shi, X. Li, et al., Chem. Commun. 58 (2022) 1495–1509. doi: 10.1039/d1cc05717k
G. Niu, R. Zhang, J.P.C. Kwong, et al., Chem. Mater. 30 (2018) 4778–4787. doi: 10.1021/acs.chemmater.8b01943
C. Duan, Y. Zhou, G.G. Shan, et al., J. Mater. Chem. C 7 (2019) 3471–3478. doi: 10.1039/c8tc06421k
F. Huo, J. Kang, C. Yin, et al., Sens. Actuators B: Chem. 215 (2015) 93–98.
K. Yamada, F. Mito, Y. Matsuoka, et al., Nat. Chem. Biol. 12 (2016) 608–613. doi: 10.1038/nchembio.2105
G.P.C. Drummen, B.M. Gadella, J.A. Post, et al., Free Radic. Biol. Med. 36 (2004) 1635–1644.
B. Bisakowski, A.S. Atwal, S. Kermasha, Process Biochem. 36 (2000) 1–7.
V. Gökmen, S. Bahçeci, J. Acar, Eur. Food Res. Technol. 215 (2002) 42–45.
S. Wang, W.X. Ren, J.T. Hou, et al., Chem. Soc. Rev. 50 (2021) 8887–8902. doi: 10.1039/d1cs00083g
L. Guo, M. Tian, Z. Zhang, et al., J. Am. Chem. Soc. 143 (2021) 3169–3179. doi: 10.1021/jacs.0c12323
S. Ghosh, S. Chattoraj, T. Mondal, et al., Langmuir 29 (2013) 7975–7982. doi: 10.1021/la400840n
S.I. Dikalov, W. Li, A.K. Doughan, et al., Am. J. Physiol. Regul. Integr. Comp. Physiol. 302 (2012) R1134–R1142. doi: 10.1152/ajpregu.00842.2010
O. Zilka, R. Shah, B. Li, et al., ACS Cent. Sci. 3 (2017) 232–243. doi: 10.1021/acscentsci.7b00028
W.S. Yang, R. SriRamaratnam, M.E. Welsch, et al., Cell 156 (2014) 317–331.
S. Gawrieh, M. Noureddin, N. Loo, et al., Hepatology 74 (2021) 1809–1824. doi: 10.1002/hep.31843
D.P. Kumar, R. Caffrey, J. Marioneaux, et al., Sci. Rep. 10 (2020) 9330.
T. Asakawa, S. Matsushita, Lipids 14 (1979) 401–406.

Figure 1 Spectroscopic detection of LPO (LA + LOX). (A) Fluorescence spectra of 10 µmol/L LD-LPO reacting with 500 µmol/L LA and 10 µg/mL LOX from 0 to 90 min. (B) Fluorescence enhancement (It/I0) of 10 µmol/L LD-LPO in the absence (black) or presence (red) of 500 µmol/L LA and 10 µg/mL LOX at different reaction time. (C) Fluorescence responses of 10 µmol/L LD-LPO in the absence (black) or presence (red) of 500 µmol/L LA and 10 µg/mL LOX under different pH conditions. (D) Fluorescence responses of 10 µmol/L LD-LPO to different analytes: (0) control; (1) LA (500 µmol/L) + LOX (10 µg/mL); (2) LA (500 µmol/L); (3) LOX (10 µg/mL); (4) OCl− (100 µmol/L); (5) O2•− (100 µmol/L); (6) ONOO− (100 µmol/L); (7) •OH (100 µmol/L); (8) H2O2 (100 µmol/L). (E) Fluorescence spectra of LD-LPO (10 µmol/L) reacting with LA (500 µmol/L) and LOX (10 µg/mL) in phosphate buffer and co-solvents with different polarities. (F) Fluorescence spectra of LD-LPO (10 µmol/L) reacting with LA (500 µmol/L) and LOX (10 µg/mL) in phosphate buffer/glycerol mixture with different viscosities. (G) Fluorescence spectra of 10 µmol/L LD-LPO reacting with 500 µmol/L LA and different amounts of LOX (0–6 µg/mL) for 30 min. (H) Linear relationship of fluorescence intensity and LOX concentration. λex/em = 490/518 nm. The results were presented as mean ± standard deviation (SD) (n = 3).

Figure 2 Colocalization imaging of LD-LPO (10 µmol/L) and commercial organelle dyes (100 nmol/L) in HT-1080 cells. (A) Commercial dye channel, λex = 490, λem = 505–540 nm. (B) LD-LPO channel, λex = 560, λem = 600–810 nm. (C) Merged images of image A and B. Scale bar: 50 µm. (D) Intensity correlation plot of LD-LPO and commercial organelle dyes. (E) Intensity profiles of LD-LPO and commercial organelle dyes within the white linear region of interest (ROI) in image C.

Figure 3 Monitoring of LPO during ferroptosis in HT-1080 cells. (A) Fluorescence imaging of HT-1080 cells with different treatments. (a) Cells only. Cell pre-treated with 10 µmol/L erastin (or 2 µmol/L RSL3) for (b) 0 h, (c) 4 h or (d) 8 h, then stained with 10 µmol/L LD-LPO for 30 min. Cell pre-treated with 10 µmol/L erastin (or 2 µmol/L RSL3) in the presence of (e) 20 µmol/L Fer-1, (f) 20 µmol/L Lip-1 or (g) 200 µmol/L DFO for 8 h, then stained with 10 µmol/L LD-LPO for 30 min. λex = 490 nm; λem = 505–540 nm. Scale bar: 50 µm. (B) Relative pixel intensity of images b–g (intensity of image b is defined as 1.0). Significant differences were determined by student's t-test (*P < 0.05, **P < 0.01). The results were presented as mean ± SD (n = 3).

Figure 4 Imaging of LPO in mice NAFLD models. (A) Schematic illustration of development of mice NAFLD models and imaging of LPO with LD-LPO. (B) Fluorescence imaging of main organs after intravenous injection of LD-LPO (1 mg/kg) for 2 h. λex = 485 ± 20 nm; λem = 550 ± 20 nm. (C) Fluorescence intensities of the liver images. (D) Fluorescence imaging of the liver slices after intravenous injection of LD-LPO (1 mg/kg) for 2 h with a blue excitation filter (460–495 nm). Scale bar: 100 µm. (E) Fluorescence intensities of the liver slice images. Significant differences were determined by student's t-test (*P < 0.05, **P < 0.01, ***P < 0.001). The results were presented as mean ± SD (n = 3).

Figure 5 Design and fluorescence response mechanism of LD-LPO to lipid peroxides. Imaging of LPO in mice NAFLD models with saroglitazar (Sar) treatment. (A) Fluorescence imaging of main organs after intravenous injection of LD-LPO (1 mg/kg) for 2 h. λex = 485 ± 20 nm; λem = 550 ± 20 nm. (B) Fluorescence imaging of the liver slices after intravenous injection of LD-LPO (1 mg/kg) for 2 h with a blue excitation filter (460–495 nm). Scale bar: 100 µm. (C) Fluorescence intensities of the liver images. (D) Fluorescence intensities of the liver slice images. (E) Relative LPO levels measured by TBA assay. The results were presented as mean ± SD (n = 3). Significant differences were determined by student's t-test (N.S., no significance. P < 0.05, **P < 0.01, ***P < 0.001).

 扫一扫看文章

扫一扫关注我们
 DownLoad:

 下载:
下载: