Molybdenum carbide activated calcium sulfite for antibiotic decontamination at near-neutral pH: Dissolved oxygen promoted bisulfite adsorption for singlet oxygen generation
Citation:
Mimi Wu, Shoufeng Tang, Zhibin Wang, Qingrui Zhang, Deling Yuan. Molybdenum carbide activated calcium sulfite for antibiotic decontamination at near-neutral pH: Dissolved oxygen promoted bisulfite adsorption for singlet oxygen generation[J]. Chinese Chemical Letters,
2025, 36(8): 110613.
doi:
10.1016/j.cclet.2024.110613
Molybdenum carbide activated calcium sulfite for antibiotic decontamination at near-neutral pH: Dissolved oxygen promoted bisulfite adsorption for singlet oxygen generation
English
Molybdenum carbide activated calcium sulfite for antibiotic decontamination at near-neutral pH: Dissolved oxygen promoted bisulfite adsorption for singlet oxygen generation
State Key Laboratory of Metastable Materials Science and Technology, Hebei Key Laboratory of Heavy Metal Deep-Remediation in Water and Resource Reuse, School of Environmental and Chemical Engineering, Yanshan University, Qinhuangdao 066004, China
Received Date:
19 July 2024 Accepted Date:
04 November 2024 Revised Date:
10 October 2024 Available Online:
15 August 2025
Abstract:
Common activations of sulfite (S(Ⅳ))-based advanced oxidation processes (AOPs) utilized metal ions and oxides as catalysts, which are constrained by challenges in catalyst recovery, inadequate stability, and susceptibility to secondary pollution in application. Calcium sulfite (CaSO3), one of the byproducts of flue gas desulfurization, is of interest in AOPs because of its ability to slowly release S(Ⅳ), low toxicity, and cost-effectiveness. Therefore, a heterogenous activator, molybdenum carbide (Mo2C) was selected to stimulate CaSO3 for typical antibiotic elimination. Benefiting from the dissociation form of HSO3− from CaSO3 and improved electron transfer of Mo2C at pH 6, the simulated target metronidazole (MTZ) can be removed by 85.65% with rate constant of 0.02424 min−1 under near-neutral circumstance. The combining determinations of quenching test, electron spin resonance spectrum, and reactive species probe demonstrated singlet oxygen (1O2) and sulfate radicals played leading role for MTZ decontamination. Characterization and theoretical calculation suggested the alteration of Mo valence state drove the activation of S(Ⅳ), and revealed that dissolved oxygen promoted the adsorption of HSO3− on the surface of Mo2C, then facilitating production of 1O2. The favorable stability and applicability for Mo2C/CaSO3 process indicated an applied prospect in actual pharmaceutical wastewater.
Antibiotic pharmaceutical wastewater harbors substantial amounts of antibiotic residues, posing challenges for degradation using conventional biochemical methods [1]. The release of antibiotics contributes to the emergence of resistance genes in the environment, fostering increased resistance among environmental microorganisms [2, 3]. Advanced oxidation processes (AOPs) emerge as a leading approach for the remediation of organic pollutant-contaminated wastewater [4]. The pH range specified for the treatment effluent of pharmaceutical wastewater falls between 6 and 9 [5]. It is well-known that the reactivity of dominant oxidation species in AOPs is influenced by solution pH, for example, sulfate radicals (SO4•‒) can exhibit higher reactivity than hydroxyl radicals (•OH) at near-neutral pH levels [6, 7]. Besides, nonradical species such as singlet oxygen (1O2) and high-valent metals are widely acknowledged for their low pH dependency and high selectivity [8, 9]. Hence, developing AOPs capable of efficiently treating antibiotic pharmaceutical wastewater by producing reactive oxygen species (ROS) under near-neutral pH conditions is crucial.
Persulfate-based AOPs have garnered significant attention for their facile activation leading to the production of various ROSs (e.g., SO4•‒, •OH, and 1O2) across a broad pH range [10, 11]. Nevertheless, its practical application is constrained by its high cost [12]. Recent studies have shown that sulfite-AOPs can generate sulfite radicals (SO3•‒), which can subsequently transform into a range of oxidizing radicals, such as SO4•‒, •OH, and persulfate radicals (SO5•‒), under aerobic conditions [13]. Furthermore, sulfite exhibits biological toxicity levels an order of magnitude lower than peroxomonosulfate, peroxodisulfate (PDS), and H2O2, making it a promising candidate for replacing these conventional peroxides [14]. Calcium sulfite (CaSO3) is a by-product of the predominant wet desulfurization process currently in use, characterized by cost-effectiveness and adherence to the waste reuse principle [15]. Serving as a sulfite precursor, CaSO3, with reduced solubility, enables the gradual release of SO32− in contrast to sodium sulfite (Na2SO3) and sodium bisulfite (NaHSO3), thereby effectively inhibiting the scavenging of SO4•‒ by excess sulfite and enhancing the utilization of SO4•‒ [16]. To date, a variety of approaches have been utilized to activate sulfite, including metal ions (Fe3+, Mn2+, and Cu2+) and transition metal oxides (Co3O4, Fe2O3, and Cu2O) [17-22]. However, the significant cost, limited pH range, and the potential leaching of toxic metal ions from these activators continue to present major obstacles to their extended application [23]. Therefore, it is imperative to develop an optimal heterogeneous catalyst for activating CaSO3, enabling the efficient generation of ROS under near-neutral pH conditions.
Molybdenum-based materials have attracted considerable interest within the realm of AOPs [24]. Molybdenum disulfide (MoS2) is frequently utilized as a catalyst and cocatalyst in Fenton and Fenton-like reactions [25]. However, the substantial drawback in using MoS2 stems from the potential release of H2S upon the oxidation of sulfur atoms [26]. Molybdenum carbide (Mo2C) possesses a d-band structure akin to that of platinum, allowing the extension of the distance between Mo-Mo bonds on Mo2C to uncover additional active Mo sites, thereby enhancing its catalytic efficacy [27, 28]. Prior researches have indicated that β-Mo2C can activate peracetic acid and function as a cocatalyst in PDS-based AOPs within a neutral pH range [29, 30]. Significantly, Mo2C has been proven to benefit the adsorption capabilities for dissolved oxygen (DO), and the transition between various valent states of exposed Mo could improve the transformation from O2•‒ to 1O2 [31]. Moreover, DO also plays a crucial role in the conversion of SO3•‒ to SO4•‒, SO5•‒, and •OH in sulfite-AOPs [32]. Given the aforementioned points, it is reasonable to posit that Mo2C could serve as a promising activator for sulfite, exhibiting efficiency under near-neutral conditions and potentially mitigating ion leaching. However, there is a knowledge gap concerning the Mo2C-activated sulfite process, particularly in the activation of CaSO3.
The primary aim of this study is to establish an effective β-Mo2C (hereafter referred to as Mo2C) activated CaSO3 system under near-neutral conditions and to elucidate the corresponding reaction mechanism, thereby validating our hypothesis. Within this investigation, metronidazole (MTZ), a prevalent and refractory antibiotic commonly found in pharmaceutical wastewater with concentration at milligram level, was chosen as the focal contaminant [33, 34]. The efficacy of MTZ removal using Mo2C/CaSO3 under varying conditions was investigated, with particular attention to the impact of buffer solutions at different pH levels. The major ROS responsible for degrading MTZ within the Mo2C/CaSO3 were identified, and their respective impacts on MTZ removal were quantified. The reaction mechanisms between CaSO3 and Mo2C were meticulously verified using a combination of experimental and theoretical calculation methods. This research is poised to complement the non-homogeneous activation method of sulfites by Mo2C, thereby advancing the development of a molybdenum-based materials/sulfites process for the treatment of pharmaceutical wastewater.
The chemicals utilized in this work are detailed in Text S1 (Supporting information). All catalytic tests were conducted in a 100 mL beaker at room temperature with continuous stirring. A 50 mmol/L phosphate buffer solution was employed to maintain a constant pH ranging from 3.0 to 9.0. The probe method was introduced in Text S2 (Supporting information). The experimental procedures are outlined in Text S3 (Supporting information). High-performance liquid chromatograph (HPLC) and ultraviolet spectrophotometer were applied to determine the concentration of target organic compound, X-ray diffractometer (XRD), X-ray photoelectron spectrometer (XPS), transmission electron microscope (TEM), and high-resolution transmission electron microscope (HRTEM) were used to characterize the properties of Mo2C. Electron spin resonance spectroscopy (ESR) and probe tests were employed to identify ROS. A modified 5, 5-dithiobis-(2-nitrobenzoic acid) method was applied to quantify the concentration of S(Ⅳ). Electrochemical analysis was performed to investigate the electron transfer between Mo2C and CaSO3. The microscopic mechanism of activation was elucidated through density functional theory (DFT) calculation. The details of these methods were introduced in Texts S4-S7, and Tables S1 and S2 (Supporting information).
The catalytic efficacy of Mo2C towards sulfite was assessed through the degradation of MTZ in a buffered system to mitigate the influence of pH variations. Various MTZ removal processes and pseudo first-order kinetic analyses within Mo2C and CaSO3 are outlined and illustrated in Fig. 1a. Mo2C/CaSO3 showed efficient and rapid degradation for MTZ over a 60 min period, with a pseudo-first-order rate constant (kobs) of 0.02424 min−1. Conversely, MTZ removal was insignificant when utilizing only CaSO3 or Mo2C independently. Furthermore, 62.24% of S(Ⅳ) was depleted within Mo2C/CaSO3 after 60 min (Fig. S1 in Supporting information), indicating an activation ratio (molar ratio of applied Mo2C to consumed CaSO3) of 1:1.95 for Mo2C (1.2 g/L) activated CaSO3, thereby suggesting that MTZ elimination predominantly resulted from CaSO3 activation. To investigate the contribution of released Mo ions during the catalytic process, the liquid supernatant of Mo2C was collected after 60 min of immersion to activate CaSO3 for MTZ degradation. Fig. S2 (Supporting information) demonstrates that free Mo ions in conjunction with CaSO3 were ineffective in MTZ elimination, implying that CaSO3 activation primarily relied on the bulk phase of Mo2C.
Figure 1
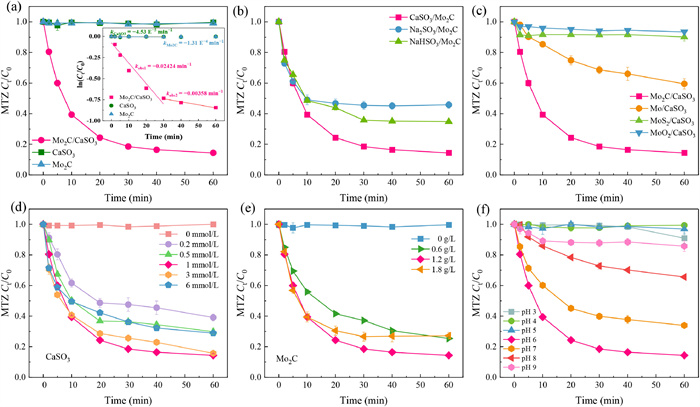
Figure 1.
(a) MTZ removal and corresponding pseudo first-order kinetic by diverse processes. (b) Comparison of MTZ degradation by Mo2C activate different sulfites. (c) CaSO3 activation by different Mo−based materials for MTZ elimination. Effect of CaSO3 concentration (d), Mo2C dosage (e), and buffered pH solution (f) on MTZ decomposition. Conditions: [CaSO3]0 = [Na2SO3]0 = [NaHSO3]0 = 1 mmol/L, [Mo2C]0 = [Mo]0 = [MoS2]0 = [MoO2]0 = 1.2 g/L, pH 6.
The degradation performance of MTZ in different sulfite-AOPs were compared, such as CaSO3, Na2SO3, and NaHSO3 (Fig. 1b). CaSO3/Mo2C presented the highest MTZ degradation efficiency (85.65%) at 60 min, surpassing that of Na2SO3 (54.24%) and NaHSO3 (65.20%). The solubility of Na2SO3 and NaHSO3 is reported to be 30.7 g/100 g H2O and 29.0 g/100 g H2O at 25 ℃, respectively, whereas the solubility for CaSO3 is only 0.007 g/100 g H2O. Higher dosage of aqueous SO32− released from Na2SO3 would consume SO4•‒ generated from sulfite activation, hence affecting the MTZ removal. Conversely, the sustainably released SO32− from CaSO3 could avoid the self-quenching of SO4•‒ [35]. Additionally, the decomposition of MTZ in NaHSO3 system was higher than that of Na2SO3, which could be attributed to the easier activation of dissociated HSO3− compared to SO32−.
Three other typical Mo−based materials, namely molybdenum powder (Mo), MoS2, and molybdenum dioxide (MoO2), were chosen to assess their effectiveness in CaSO3 activation. In Fig. 1c, minimal MTZ removal was observed in MoO2/CaSO3 and MoS2/CaSO3, with only 40.51% of MTZ being degraded in Mo/CaSO3. This suggests that Mo was capable of activating a portion of CaSO3, whereas MoO2 and MoS2 exhibited limited activation potential. The superior degradation of MTZ by Mo2C/CaSO3 is likely linked to the structure of Mo2C, where carbon is incorporated into Mo lattices, resulting in increased exposure of active Mo sites, thus enhancing the activation of CaSO3 [36].
The impact of varying doses of CaSO3 and Mo2C on MTZ degradation in Mo2C/CaSO3 system was systematically explored. In Fig. 1d, as the CaSO3 concentration increased from 0.5 mmol/L to 1 mmol/L, the removal efficiency of MTZ surged significantly from 70.15% to 85.65%, remained relatively stable upon further increase to 3 mmol/L, and then declined at 6 mmol/L. This noteworthy shift can be attributed to the excess presence of S(Ⅳ), which may engage in competitive interactions with SO3•‒ for DO, thereby impeding the conversion of SO3•‒ to SO5•‒. Additionally, the surplus S(Ⅳ) could partake in reactions with SO4•‒ and compete with contaminants for ROS. In Fig. 1e, an increase in catalyst dosage from 0.6 g/L to 1.2 g/L corresponded to a rise in MTZ degradation efficiency from 74.63% to 85.65%. This improvement is likely due to the higher catalyst dosage offering more active sites for CaSO3 activation, consequently enhancing MTZ removal. Notably, inhibition of MTZ decomposition was observed at a Mo2C dose of 1.8 g/L, possibly due to the accelerated depletion of CaSO3 by excessive Mo2C. Furthermore, faster MTZ degradation rate could be achieved by reducing the initial MTZ concentration and elevating the reaction temperature within Mo2C/CaSO3 (Figs. S3 and S4 in Supporting information).
The effect of reaction pH in buffer solution (3.0–9.0) was systematically evaluated. In Fig. 1f, MTZ removal almost negligible under pH 3.0–5.0 and 9.0. The degradation ratio of MTZ were 85.65%, 66.38%, and 34.41% under pH conditions of 6.0, 7.0, and 8.0, respectively, and the corresponding rate constant were presented in Fig. S5 (Supporting information), indicating that the most favorable pH condition for MTZ removal was 6. To evaluate the interplay between CaSO3 and Mo2C under diverse pH conditions, the depletion of CaSO3 at various pH levels was initially determined. The highest consumption of CaSO3 was observed at pH 6 (Fig. S6 in Supporting information), suggesting the most efficient mass transfer rate between CaSO3 and Mo2C occurred at pH 6, aligning with the observed impact of pH conditions on MTZ degradation. Subsequently, a comparison of the oxidation and adsorption effects for MTZ at different pH circumstances for Mo2C/CaSO3 was undertaken. Fig. S7 (Supporting information) revealed that Mo2C alone exhibited minimal MTZ adsorption across a range of pH levels, indicating that the degradation of MTZ under varying pH conditions was primarily driven by oxidation facilitated by the activation of CaSO3.
Electrochemical test was employed to further explore the influence of pH on Mo2C/CaSO3 process. Nyquist plots were examined across varying pH levels (Fig. S8 in Supporting information), highlighting the lowest charge transfer resistance at pH 6, thereby confirming its role in facilitating electron transfer between Mo2C and CaSO3. Linear sweep voltammetry (LSV) was employed to evaluate the redox potentials at different pH values (Fig. S9 in Supporting information). The introduction of MTZ into the Mo2C/CaSO3 system at pH levels of 6, 7, and 8 led to an augmentation in redox potential, providing evidence of electron exchange between the Mo2C/CaSO3 framework and MTZ, being in agreement with the degradation pattern of MTZ across varied pH. In addition, the morphological distribution of CaSO3 varied at different pH levels (Fig. S10 in Supporting information). Under a pH of 6, CaSO3 predominantly existed in HSO3−, which is particularly favorable for enhancing sulfite activation [37], consequently facilitating MTZ degradation.
Pre-mixing CaSO3 and Mo2C represents an effective approach for elucidating the effect of electron transfer [38]. In Fig. S11 (Supporting information), MTZ removal exhibited a significant decline with prolonged mixing duration, with efficiency nearly negligible after pre-mixing for 20 min. Consequently, no discernible electron-mediated effects were observed, and there were no indications of the presence of Mo-SO3 complexes within this system. It is plausible that Mo2C activated CaSO3 to generate radical/non-radical species responsible for MTZ removal. Subsequently, we will delve deeper into the mechanism underlying CaSO3 activation by Mo2C.
ROS quenching experiments was used to determine the type of ROS produced for MTZ removal during Mo2C/CaSO3. Various quenchers were employed, including methanol (MeOH, a quencher of •OH and SO4•‒), tert‑butanol (TBA, a quencher of •OH), furfuryl alcohol (FFA, a quencher of 1O2), l-histidine (l-His, a quencher of 1O2), and p-benzoquinone (BQ, a quencher of superoxide anion (O2•‒)) [39-41]. In Fig. 2a, adding 100 mmol/L TBA presented a modest inhibition on MTZ elimination (from 85.65% to 66.92%), suggesting that •OH was not the primary ROS. A distinct phenomenon arose where MTZ removal was inhibited from 85.65% to 18.75% upon introducing 100 mmol/L MeOH, indicating a substantial contribution of SO4•‒ to MTZ elimination. Furthermore, the suppression of MTZ degradation by FFA (from 85.65% to 30.91%) mirrored that of l-His (from 85.65% to 26.36%) (Figs. 2b and c), implying a crucial role of 1O2. The inhibitory effects of BQ (Fig. 2d) and FFA were comparable, and considering the very low redox potential of O2•‒, O2•‒ was deemed a primary source of 1O2 [41]. The quenching experiments revealed that the predominant ROS produced by Mo2C/CaSO3 at pH 6 were SO4•‒ and 1O2, with a minor presence of •OH.
Figure 2
Figure 2.
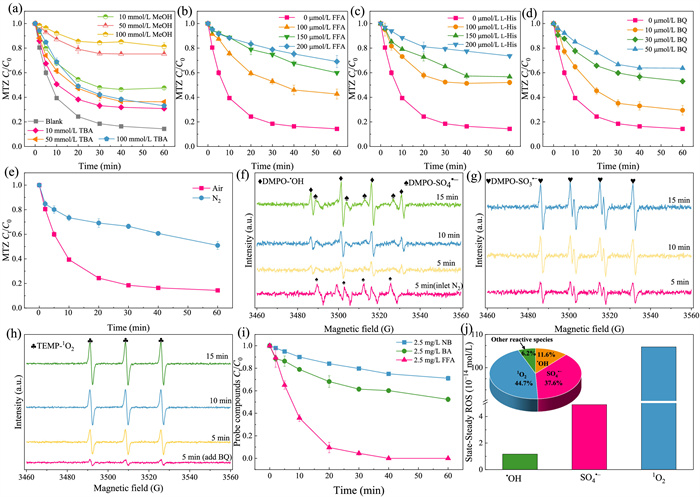
Quenching experiments at pH 6: (a) MeOH and TBA, (b) FFA, (c) l-His, (d) BQ. Effect of passing N2 on MTZ degradation (e). DMPO-trapped ESR (f, g). TEMP-trapped ESR (h). Decomposition of NB, BA and FFA within Mo2C/CaSO3 (i). Steady-state concentrations and contribution of ROS (j). Conditions: [CaSO3]0 = 1 mmol/L, [Mo2C]0 = 1.2 g/L, [MTZ]0 = 5 mg/L, pH 6.
A significant decrease in MTZ removal was occurred with the passage of N2 (Fig. 2e). This could mean that O2•‒ is the main source of 1O2, and O2 is involved in the transformation between ROS. HO· can produce 1O2 through disproportionation (Eq. 1) [42, 43]. Whereas, at pH 6, TBA introduction did not visibly inhibit MTZ decomposition, suggesting that 1O2 is not produced by this pathway. Given that the transition between different valence states of Mo on the Mo-based materials can benefit the transformation of O2•‒ to 1O2 [31], it is plausible that 1O2 could be originated from the oxidation of O2•‒ through the Mo sites of Mo2C.
Further, ESR were used to determine ROS generated in Mo2C/CaSO3 using DMPO and TEMP as traps. A gradual increased in the signal intensity of DMPO-SO4•‒ and DMPO-•OH were occurred with increasing time (Fig. 2f), verifying the presences of SO4•‒ and •OH. At 5 min of the reaction, the signal of SO4•‒ was significantly increased by the passage of N2, which could be probably due to the inhibition of SO3•‒ decomposition in the absence of O2, affecting the conversion of SO4•‒ to SO3•‒. An escalation in the intensity of DMPO-SO3•‒ adduct signals was noted as the reaction proceeded (Fig. 2g), validating the formation of SO3•‒. As the low redox potential of SO3•‒ [44], SO3•‒ cannot attack MTZ directly. Besides, SO3•‒ could be quickly reacted DO to form SO5•‒. However, Fig. 2a shows an absolute restraint of MTZ elimination with 100 mmol/L MeOH (MeOH is fairly inert toward SO5•‒, kMeOH-SO < 103 L s−1 mol−1), suggesting a weak function of SO5•‒ for removing MTZ. The signal of 1O2 was gradually enhanced with time (Fig. 2h), verifying the generation of 1O2. The addition of BQ to quench O2•‒ significantly suppressed the signal of 1O2, verifying that O2•‒ was the source of 1O2. Combined with quenching and ESR results, it could be concluded that the main ROS were SO4•‒ (not SO3•‒ and SO5•‒) and 1O2, •OH is also produced during the process of Mo2C/CaSO3 under pH 6.
To further ascertain the relative contribution of SO4•‒, •OH and 1O2 in Mo2C/CaSO3 process, competitive kinetic test was conducted utilizing nitrobenzene (NB), benzoic acid (BA), and FFA as molecular probes. NB, being unreactive to most ROS, has rapid reactivity with •OH [45], BA is susceptible to oxidative attack by •OH and SO4•‒ [46], and FFA is prone to attack by 1O2 [47]. The experimental results demonstrated a notably accelerated degradation rate of FFA (7.92 × 10⁻⁴ s−1) compared to NB (5.48 × 10⁻⁵ s−1) and BA (1.09 × 10⁻⁴ s−1) (Fig. 2i), thereby affirming the significant involvement of 1O2 in the degradation mechanism. According to the kinetic expression (Eqs. S1−S9 in Text S2 in Supporting information), the steady-state concentrations for 1O2, SO4•‒ and •OH were calculated to be 1.06 × 10⁻¹² mol/L, 4.89 × 10⁻¹⁴ mol/L, and 1.17 × 10⁻¹⁴ mol/L (Fig. 2j), and their contributions were 37.6%, 44.7%, 11.6%, respectively (the illustration of Fig. 2j). This suggested that the main ROS were 1O2 and SO4•‒ in Mo2C/CaSO3, being in line with the scavenging and ESR results.
Since the production and contribution of ROS is affected by pH, we further explored ROS production under pH 7 and 8 conditions by quenching experiments. At pH 7, the addition of TBA more severely inhibited the degradation of MTZ compared to the condition of pH 6 (Fig. S12a in Supporting information), indicating that •OH acted a vital role in this scenario. The quenching of FFA and BQ at pH 7 were similar to those of pH 6 (Figs. S12b and c in Supporting information). When the pH was elevated to 7, the increased contribution of •OH and decreased MTZ degradation may be due to the conversion of SO4•‒ to •OH. At pH 8, the similar effects of 1O2 and SO4•‒ were appeared as pH 6 (Figs. S12d-f in Supporting information). More OH− can act as scavengers for •OH radicals at alkaline pH, leading to an obvious decrease in the •OH contribution and decreasing MTZ removal. Combined with previous results, it can be inferred that is more readily activated by Mo2C at pH 6, minimizing the impact of OH− and promoting the formation of SO4•‒.
Next, a series of electrochemical tests were conducted to explore the activation mechanism of CaSO3 by Mo2C under pH 6. In Fig. 3a, the open-circuit potential (OCP) of Mo2C remained stable for 300 s, and decreased sharply with the addition of CaSO3, and increased slightly with the addition of MTZ. The results of OCP curves demonstrated that adding CaSO3 resulted in the transferred of electrons to the surface of Mo2C, and electrons were transferred from Mo2C to MTZ after the introduction of MTZ. After successive additions of CaSO3 and MTZ to the system containing Mo2C, the Nyquist radius decreased significantly (Fig. 3b), indicating the reaction of Mo2C/CaSO3/MTZ had the smallest charge transfer resistance and stronger electron transfer capability. In Fig. 3c, the current change in the cyclic voltammetry (CV) curve was significantly enhanced after the introduction of CaSO3 and MTZ, suggesting that Mo2C/CaSO3 had a heightened specific capacitance and accelerated electron cycling ability. The distinct electrochemical responses observed across various systems highlighted the pivotal role of Mo2C in directly mediating the activation of CaSO3 and the degradation of MTZ.
Figure 3
Figure 3.
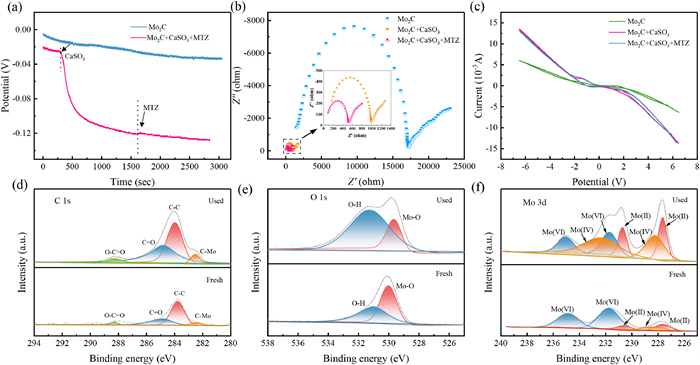
Electrochemical tests of Mo2C/CaSO3: (a) OCP curve, (b) Nyquist plots, (c) CV curves. XPS profiles of pristine and used Mo2C: (d) C 1s, (e) O 1s, and (f) Mo 3d.
Full-size XPS spectra of fresh and used Mo2C are presented in Fig. S13 (Supporting information), revealing no significant species changes in the species of C, Mo, and O before and after the reaction. The high-resolution C 1s spectra at 282.5,283.8,284.8, and 288.3 eV exhibited four distinct peaks corresponding to C−Mo, C−C, C=O, and O−C=O, respectively (Fig. 3d) [48, 49]. The percentage of C−C augmented from 41.4% to 61.6%, implying the potential involvement of the C structure in Mo2C during the reaction. A distinct C−Mo peak emerged post-reaction, suggesting intensified electron transfer between C and Mo, with C atoms potentially playing a role in expediting electron transfer [29]. The O 1s spectra of both pristine and utilized Mo2C were resolved into two distinct peaks at 529.8 and 530.8 eV (Fig. 3e) [50], corresponding to Mo-O and −OH, separately [49, 51]. After reaction, the declined content of Mo-O could be ascribed to the reduction of Mo(Ⅵ) to Mo(Ⅳ) or Mo(Ⅱ). The increased content of −OH could be ascribed to O2 adsorption on the catalyst surface [52]. As shown in Fig. 3f, the Mo 3d spectra of pristine and used Mo2C were resolved into two distinct peaks at 231.8 and 234.9 eV, corresponding to Mo(Ⅵ) states [53]. Additional peaks were indicative of Mo(Ⅱ) (at 227.7 and 230.6 eV) and Mo(Ⅳ) (at 232.0 eV and 233.6 eV) states [48]. The alterations in Mo ion content are detailed in Table S3 (Supporting information). The reaction led to a decrease in Mo(Ⅳ) content from 77.45% to 28.88%, an increase in Mo(Ⅳ) content from 7.40% to 41.80%, and a rise in Mo(Ⅱ) content from 15.15% to 29.32%. The decrease in Mo(Ⅵ) content could primarily stem from two factors: first, the leaching of Mo(Ⅵ) from the Mo2C surface under mildly acidic conditions; second, the conversion of Mo(Ⅵ) to Mo(Ⅳ) by successive redox reactions. Moreover, the rise in Mo(Ⅳ) content could be attributed to the interaction of Mo(Ⅱ) with O2, generating O2•‒, and the subsequent reduction of Mo(Ⅵ) by O2 in the activation process. It could be suggested that the conversion of Mo(Ⅵ) to Mo(Ⅳ)/Mo(Ⅱ) on Mo2C served as the driving force for the activation of CaSO3. Furthermore, the change between different Mo valence states promoted the production of O2•‒, consequently augmenting the production of 1O2.
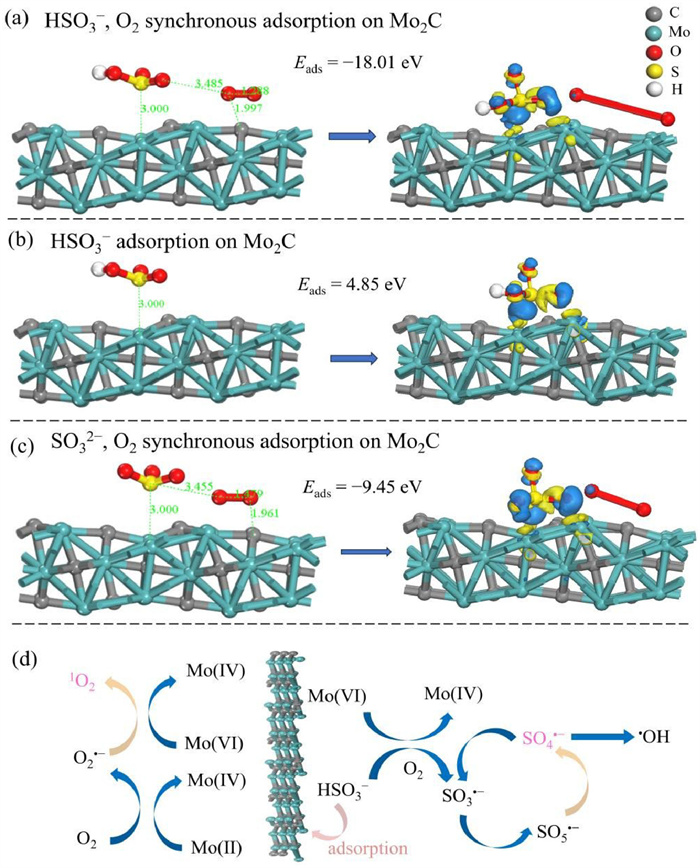
Microscopic reaction specifics involving Mo2C and CaSO3 were investigated through DFT calculations. TEM and HRTEM findings reveal a lattice stripe spacing of 0.219 nm on Mo2C (Fig. S14 in Supporting information), affirming the dominance of the (101) crystallographic facet in Mo2C. Therefore, the crystal cell was generated by sectioning the 101 crystal faces of Mo2C, and the adsorption energies (Eads) of different ions and molecules (HSO3−, SO32−, and O2) on Mo2C were computed, with detailed outcomes presented in Table S4 (Supporting information). Initially, we modeled the concurrent adsorption of O2 and HSO3− on the Mo2C surface. Fig. 4a and Fig. S15 (Supporting information) depict the adsorption of HSO3− at the Mo site and C site, respectively. The Eads at the Mo site was lower than that at the C site, both below zero, suggesting potential adsorption of HSO3− at both sites, with a higher likelihood at the Mo site. Additionally, the Eads of HSO3− when adsorbed solely at the Mo site was computed (Fig. 4b). As the Eads of HSO3− alone exceeded zero, indicating that without O2 involvement, the adsorption process could not occur spontaneously. This observation further underscored the pivotal role of O2 in HSO3− activation process and validated the findings of the earlier N2 passage experiment. Furthermore, we simulated the initial adsorption of O2 followed by the subsequent adsorption of HSO3− on the Mo2C surface (Fig. S16 in Supporting information). An Eads of HSO3− exceeding zero indicated the non-spontaneous nature of this reaction, further confirming that the prerequisite for HSO3− activation was the simultaneous adsorption of HSO3− and O2 on Mo2C surface. Fig. 4c presents the calculated Eads when SO32− and O2 were concurrently adsorbed on the Mo site. The findings revealed that the Eads of HSO3− was lower than that of SO32−, with both values being negative, suggesting that HSO3− was more inclined to be adsorbed on the Mo2C surface than SO32− for activation. This validated the rationale behind the heightened activation and MTZ degradation of S(Ⅳ) under pH 6.
Figure 4
Figure 4.
Initial and optimized adsorption configurations: (a) HSO3− and O2 on Mo2C surface, (b) HSO3− on Mo2C surface, (c) SO32− and O2 on Mo2C surface. (d) Proposed reaction mechanism for Mo2C/CaSO3.
Based on the results obtained from ROS determination, elemental valence analysis, and DFT calculations, a mechanism for the activation of CaSO3 by Mo2C was proposed (Fig. 4d). Firstly, CaSO3 was decomposed into Ca2+ and HSO3− (Eq. 2) at pH 6, and then HSO3− was adsorbed on the surface of Mo2C in the presence of O2. Mo(Ⅵ) underwent a series of reduction/self-disproportionation reactions with S(Ⅳ), leading to the transformation into other Mo species (Mo(Ⅳ), Mo(Ⅱ)), and resulting in the generation of SO3•‒ ((3), (4)). The interaction of SO3•‒ with O2 produced SO5•‒ (Eq. 5), which then underwent a cascade of reactions to form SO4•‒, SO3•‒, O2•‒ (Eqs. 6-10). Notably, the oxidation of O2•‒ by Mo(Ⅵ) resulted in the production of 1O2 (Eq. 11). Among these intermediate species, SO4•‒ and 1O2 were identified as the primary ROS responsible for the oxidation of MTZ (Eq. 12).
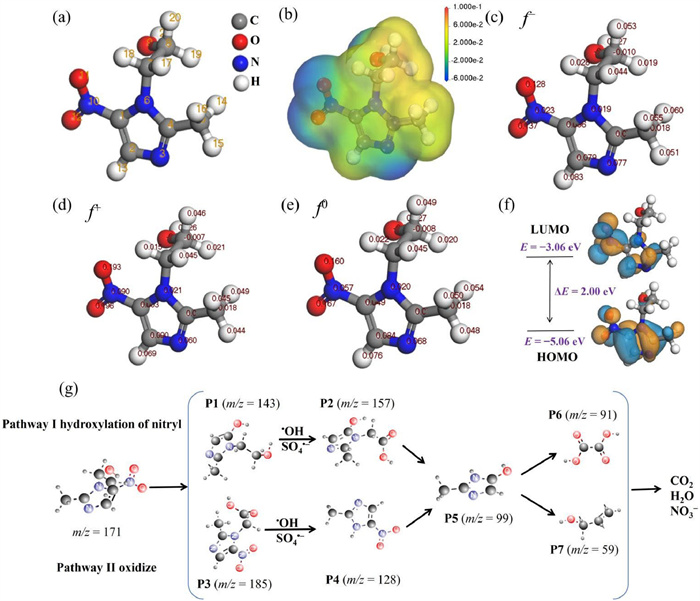
DFT calculations was used to investigate the electron distribution and Fukui indices of MTZ at the molecular/atomic level. Fig. 5a shows the optimized molecular structure of MTZ. The molecular electrostatic potential, illustrating the electron density on the surface of MTZ molecule (Fig. 5b), used red and blue colors to represent positive and negative values, with color intensity indicating the magnitude of the electron density. Regions displaying higher positive values were identified as more reactive sites susceptible to ROS attack, suggesting that the N−CH3CH2OH group in MTZ molecule was particularly vulnerable to ROS attack. Fukui indices of MTZ, including electrophilic reactivity (f−), nucleophilic reactivity (f+), and radical attack propensity (f0), are displayed in Figs. 5c-e. The O atom with the greatest f−, f+, and f0 values was occurred at O12 (Table S5 in Supporting information), indicating that O12 atom was most susceptible to attack by free radicals. Fig. 5f presents the highest occupied molecular orbital (HOMO) (EHOMO = −5.06 eV) and lowest unoccupied molecular orbital (LUMO) (ELUMO = −3.06 eV) of MTZ. Regions rich in electrons were indicated in orange, and regions lacking electrons were shown in blue. Notably, N−containing heterocycles and −NO2 groups exhibited the uppermost sensitivity towards attacks from 1O2 and SO4•‒ [54, 55].
Figure 5
Figure 5.
(a) Optimized molecular structure. (b) Molecular electrostatic potential. (c–e) Calculated Fukui index. (f) HOMO and LUMO distributions for MTZ. (g) Possible degradation pathways of MTZ.
Drawing upon computational analyses and mass spectrometry results, two conceivable degradation pathways of MTZ were postulated (Fig. 5g). In pathway 1, the initial degradation step involved denitration, yielding 3-(2-hydroxyethyl)−2-methyl-3H-imidazole-4-ol (P1, m/z = 143) [56], subsequently oxidized to form the intermediate (2-methyl-5-nitro-imidazole-1-yl)-acetic acid (P2, m/z = 157) [57]. ROS targeted the N-acetic acid moiety in P2, leading to its cleavage and the formation of 2-methyl-3H-imidazole-4-ol (P5, m/z = 99) [58]. In pathway 2, MTZ underwent oxidation by ROS, resulting in the formation of 2-methyl-5-nitro-imidazole-1-yl (P3, m/z = 185) [59]. Subsequently, after the hydroxylation of the methyl group and N−C, P3 was converted to 2-methyl-5-nitro-1H-imidazole (P4, m/z = 128) [60]. P4 underwent denitrification and oxidation to produce P5, which was further oxidized to yield oxalate acid (P6, m/z = 91) and 2-propene-1-ol (P7, m/z = 59) small molecule compounds. Ultimately, these compounds were eventually mineralized to CO2, H2O, and NO3−.
Inorganic ions, including nitrate (NO3−), bicarbonate (HCO3−), chloride (Cl−), sulfate (SO42−), and carbonate (CO32−), as well as humic acid (HA), are commonly found in aqueous solutions and can impact the elimination of organic contaminants by AOPs [61]. Effect of different water matrix on MTZ degradation is illustrated in Fig. S17 (Supporting information). NO3− and HCO3− showed insignificant inhibition effect (Figs. S17a and b). The decontamination of MTZ declined from 85.65% to 25.07% with an increase in Cl− concentration from 0 to 10 mmol/L (Fig. S17c). Cl− is recognized as a prominent radical remover, susceptible to oxidation through ROS (•OH, and SO4•‒) to form the fewer reactive Cl2•‒ (Eqs. S10–S13 in Supporting information) [62]. Thus, the degradation was inhibited under high amount of Cl−. The impact of SO42− was nearly negligible (Fig. S17d), while CO32− exhibited a mild inhibitory effect with an increasing concentration of CO32− (Fig. S17e). This observation can be attributed to the reaction of CO32− with •OH, resulting in the formation of CO3•‒, characterized by an inferior redox potential and greater selectivity [63]. The degradation of MTZ by HA was marginally inhibited with an increasing HA concentration (Fig. S17f), possibly attributed to the scavenging of ROS by HA [64].
To comprehensively illustrate the wide-ranging reactivity of Mo2C/CaSO3, the degradation effects on other common emerging pollutants were investigated, including naproxen (NAP), tetracycline (TC), enrofloxacin (ENR), dexamethasone (DXMS), alizarin red (AR), methyl orange (MO), congo red (CR), and methylene blue (MB) (Fig. S18 in Supporting information). Mo2C/CaSO3 demonstrated significantly greater degradation efficiency towards antibiotics (NAP, ENR, DXMS, and TC) compared to azo dyes (AR, MO, MB, and CR). The limited degradation of azo dyes can be attributed to the higher energy demand for azo bond cleavage (75.7 kcal/mol) compared to the energy released from 1O2 to O2 (36.7 kcal/mol) and lower than SO4•‒ to SO42− (148.7 kcal/mol) [65]. Conversely, the steady-state concentration of 1O2 was significantly higher than that of SO4•‒ in the Mo2C/CaSO3. NAP, TC, ENR, and DXMS are recognized as being vulnerable to attack by 1O2, SO4•‒, and •OH [30, 66-69], which constituted the primary ROS generated in our developed Mo2C/CaSO3.
Successive CaSO3 addition test was conducted to confirm the enduring catalytic capability of Mo2C. In Fig. S19a (Supporting information), MTZ concentration was raised to 25 mg/L, with Mo2C amount maintained at 1.2 g/L, and 1 mmol/L CaSO3 was added hourly. Following five rounds of CaSO3 addition, the removal efficiency reached 82.15% within 5 h, surpassing the efficacy of the system with five CaSO3 additions without Mo2C, and a single CaSO3 addition with Mo2C. The cyclic performance of Mo2C was assessed (Fig. S19b in Supporting information), revealing that the degradation rate of MTZ could achieve 47.3% after 5 cycles. The decreased degradation efficiency could be related to the loss of Mo active sites derived from the oxidation of Mo2C surface [70]. In Fig. S20 (Supporting information), XRD characteristic peaks of the initial, single-use, and five-use Mo2C samples were all matched β-Mo2C (PDF #35-0787), suggesting no notable alteration in the crystal structure of Mo2C and showcasing it's a certain stability.
Overall, we systematically evaluated the feasibility of CaSO3 activation via Mo2C catalysis for MTZ removal. The reaction process achieved the best degradation effect under near-neutral buffered pH conditions (85.65%), which was favorable for eliminating antibiotics from pharmaceutical effluent. The main ROSs generated in Mo2C/CaSO3 were 1O2 and SO4•‒, and their contributions for MTZ elimination were 44.7% and 37.6%, respectively. Furthermore, the promoted generation of 1O2 could be attributed to the conversion between different Mo valence states. The reaction of Mo2C activated CaSO3 was a heterogenous catalytic process, and DO could improve the adsorption of HSO3− on the surface of Mo2C at pH 6, then benefiting the activation of CaSO3. Mo2C/CaSO3 system exhibited good recycling performance and resistance to water matrix interference, and can effectively degrade multiple typical antibiotics. In this work, we proposed an oxidation method using a desulfurization byproduct CaSO3 as oxidant and Mo-based materials as catalyst, broadening the understanding and application of S(Ⅳ)-AOPs.
Declaration of competing interest
The authors declare that they have no known competing financial interests or personal relationships that could have appeared to influence the work reported in this paper.
The authors express their gratitude for the support received from the National Natural Science Foundation of China (No. 51908485), the Central Guidance on Local Science and Technology Development Fund of Hebei Province (Nos. 246Z3603G and 226Z3603G).
Supplementary materials
Supplementary material associated with this article can be found, in the online version, at doi:10.1016/j.cclet.2024.110613.
[1]
I. Saidi, I. Soutrel, D. Floner, et al., J. Haza rd. Mater. 278 (2014) 172–179.
[2]
P.J. Vikesland, A. Pruden, P.J.J. Alvarez, et al., Environ. Sci. Technol. 51 (2017) 13061–13069. doi: 10.1021/acs.est.7b03623
[3]
D. Guo, S. You, F. Li, Y. Liu, Chin. Chem. Lett. 33 (2022) 1–10.
[4]
S. Pan, B. Cao, D. Yuan, et al., Chin. Chem. Lett. 35 (2024) 109185.
[5]
Y. Liao, Y. Ye, X. Chen, et al., Water Cycle. 5 (2024) 167–175.
[6]
D. Yuan, C. Zhang, S. Tang, et al., Sci. Total Environ. 727 (2020) 138773.
[7]
Z. Wang, F. Bai, L. Cao, et al., Chin. Chem. Lett. 33 (2022) 4766–4770. doi: 10.3390/ma15144766
[8]
X. Li, Y. Guo, L. Yan, et al., Chem. Eng. J. 429 (2022) 132234.
[9]
S. Tu, A. Liu, H. Zhang, et al., Chin. Chem. Lett. 35 (2024) 109761.
[10]
P. Xie, L. Zhang, J. Chen, et al., Water Res. 149 (2019) 169–178.
Figure 3
Electrochemical tests of Mo2C/CaSO3: (a) OCP curve, (b) Nyquist plots, (c) CV curves. XPS profiles of pristine and used Mo2C: (d) C 1s, (e) O 1s, and (f) Mo 3d.
Figure 4
Initial and optimized adsorption configurations: (a) HSO3− and O2 on Mo2C surface, (b) HSO3− on Mo2C surface, (c) SO32− and O2 on Mo2C surface. (d) Proposed reaction mechanism for Mo2C/CaSO3.

 DownLoad:

 下载:
下载:


