Figure 1.
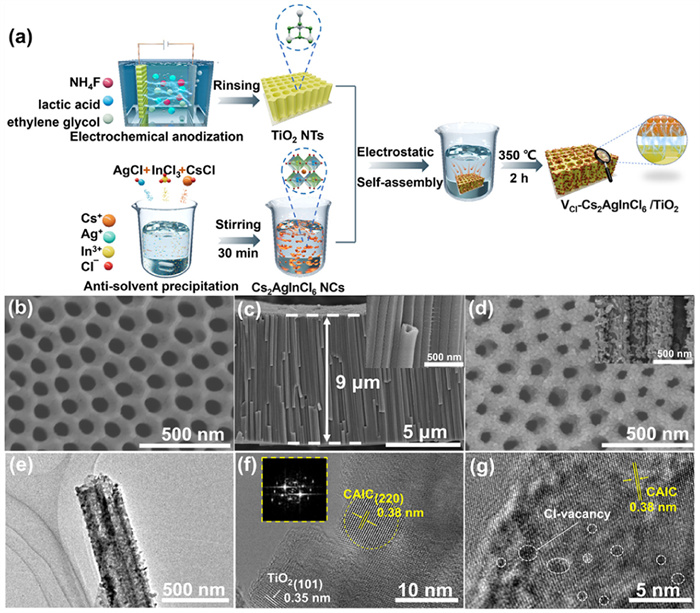
(a) Schematic diagram of gas sensing device synthesis. (b, c) SEM images of TiO2 NTs. (d) SEM, (e) TEM, and (f) HRTEM with fast Fourier transformed (FFT) analysis of VCl-CT-10. (g) HRTEM image of defective VCl-CAIC.
Engineering Cl vacancies in lead-free halide double perovskites decorated on TiO2 nanotubes for highly sensitive NO2 sensing at room temperature
Keke Li , Haiquan Wang , Zhen-Kun He , Yan-Yan Song , Zhida Gao , Chenxi Zhao

Nitrogen dioxide (NO2) is a significant toxic air pollutant emitted from combustion processes and vehicle exhaust. The emission of NO2 can lead to ozone formation and acid rain [1]. Prolonged exposure to NO2, even at levels below a few parts per billion (ppb), can induce various respiratory issues, including irritation, emphysema, and chronic bronchitis [2]. Consequently, the European Union set a NO2 limit of 200 µg/m3 to protect public health and the environment [3]. The negative impacts of NO2 highlight the significance of gas sensing technology, especially the use of metal oxide semiconductor (MOS)-based chemiresistive gas sensors such as TiO2, SnO2, and ZnO [4, 5]. However, these gas sensors usually require high operating temperatures or the loading of precious metals such as Pt, Au, and Pd to reduce the operating temperature [6, 7]. The high cost of energy and precious metals has limited the economic advantage of these sensors, which has hindered their wider application as portable and wearable devices in environmental pollutant monitoring. To address these challenges, the construction of heterojunctions by combining MOS with other functional materials has been demonstrated as an effective strategy to gain high sensing performance at room temperature (RT) [8-10].
In recent years, lead halide perovskites have attracted significant attention in fields such as photovoltaics and light-emitting diodes owing to their extensive chemical tunability and optoelectronic properties [11, 12]. In optical applications, defects in perovskites are generally viewed as detrimental due to their ability to capture carriers and consequently reduce device performance [13]. Conversely, in gas sensing applications, these defects may be regarded as an advantage [14]. Defects in perovskites can act as electron traps and active sites, enhancing the interaction between the material and gas molecules. Thus, the presence of defects improves the sensitivity and selectivity of sensors [15, 16]. Compared to the toxic lead halide perovskite materials [17], lead-free perovskite materials retain the exceptional chemical tunability of perovskite materials while also offering advantages such as environmental friendliness, stability, and high surface-active site content. Although some lead-free perovskite materials have applied for NO2 sensing [18-20], the gas-sensing-related reactions are sluggish under room-environmental light (REL) at RT. Therefore, the development of sensitivity NO2 sensors with rapid response/recovery ability at REL and RT conditions is still largely desirable.
In this work, with the goal of designing a sensitive and long-term stable NO2 chemiresistive gas sensor at RT, a heterojunction was prepared by combining a lead-free perovskite material, Cs2AgInCl6 with chlorine vacancies (VCl-CAIC), with TiO2 nanotube arrays (NTs). The 1D nanotube array structure serves as an excellent platform, providing a highly efficient electron transport pathway that enhances the performance of sensor sensing layers. The NO2 detection performance of the VCl-CAIC/TiO2 heterojunction was investigated in detail. The defects in the perovskite act as electron traps and active sites, enhancing the interaction between the sensor material and gas molecules. The sensor exhibits remarkable sensitivity, selectivity, repeatability, and stability. These findings advance the field of lead-free perovskite-based gas sensors and also highlight the imperative environmental and health challenges posed by NO2 emissions.
Fig. 1a illustrates the steps used for the preparation of gas sensing materials. Scanning electron microscopy (SEM) images in Figs. 1b and c show TiO2 NTs prepared by electrochemical anodization have a diameter of 150nm and a length of ~9 µm. These NTs are uniformly arranged. Surface charge analysis reveals that VCl-CAIC and TiO2 NTs possess opposite charges (Fig. S2 in Supporting information). As demonstrated in Fig. 1d, the dip-coating method was used to successfully modify TiO2 NTs with VCl-CAIC nanocrystals. With increasing CAIC solution concentration (X=3, 6, 10, and 20mmol/L), the loading of VCl-CAICx increases (Fig. S3 in Supporting information). The VCl-CAIC-decorated TiO2 NTs prepared with a concentration of 10mmol/L (denoted as VCl-CT-10, Fig. 1d) show a highly dispersed and uniform distribution of CAIC nanocrystals on the surface and walls of the NTs. Moreover, EDX elemental mapping (Fig. S4 in Supporting information) shows the uniform distribution of Cs, Ag, In, and Cl elements on the TiO2 NTs. With a further increase in the CAIC precursor concentration, the CAIC particles tend to aggregate and block the openings of the nanotubes (Fig. S3), which may impede gas permeation. Figs. 1e and f show the transmission electron microscopy (TEM) and high-resolution TEM (HRTEM) images of VCl-CT-10, respectively. Besides the well-distinguished (220) plane of CAIC and the (101) plane of TiO2 [21, 22], a certain amount of lattice disorders and vacancy defects were found for the (220) lattice plane of CAIC (Fig. 1g). The X-ray diffraction (XRD) patterns (Fig. 2a and Fig. S5 in Supporting information) show diffraction peaks ascribed to anatase crystalline TiO2 (JCPDS No. 22-1012) [22] and Ti substrate. The peaks at 24.1° and 34.3° are attributed to cubic Cs2AgInCl6 (JCPDS No. 154-6187) [21]. Notably, with increasing CAIC content, the intensities of the characteristic peaks of VCl-CAIC at 24.1° and 34.3° are significantly enhanced (Fig. S6 in Supporting information).
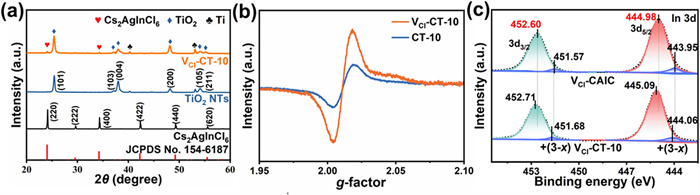
Fig. 2b shows the electron paramagnetic resonance (EPR) signals of VCl-CT-10 and CT-10. Clearly, VCl-CT-10 shows a more pronounced EPR signal (g=2.01), which indicates the enrichment of unpaired electrons in VCl-CT-10. These electrons originate from those trapped around the Cl- vacancies [20, 23-25]. The elemental composition of the VCl-CAIC on the TiO2 NTs was determined through energy-dispersive X-ray spectroscopy (EDS) and X-ray photoelectron spectroscopy (XPS) analyses (Tables S1 and S2 in Supporting information). According to XPS, VCl-CAIC has a Cs: Ag: In: Cl atomic ratio of 2.01:1:1.01:5.41 (Fig. S7 in Supporting information). The slight deviation from the Cs2AgInCl6 stoichiometry can be ascribed to the formation of chlorine vacancies. This is further confirmed by the detailed In 3d XPS spectra shown in Fig. 2c. The two main peaks located at 451.2eV and 444.6eV correspond to In 3d3/2 and In 3d5/2 of the In-Cl bond in the (InCl6)3− units in VCl-CAIC [26, 27]. In the In 3d spectrum of VCl-CT-10, these peaks exhibit a positive shift to 451.5eV and 444.9eV. The two minor peaks located at 451.6eV and 444.0eV are associated with a lower oxidation state +(3−x), which has been reported to be related to the presence of a halide vacancy [23, 26]. Moreover, compared to pure VCl-CAIC, the Cs 3d, Ag 3d, and Cl 2p of XPS signals of VCl-CT-10 are also shifted towards higher binding energy values (Fig. S7). These results indicate the possible presence of a strong built-in electric field at the interface between VCl-CAIC and TiO2 NTs, which would facilitate interfacial electron transportation [23].
To achieve the optimal NO2 sensing performance, the influence of VCl-CAIC loading amount on the TiO2 NTs was investigated at RT (Fig. S8 in Supporting information). As plotted in Fig. 3a, the as-prepared VCl-CT-x samples always exhibit a significantly enhanced response (Rg/Ra) toward NO2 compared with TiO2 NTs, and the highest response is achieved on VCl-CT-10. This sensing response enhancement can be attributed to the heterojunction formed between TiO2 and VCl-CAIC [28, 29]. As shown in Fig. 3b, the response of VCl-CT-10 to 1ppm NO2 reaches 7.26, with response and recovery times of 38s and 59s, respectively. Compared with the other VCl-CT-x samples, VCl-CT-10 possesses the highest sensitivity and rapid response/recovery speed (Fig. S9 in Supporting information). Therefore, subsequent testing was performed by using VCl-CT-10 sample as the sensing chip. To elucidate the origin of the good sensing performance of VCl-CT-10, CAIC-10 was directly grown on TiO2 NTs (CT-10, Fig. S3d). The response of VCl-CT-10 is 2.07 times that of CT-10 for detecting 1ppm NO2 (Fig. S10 in Supporting information). This is because the defective sites on the VCl-CT serve as electronic traps and active reaction sites. In addition, these defective sites can lower the energy barrier for charge transfer, thus accelerating the charge transfer with NO2 molecules [3, 4].
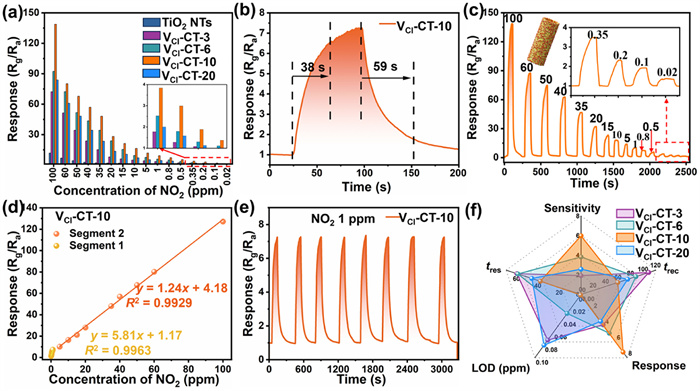
In Fig. 3c, the sensing performance of VCl-CT-10 toward a series of NO2 concentrations was investigated. The calibration curves of the response values show linear responses over the NO2 concentration ranges of 0.02–1 ppm and 5–100 ppm (Fig. 3d). Interestingly, a larger slope is observed in the low-concentration range compared to the high-concentration range [30]. The lower detection limit (LOD) of VCl-CT-10 is calculated as 1 ppb (Figs. S11 and S12 in Supporting information), which falls below the exposure level mandated by the National Institute for Occupational Safety and Health [3]. The repeatability of VCl-CT-10 was confirmed by seven consecutive cycles of exposure to 1ppm NO2. The response is almost the same in each cycle (Fig. 3e). Furthermore, VCl-CT-10 also shows a repeatable response at low NO2 concentrations (Fig. S13 in Supporting information). A radar chart comparing the key parameters of the VCl-CT-x-based NO2 gas sensors is shown in Fig. 3f. VCl-CT-10 exhibits the most optimal sensitivity, response/recovery speed, and LOD value.
Selectivity, long-term stability, and humidity resistance (RH) are also important criteria for the practical application of gas sensors [31, 32]. Fig. 4a shows the sensing responses of the VCl-CT-10 and TiO2 NTs samples toward NO2 and some typical co-existing interference gases (the interference concentrations are 5–15 times the NO2 concentration). The as-formed TiO2 NTs exhibit a poor response to NO2 and other gases. In contrast, VCl-CT-10 exhibits a remarkably high response toward NO2 gas and negligible responses to the interference gases. The outstanding selectivity of VCl-CT-10 can be attributed to the affinity of NO2 molecules to VCl-CT-10, which is induced by the abundant Cl vacancies on this sample [33]. Fig. 4b presents the real-time response of VCl-CT-10 to the sequential injection and exhaustion of 300ppm interference gases and 20ppm NO2. A high response is only observed when VCl-CT-10 is exposed to NO2. Fig. 4c displays the anti-interference ability of this sensor. When mixtures of NO2 and other interference gas are continuously injected into the test chamber, the response of VCl-CT-10 is almost the same as that toward NO2 gas. Furthermore, the sensor exhibited similar sensing performance under REL and in dark (Fig. S14 in Supporting information). These results indicate the good selectivity and reliability of VCl-CT-10, implying its promising application prospects for monitoring NO2 in complex environments [34, 35].
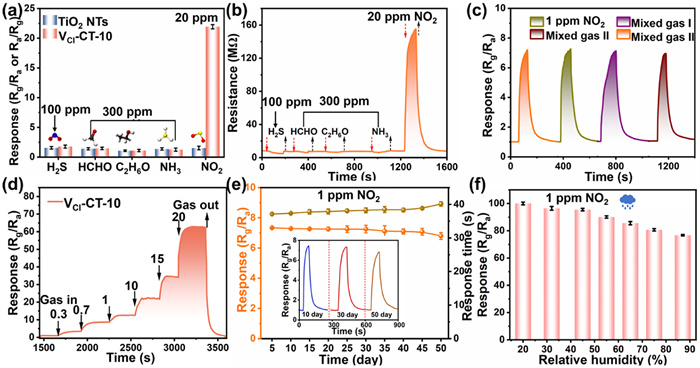
The real-time sensing performance of VCl-CT-10 was also measured by the continuous addition of NO2, as shown in Fig. 4d. The VCl-CT-10-based sensing chip provides the corresponding response when successive exposure to different concentrations of NO2. Importantly, this sensor shows a good in-time response and rapid recovery after exposure to fresh air. Furthermore, the long-term sensing response for 0.2, 0.35, 0.5, and 0.8ppm of NO2 were investigated over 50 days. The responses at all concentrations show no significant decay (Fig. 4e and Fig. S15 in Supporting information), indicating the excellent long-term stability of VCl-CT-10 based sensing chips. Meanwhile, the XRD patterns of VCl-CT-10 samples were analyzed after storage in the environment for up to 3 months (Fig. S16 in Supporting information). No distinct changes in the diffraction peaks are found. To confirm the uniformity of VCl-CT-10 performance, responses from ten VCl-CT-10 samples were obtained, showing satisfactory uniformity with a relative standard difference (RSD) of 2.1% (Fig. S17 in Supporting information). Considering the variable environment humidity in real applications, the sensing performance of the VCl-CT-10-based sensing chip to 1 ppm NO2 was measured under different relative humidity conditions (Fig. 4f and Fig. S18 in Supporting information). The sample shows a slightly decreasing response when the ambient RH is raised. This phenomenon can be explained by the competitive adsorption of H2O and NO2 molecules [36]. Despite this, the sensing chip still retains 81% and 77% of the initial response (RH=20%) under high humidities of 75% and 87%, respectively. Additionally, the sensor performance only showed slight fluctuations with the temperature variations (Fig. S19 in Supporting information). A comparison of the sensing performance of previously reported perovskite NO2 sensors with that of VCl-CT-10 is shown in Table S3 (Supporting information). The sensor reported in this work exhibits outstanding advantages, with a low detection limit (LOD=0.001ppm) and high sensitivity.
Fig. 5a shows the energy band diagrams of TiO2 NTs and VCl-CAIC before contact. Both VCl-CAIC and TiO2 NTs are n-type semiconductors, where electrons are the main carriers [37]. The energy band gaps of VCl-CAIC and TiO2 NTs are 3.25eV and 3.34eV, respectively (Fig. S20 in Supporting information). After the heterojunction is in contact (Fig. 5b), electrons transfer from the conduction band of VCl-CAIC to the conduction band of TiO2 NTs until the Fermi level reaches equilibrium. Mott–Schottky curves further confirm the band diagram of the heterojunction between n-type VCl-CAIC and n-type TiO2 NTs in air (Fig. S21 in Supporting information). When the system is exposed to NO2 (Fig. 5c), the concentration of carriers in the heterojunction is further depleted by the consumption of electrons. Thus, the depletion layer at the interface widens, which increases the resistance of the sensor.
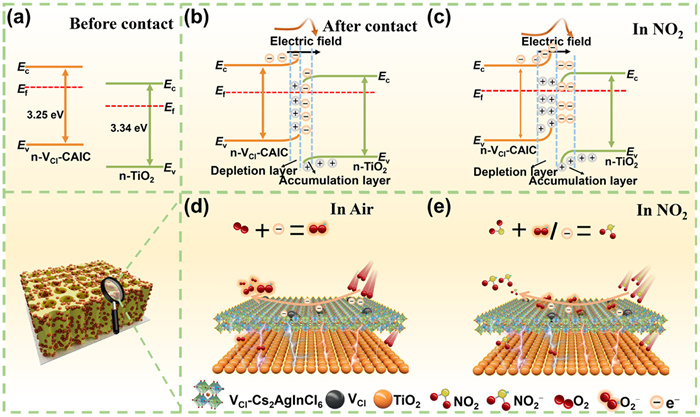
As shown in Fig. 5d, the oxygen molecules (O2) in air adsorbed on VCl-CT-10 (O2 (ads)) capture electrons from the sensor materials to form oxygen ions (O–2(ads), Eq. 1) [37, 38].
|
|
(1) |
When the gas sensor is exposed to the NO2 atmosphere (Fig. 5e), the highly electronegative NO2 molecules extract electrons from the sensing layer (Eq. 2) and also react with the O2– ions, consuming electrons to form NO2– (Eq. 3) [39].
|
|
(2) |
|
|
(3) |
These reactions lead to a further reduction in the number of primary carriers (i.e., electrons (e–)), thereby increasing the resistance of the gas sensor. When the environment reverts to air, electrons previously captured by NO2 are released back into the conduction band of the sensing materials. Consequently, the resistance returns to its original state. As a result, excellent NO2 sensing performance is achieved at RT.
Compared to TiO2 NTs, the superior sensing sensitivity of the VCl-CT-10 sensor can be attributed to two factors: First, the 1D nanotube array structure facilitates the electron transfer, and the nanotubes provides plenty of active sites. Second, the plenty VCl also plays a crucial role in enhancing the gas detection capacity of the sensor. In perovskite nanocrystals, the CB consists of spin-orbit coupling, while the VB has an antibonding feature [13-15]. These contrasting differences in the orbital characteristics induce the formation of shallow trap states [15, 40], which likely improve the sensitivity of the sensor. In this case, NO2, acting as an electron acceptor, interacts with the defect sites, thus inducing obvious changes in the material resistance.
High-sensitivity flexible gas sensors have garnered widespread attention for use in wearable and portable electronic devices, particularly in the fields of personal environmental monitoring and healthcare [41]. As shown in Fig. 6a, the as-proposed sensor shows good flexibility. The dynamic response-recovery characteristics and response values of this sensor show minimal variation at bending angles of 0°, 30°, 70°, and 90° (Fig. 6b), and the sensing performance shows negligibly changes after being bent 100 and 500 times (Fig. 6c). These experimental outcomes demonstrate the promising potential of VCl-CT-10 in the domain of flexible sensing applications.
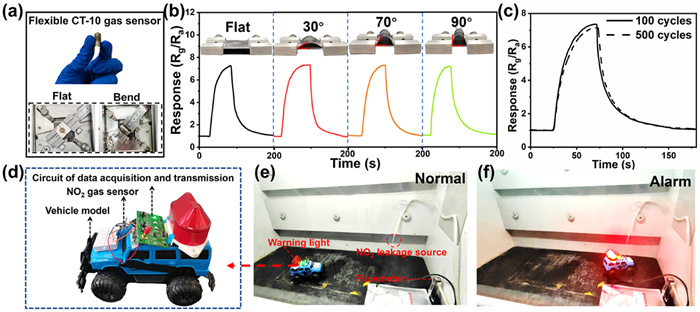
To assess the in situ practical application value of the prepared sensor in real environments, a wireless measuring system was developed to monitor gas leaking and issue hazard warnings in autonomous vehicles under simulated cruising conditions (Fig. 6d). This system contains a VCl-CT-10 sensor, an LED flashing alarm, a 18,650 lithium-ion battery, and portable testing circuits (Fig. S22 in Supporting information). The remote-controlled car loading with the measuring system performs the gas monitoring task (Fig. 6e). The sensor provides a real-time sharp alarm (red LED lighting) as soon as the sensor detects the leaking of NO2 (Fig. 6f). Furthermore, this remote-controlled car also demonstrates excellent application ability for sensing the NO2 released by a fuel car (see Video S1 in Supporting information). These application tests imply that the wireless NO2 sensing system possesses satisfactory application value for gas industry applications and pollutant discharge monitoring.
In conclusion, a NO2 gas sensor was designed by coating Cl vacancy-rich Cs2AgInCl6 onto TiO2 NTs. The optimized sensor shows high NO2 sensitivity, with rapid response/recovery speeds (38/59 (s/s) at 1 ppm) at room temperature. Furthermore, this sensor also exhibits good moisture resistance, flexibility, stability, miniaturization. These advantages suggest the excellent promise of VCl-CT-10 for environmental monitoring. The combination of lead-free perovskite nanocrystals with MOS offers a new route for constructing sensitive interfaces for gas sensing applications.
The authors declare that they have no known competing financial interests or personal relationships that could have appeared to influence the work reported in this paper.
Keke Li: Writing – original draft, Methodology, Investigation, Formal analysis, Data curation, Conceptualization. Haiquan Wang: Writing – original draft, Data curation. Zhen-Kun He: Methodology, Formal analysis. Yan-Yan Song: Writing – review & editing, Methodology, Funding acquisition. Zhida Gao: Writing – review & editing, Methodology. Chenxi Zhao: Writing – review & editing, Formal analysis.
This work was supported by the National Natural Science Foundation of China (No. 22374015), the Fundamental Research Funds for the Central Universities (N2424020), Liaoning Province Foundation for Distinguished Young Scholars (No. 1727146584490, to Y.-Y. Song), and Liaoning Binhai laboratory (No. LBLG-2024-02).
Supplementary material associated with this article can be found, in the online version, at doi:
D. Zhang, Z. Liu, C. Li, et al., Nano Lett. 4 (2004) 1919–1924.
H. Long, A. Harley-Trochimczyk, T. Pham, et al., Adv. Funct. Mater. 26 (2016) 5158–5165. doi: 10.1002/adfm.201601562
K. Kuklinska, L. Wolska, J. Namiesnik, et al., Atmos. Pollut. Res. 1 (2015) 129–137.
J. Xu, Y. Xu, J. Li, et al., ACS Sens. 8 (2023) 3487–3497. doi: 10.1021/acssensors.3c01061
Q.L. Hong, Y. Zhao, X. Ai, et al., Chem. Eng. J. 482 (2024) 148960.
L. Yang, J. Feng, J.N. Wang, et al., Chin. Chem. Lett. 33 (2022) 5169–5173.
Q. Xue, H.Y. Sun, Y.N. Li, et al., Chem. Eng. J. 421 (2021) 129760.
J. Xu, C. Liang, Z. Gao, et al., Chin. Chem. Lett. 34 (2023) 107863.
L. Huang, G. Cai, R. Zeng, et al., Anal. Chem. 94 (2022) 9487–9495. doi: 10.1021/acs.analchem.2c02010
J. Shu, Z. Qiu, S. Lv, et al., Anal. Chem. 89 (2017) 11135–11142. doi: 10.1021/acs.analchem.7b03491
T. Liu, Y. Liu, X. Gao, et al., Chin. Chem. Lett. 34 (2023) 107883.
H. Lin, S. Zhang, D. Zhao, et al., Chin. Chem. Lett. (2024), https://doi.org/10.1016/j.cclet.2024.109795. doi: 10.1016/j.cclet.2024.109795
X. Li, X. Gao, X. Zhang, et al., Adv. Sci. 8 (2021) 2003334.
J. Casanova-Chafer, R. Garcia-Aboal, P. Atienzar, et al., ACS Sens. 7 (2022) 3753–3763. doi: 10.1021/acssensors.2c01581
H. Huang, M. Hao, Y. Song, et al., Small 16 (2020) 1904462.
W. Xuan, L. Zheng, L. Cao, et al., ACS Sens. 8 (2023) 1252–1260. doi: 10.1021/acssensors.2c02656
K. Ho, M. Wei, E.H. Sargent, et al., ACS Energy Lett. 6 (2021) 934–940. doi: 10.1021/acsenergylett.0c02247
W. Ye, L. Zhao, H.Z. Lin, et al., Nat. Commun. 14 (2023) 2133.
Z.K. Chen, W. Ye, H.Z. Lin, et al., ACS Sens. 6 (2021) 3800–3807. doi: 10.1021/acssensors.1c01791
W. Ye, J.H. He, Q. Cao, et al., Adv. Mater. 33 (2021) 2100674.
K. Li, S. Li, W. Zhang, et al., J. Colloid Interface Sci. 596 (2021) 376–383.
R. Kou, H. He, Y. Lu, et al., Chem. Eng. J. 476 (2023) 146546.
H. Lv, H. Yin, N. Jiao, et al., Small Methods 7 (2023) 2201365.
Z. He, Q. Tang, X. Liu, et al., Energy Fuels 35 (2021) 15005–15009. doi: 10.1021/acs.energyfuels.1c01482
J. Pi, X. Jia, Z. Long, et al., Adv. Energy Mater. 12 (2022) 2202074.
A. Khalid, A.M. Alanazi, S.A. Alderhami, et al., Mat. Sci. Semicon. Proc. 165 (2023) 107678.
Z. Lin, Q. Wu, P. Wang, et al., Phys. Scr. 98 (2023) 115960. doi: 10.1088/1402-4896/acfc80
L. Tang, P. Xu, M. Li, et al., Chin. Chem. Lett. 31 (2020) 2155–2158.
M.E. Franke, T.J. Koplin, U. Simon, Small 2 (2006) 36–50. doi: 10.1002/smll.200500261
Z. Chu, M. Xiao, Q. Dong, et al., Chin. Chem. Lett. 34 (2023) 107197.
Y. Gao, J. Tang, Q. Zhou, et al., Anal. Chem. 96 (2024) 5014–5021. doi: 10.1021/acs.analchem.4c00324
Y. Gao, Z. Yu, L. Huang, et al., Anal. Chem. 95 (2023) 9130–9137. doi: 10.1021/acs.analchem.3c01690
X. Guo, P. Wang, T. Wu, et al., Angew. Chem. Int. Ed. 63 (2024) e202318792.
A.A. Parfenov, O.R. Yamilova, L.G. Gutsev, et al., J. Mater. Chem. C 9 (2021) 2561–2568. doi: 10.1039/d0tc03559a
M.A. Stoeckel, M. Gobbi, S. Bonacchi, et al., Adv. Mater. 29 (2017) 1702469.
Y. Yang, J. Mao, D. Yin, et al., J. Hazard. Mater. 455 (2023) 131591.
Q. Xu, B. Zhu, B. Cheng, et al., Appl. Catal. B: Environ. 255 (2019) 117770.
Z. Song, W. Tang, Z. Chen, et al., Small 18 (2022) 2203212.
Y. Yang, D. Zhang, D. Wang, et al., J. Mater. Chem. A 9 (2021) 14495–14506. doi: 10.1039/d1ta03739k
X. Jiao, Z. Chen, X. Li, et al., J. Am. Chem. Soc. 139 (2017) 7586–7594. doi: 10.1021/jacs.7b02290
J. Zhao, H. Wang, Y. Cai, et al., ACS Sens. 9 (2024) 1644–1655. doi: 10.1021/acssensors.4c00137

Figure 1 (a) Schematic diagram of gas sensing device synthesis. (b, c) SEM images of TiO2 NTs. (d) SEM, (e) TEM, and (f) HRTEM with fast Fourier transformed (FFT) analysis of VCl-CT-10. (g) HRTEM image of defective VCl-CAIC.

Figure 2 (a) XRD patterns of samples. (b) EPR spectra of VCl-CT-10 and CT-10. (c) In 3d XPS spectra of VCl-CAIC and VCl-CT-10.

Figure 3 (a) Gas responses of TiO2 NTs and VCl-CT-x. (b) Response and recovery times of VCl-CT-10 toward 1ppm of NO2. (c) Dynamic responses and (d) linear relationship curve of VCl-CT-10 toward 0.02–100ppm of NO2. (e) Repeatability of VCl-CT-10 toward 1ppm of NO2. (f) Radar graph analysis of key sensing parameters.

Figure 4 (a) Selectivity of VCl-CT-10 and pure TiO2 NTs toward NO2 and different interference gases. (b, c) Mixed gas detection using VCl-CT-10. (d) Real-time continuous NO2 sensing curve. (e) Long-term stability measurement of 1 ppm NO2 over 50 days. (f) Response of VCl-CT-10 under different RH.

Figure 5 Gas sensing mechanism. (a-c) Change in the energy band of VCl-CAIC/TiO2 NTs heterojunctions (before contact, in air, and after exposure to NO2). Charge transfer process of VCl-CAIC/TiO2 NTs heterojunctions (d) in air and (e) after exposure to NO2.

Figure 6 Flexibility and application. (a) Optical images of flexible sensor. (b) Response recovery curve for 1ppm NO2 at bending angles of 0°, 30°, 70°, and 90°. (c) Sensitivity after 100 and 500 bends. (d) Equipment images for remote control vehicle loading tests. (e, f) Wireless sensor systems for gas leak detection or hazard alarms.

 扫一扫看文章

扫一扫关注我们
 DownLoad:
 下载:
下载: