Received Date:
27 March 2024 Accepted Date:
15 July 2024 Revised Date:
20 June 2024 Available Online:
15 November 2024
Abstract:
Defects can strongly affect the lattice, strain, and electronic structures of nanomaterials photocatalysts, like a double-edged sword of both positive significance and negative influence on photocatalytic performances. To date, most studies into defects only partially elucidated their beneficial or detrimental roles in photocatalysis. However, a quantitative understanding of the photocatalytic performances modulated by defect concentration still needs to be discovered. Here, a series of TiO2−X mesoporous spheres (MS) with different oxygen vacancy concentrations for photocatalytic applications were prepared by high-temperature chemical reduction. The link between oxygen vacancy concentration and photocatalytic performance was successfully established. The localization of carriers dominated by the Stark effect is first enhanced and then weakened with increasing oxygen vacancy concentration, which is a crucial factor in explaining the double-edged sword role of defect concentration in photocatalysis. As the reduction temperature rises to 300 ℃, carrier localization dominated by the quantum-confined Stark effect maximizes the separation ability of photo generated electron hole pairs, thus exhibiting the best catalytic performance for photocatalytic hydrogen production and the degradation of organic pollutants, as demonstrated by a hydrogen evolution rate of 523.7 µmol g-1 h-1 and a ninefold higher RhB photodegradation rate compared to TiO2 MS. The work offers excellent flexibility for precisely constructing high-performance photocatalysts by understanding vacancy engineering.
Energy and environmental crises are becoming increasingly severe in modern society. To address these problems, the exploration of clean and renewable energy sources and the development of practical eco-friendly systems for environmental remediation are attracting increasing attention [1-3]. One promising technology is semiconductor photocatalyst systems that can split water into hydrogen and oxygen and degrade various organic pollutants to clean up the environment. These systems use solar energy as a photon source to promote the corresponding reactions and have the advantages of low external energy consumption, cost effectiveness, and sustainability [4,5]. The rational design of high-performance photocatalysts for hydrogen production or pollutant degradation has thus become a major field of research [6-8].
Since the report by Fujishima and Honda on the photocatalytic properties of TiO2, this compound has been extensively studied as a primary photocatalytic material [9-13]. In particular, TiO2 mesoporous spheres (MS) with large specific surface areas and strong light scattering have been synthesized and employed as photoanodes with a fast response, low dark current, and high sensitivity [14-16]. In addition, TiO2 MS have been widely used in catalytic pollutant degradation, solar hydrogen production, and fuel cells [17]. Nonetheless, the wide bandgap (3.2 eV for anatase and 3.0 eV for rutile), high electron-hole recombination rate, and low intrinsic electron mobility still inhibit the photocatalytic performance of TiO2 nanostructures [18]. Various strategies to overcome these bottlenecks have been explored, such as noble metal deposition, composite formation with other semiconductors, self-doping, and defect engineering [19].
Defects can strongly affect the lattice, surface state, dispersion, strain, and electronic structures of nanomaterials and ultimately induce changes in the photocatalytic pathways and overall performance [20,21]. Recently, the preparation of reduced TiO2−X containing defects by surface structure engineering was confirmed as an effective strategy for improving the photocatalytic performance of materials [22]. First, reduced TiO2-X materials featuring different colors, such as yellow, blue, red, and black, can be obtained from conventional white TiO2 by adjusting the electronic energy band structure and expanding the optical response from the ultraviolet (UV) to the near-infrared region, leading to enhanced photocatalytic activity [23,24]. Second, oxygen vacancy are shallow donors by creating localized states in the bandgap, thereby facilitating the favorable separation of the photogenerated carriers and increasing electrical conductivity [25,26]. Third, the introduction of oxygen vacancies interferes with the lattice spacing, destroys the symmetry of the crystal structure, and alters the electronic structure of the active centers [27]. The modification of active sites also changes the material surface and affects the adsorption stability [28]. All of these effects can lead to remarkably enhanced photocatalytic performance for TiO2-X. On the other hand, defects, especially bulk defects, can also act as charge recombination centers to limit the effective participation of photogenerated carriers in the photocatalytic reaction [29]. To date, most studies into defects only partially elucidated their beneficial or detrimental roles in photocatalysis [30-32]. Given that defects can exert both positive and negative effects on photocatalytic processes, the optimal defect concentration for maximizing the photocatalytic efficiency must be determined for each process.
In this work, TiO2−X MS were prepared by a facile high-temperature reduction method, which changed the electronic structure and catalytic activity through the strain effect and oxygen doping (Fig. S1 in Supporting information). The structures, chemical compositions, optical characteristics, catalytic properties, carrier localization degrees, wettabilities, and band structures of the prepared samples were investigated. The reduction temperature was found to be linearly correlated with the oxygen vacancy concentration and lattice strain. Moreover, the TiO2−X MS with suitable lattice strain and oxygen vacancy concentration displayed excellent photocatalytic performance when applied to both hydrogen production and organic pollutant degradation. Furthermore, a novel preparation method for photocatalytic materials with controllable vacancy concentrations is illustrated for energy and environmental applications. The obtained results are anticipated to be of far-reaching significance for the design of high-performance bifunctional reduced TiO2−X photocatalysts by combining defect engineering and strain engineering.
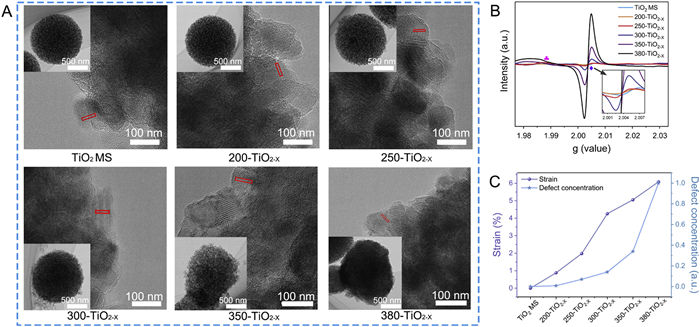
The detailed nanostructure of the TiO2 MS before and after reduction were examined by transmission electron microscopy (TEM) and high-resolution transmission electron microscopy (HRTEM). As shown in Fig. 1A, the TiO2 MS were obtained as monodisperse spheres with a porous nanostructure and an average diameter of approximately 572.74 nm (Fig. S2 in Supporting information). The lattice fringes of the nanoparticles in the series of TiO2/TiO2−X MS were distinguishable by HRTEM, indicating that these nanoparticles were well crystallized, and the lattice fringes corresponding to the (101) plane of anatase TiO2 are marked. At the same time, the plane spacing of the (101) crystal plane was determined using the Digital Micrograph software (Fig. S3 in Supporting information). The as-prepared TiO2 MS without reduction treatment exhibited the clearest lattice fringes with a plane spacing of 0.341 nm [33]. The samples after reduction treatment displayed clear but irregular lattice fringes owing to the presence of surface defects. Correspondingly, the main Raman peak for the Eg at 143.83 cm−1 showed a blue shift due to phonon confinement or the non-stoichiometric ratio (Fig. S4 in Supporting information) [34].
Figure 1
Figure 1.
(A) TEM images of the as-prepared TiO2 MS and the TiO2−X MS obtained at different reduction temperatures (inset: HRTEM images). (B) EPR spectra of the TiO2/TiO2−X MS (diamond: g = 2.003, club: g = 1.988). (C) Variation of the lattice strain measured by TEM (left y axis) and the normalized defect concentration measured by EPR (right y axis) with the reduction temperature.
Electron paramagnetic resonance (EPR) spectroscopy was employed to further characterize the crystal structure and electronic nature before and after the creation of defects in the reduced samples [35]. A weak EPR signal corresponding to oxygen vacancies at g = 2.003 was observed for the as-prepared TiO2 MS, which originated from the natural defects present in the TiO2 nanostructure and the surface absorption of O2 from the air without light irradiation at room temperature (Fig. 1B). This signal gradually became more intense with increasing reduction temperature, as the number of unpaired electrons trapped by oxygen vacancies increased with the degree of reduction. At a reduction temperature of 300 ℃, a weak but broad signal corresponding to Ti3+ centered at g = 1.988 was observed [36]. According to the spin concentration measured by EPR, the defect concentrations were normalized to that at 380 ℃ (defined as 1.0 a.u.) to allow semi-quantitative evaluation. The dependences of the normalized defect concentration measured by EPR and the strain measured by TEM on the reduction temperature were compared, as shown in Fig. 1C. Increasing the reduction temperature led to an increasing concentration of defects, which induced the gradual expansion of the (101) crystal plane until the lattice strain reached 6.08% at a reduction temperature of 380 ℃. Similar positive correlations with respect to the reduction temperature were observed for the normalized defect concentration and the lattice strain. The accumulated lattice defects (Ti3+/OV) presumably gave rise to unsaturated metal centers and disordered lattice structures, increasing the electrostatic repulsion between the Ti3+ cations and inducing gradual lattice expansion [37]. Furthermore, the oxygen vacancy concentrations were calculated from the EPR results as listed in Table S1 (Supporting information). Following reduction at 300 ℃, the amount of Ti3+ centers obtained was 3.53 × 10¹² spins/g (2.82 × 10¹⁷ spins/mol), indicating that one in every 2.37 × 10⁵ Ti atoms was converted to Ti3+. At this stage, other titanium oxides were not observed in the anatase TiO2 phase, although X-ray diffraction data indicated the formation of Ti3O5 at higher temperatures (Fig. S5 in Supporting information) [38]. Fig. S6 (Supporting information) also shows the full width at half maximum (FWHM) values and particle sizes of the samples obtained at different reduction temperatures. The variation of the FWHM and grain size can be ascribed to the decrease in crystallinity caused by the defects, then the excessive accumulation of the defects induced a phase change to generate Ti3O5 [39].
The TiO2−X MS were also characterized by X-ray photoelectron spectroscopy (XPS) to assess the surface chemical states and detect the existence of Ti 2p bands and oxygen vacancies (Fig. S7 in Supporting information). As shown in Fig. S8 (Supporting information), detectable shoulders were observed at lower binding energies of 463.2 and 457.9 eV in the high-resolution Ti 2p spectra, which were ascribed to the 2p1/2 and 2p3/2 peaks of Ti3+, respectively [40]. A semi-quantitative linear relationship between the amounts of Ti3+ and Ti4+ and the reduction temperature was also obtained (Fig. S9 in Supporting information). The trend of developing Ti3+ content with reduction temperature was also consistent with that reflected in O 1s spectrum (Fig. S10 in Supporting information). With the increase of reduction temperature, the TiO2−X obtained by high-temperature reduction exhibited a gradually enhanced signal corresponding to Ti3+–O at 530.5 eV, indicating an increasing trend in the concentration of oxygen defects [41]. The water contact angles were measured for the TiO2/TiO2−X MS and the results indicated a transition from hydrophobicity to hydrophilicity (Fig. S11 in Supporting information). This optimization of the surface structure and chemical composition influences the wettability, enabling more effective participation of the photocatalyst in hydrogen production [42]. The surface modification of the TiO2/TiO2−X MS was also confirmed by Fourier-transform infrared spectroscopy. The wide band at approximately 3422 cm−1 corresponding to the symmetric stretching of O–H observed for the TiO2−X MS indicates that the reduced samples possessed excellent hydrophilicity (Fig. S12 in Supporting information) [43].
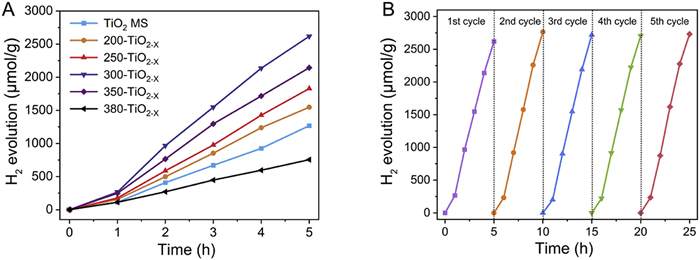
The photocatalytic activities of the TiO2/TiO2−X MS were investigated by water decomposition experiments. Fig. 2A presents plots of the hydrogen evolution over the photocatalysts under simulated sunlight as a function of time, revealing a positive linear correlation. At reduction temperatures up to 350 ℃, all of the reduced TiO2−X MS exhibited enhanced photocatalytic activity compared with the TiO2 MS, in which the hydrogen evolution followed the order of 300-TiO2−X > 350-TiO2−X > 250-TiO2−X > 200-TiO2−X > TiO2 MS > 380-TiO2−X demonstrating a volcano-shaped correlation between the hydrogen evolution and the reduction temperature. It is worth emphasizing that the hydrogen production obtained after reduction at 350 or 380 ℃ was inferior to that observed after reduction at 300 ℃. As shown in Fig. S13 (Supporting information), the TiO2−X MS reduced at 300 ℃ yielded the highest hydrogen evolution rate of 523.7 µmol g-1 h-1, which was more than twofold higher than that measured for the as-prepared TiO2 MS (253.4 µmol g-1 h-1). Even after performing the photocatalytic hydrogen generation experiment five times (25 h), the 300-TiO2−X sample still maintained excellent stability and satisfactory photocatalytic activity, indicating that it can be considered a stable photocatalyst (Fig. 2B, Fig. S14 and Table S3 in Supporting information).
Figure 2
Figure 2.
(A) Comparison of the hydrogen evolution rates of the photocatalysts under simulated sunlight. (B) Recycling runs of 300-TiO2−X for photocatalytic hydrogen generation.
Rhodamine B (RhB) was selected with high chroma and difficult biochemical degradation as a simulated organic pollutant to evaluate the photodegradation abilities of the catalysts. As shown in Figs. S15 and S16 (Supporting information), the reduction treatment using NaBH4 exerted a considerable influence on the photocatalytic activity under simulated sunlight. The photocatalytic activity first increased with increasing reduction temperature to reach a maximum at a temperature of 300 ℃, which afforded an RhB degradation rate of 95.9% after 40 min of illumination, and then decreased as the reduction temperature was further increased. In addition, to study the degradation mechanism and role of free radicals in the photocatalytic process, classical capture experiments were performed to examine the effect of free radicals in the photocatalytic degradation of RhB over 300-TiO2−X [44]. As shown in Fig. S17 (Supporting information), the contributions of these species to the photodegradation of RhB over 300-TiO2−X decreased in the order of e− > •OH > h+ > •O2−. The dependences of the hydrogen production rate and RhB degradation rate on the defect density are plotted in Fig. S18 (Supporting information). It can be seen that the reduction temperature of 300 ℃ afforded the optimal defect density for superior photocatalytic performance (Table S4 in Supporting information).
The above analysis revealed that the photocatalytic efficiency of the TiO2/TiO2−X MS first increased and then decreased with increasing defect concentration. To obtain a comprehensive understanding of the role of the defects, the changes in the electronic structure, energy band structure, optical properties, charge transfer kinetics, and recombination process were further explored.
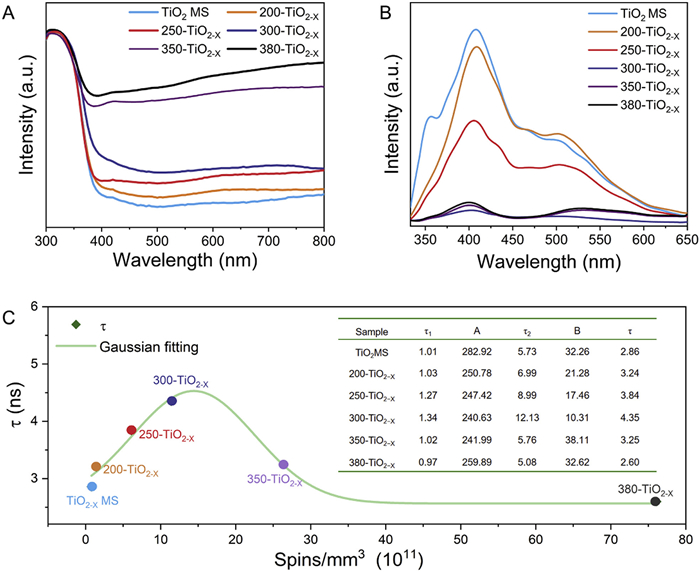
The influence of the oxygen vacancies on the light absorption ability of the photocatalysts was examined by UV–vis diffuse reflectance spectroscopy (DRS), as shown in Fig. 3A. All of the samples exhibited strong absorption with similar intensity in the UV region. In comparison to the TiO2 MS, the visible-light absorption capacity increased continuously as the reduction temperature was increased from 200 ℃ to 380 ℃. The oxygen vacancies introduced during the reduction process cause the generation of defect energy levels and reduce the energy required for electronic transitions. Naturally, a higher degree of reduction is associated with a higher surface oxygen vacancy concentration and even a higher bulk oxygen vacancy concentration, thus increasing the visible-light absorption ability of TiO2−X MS. The narrowing of the bandgap of TiO2-X MS were confirmed by Tauc diagrams in Fig. S19 (Supporting information), in which the Eg bandgap decreased from 3.15 eV for the TiO2 MS to 3.13, 3.11, 2.99, 2.84, and 2.65 eV for the TiO2−X MS in order of increasing reduction temperature.
Figure 3
Figure 3.
(A) UV–vis DRS spectra. (B) Photoluminescence spectra. (C) Dependence of average carrier lifetime on defect concentration.
As shown in Fig. 3B, the main photoluminescence (PL) peak at approximately 420 nm originated from the band-to-band transition of anatase TiO2. The green emission band centered at 525 nm corresponded to a superposition of trapped excitons and various defect-related emission bands [45]. The PL intensities were consistently lower for the reduced TiO2−X MS than for the as-prepared TiO2 MS. In general, a lower PL intensity reflects a lower photoelectron–hole recombination rate and a higher photocatalytic efficiency [46]. The lowest PL intensity was observed for the 300-TiO2−X sample, indicating that an appropriate defect concentration and strain reduced the recombination of photoinduced carriers. It is worth noting that the 350-TiO2−X and 380-TiO2−X samples displayed markedly higher peak emission intensities than the 300-TiO2−X despite their higher defect concentrations and lower crystalline qualities.
Besides the light absorption properties, the photocatalytic efficiency of a photocatalyst also depends on the generation, separation, and transmission of the photoinduced carriers. Owing to the presence of shallow energy levels associated with defects near the conduction and valence band edges that protect the electron–hole pairs from recombination, the band edge states play a crucial role in determining the carrier properties of a material [47]. Therefore, we performed time-resolved photoluminescence (TRPL) to quantitatively investigate the lifetimes of the photoexcited charge carriers in the TiO2/TiO2−X MS, as shown in Fig. S20 (Supporting information). The decay curves were fitted using a biexponential decay model. The fitted data are shown in Table S2 (Supporting information), in which the fast neutron lifetime (τ1) was ascribed to the capture of photocarriers by defects while the slow neutron lifetime (τ2) corresponded to electron–hole recombination between the conduction band (CB) and valence band (VB) [48]. In accordance with the relationship between temperature and defect concentration, the TiO2−X MS exhibited initial increases in both the fast and slow electron lifetimes with increasing vacancy concentration, reaching maximum carrier lifetimes of τ1 = 1.34 ns and τ2 = 12.13 ns at 300 ℃. Subsequently, the excessive defect concentration at higher temperatures caused decreases in the carrier lifetimes (Fig. 3C). The charge transfer properties were further evaluated by electrochemical impedance spectroscopy and the Nyquist semicircle plots for the different reduction temperatures were obtained, as presented in Fig. S21 (Supporting information). The lowest arc radius was observed for the 300-TiO2–X sample, which proves that this catalyst possessed superior electronic conductivity for optimizing the charge transfer from the interior to the sample surface. As shown in Fig. S22 (Supporting information), the photocurrent intensity was significantly higher for the 300-TiO2–X sample, indicating that an appropriate oxygen vacancy concentration and lattice strain contributed to enhanced charge separation and transfer efficiency. These results also illustrate that the structural modification induced by the appropriate defect concentration effectively inhibited charge recombination, thus providing direct and quantitative support for the optimal photocatalytic performance of the 300-TiO2–X sample.
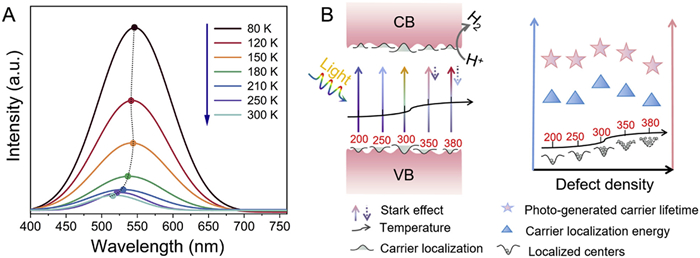
The advantages of defects include improved light absorption and enhanced carrier separation resulting from local effects. Because light absorption is enhanced with increasing defect density, the influence of the defect density on photocatalytic efficiency was explored by analyzing the change in the localized defect density. Temperature-dependent PL spectra for TiO2 MS, 300-TiO2–X MS, 380-TiO2–X MS are shown in Fig. 4A and Fig. S23 (Supporting information), and the variation of the emission peak energy positions with increasing temperature for the reduced TiO2–X MS was found to be significantly different from that for the as-prepared TiO2 MS. In the case of the TiO2 MS, the emission peak energy position showed a slight shift phenomenon, while the reduced 300-TiO2−X samples displayed a more obvious abnormal V-shaped behavior of blue-shift after obvious red-shift of PL peak position. For a typical compound semiconductor, the PL peak position exhibits a red shift with increasing temperature as expressed by Varshni’s equation [49]:
(1)
Figure 4
Figure 4.
(A) Temperature-dependent PL spectra of the 300-TiO2−X sample with an excitation wavelength of 325 nm after Gaussian fitting. (B) Possible reaction mechanism for solar-driven photocatalytic processes over the TiO2−X MS.
where Eg is the energy gap, T is temperature, and α and β are constants. The temperature-dependent PL peak energy of the reduced TiO2−X samples was similar to the phenomenon observed owing to localized states, resulting from defects in compound semiconductors [50]. The red shift observed for the reduced TiO2−X sample in Fig. 4A was attributable to the thermal energy of the localized carriers being insufficient to overcome the localization potential, causing them to relax to lower-lying localized states before recombination. As the temperature was increased, the thermalized carriers underwent activation to higher energy states and hence the PL peak shifted to higher energy. Bandgap fluctuations resulting from carrier localization could be represented by the band tail states theoretically. On the basis of the band-tail model, the temperature-dependent emission energy curve could be fitted by the following relation [51]:
(2)
where KB is the Boltzmann constant, Eg(T) is a regular temperature dependence of the band gap described by Eq. 1, and σ is the energy difference between the local energy level and the local center, representing the maximum energy range of the Gaussian distribution of the trailing band energy levels. The obtained values of the broadening parameter σ were 2.4, 2.3, 3.4, 3.2, and 1.6 meV for the reduction temperatures of 200, 250, 300, 350, and 380 ℃, respectively. A higher value of σ is associated with a greater degree of localization.
To analyze the localization states, the absorption edge including the effects of broadening could be described by fitting the rising edge (α) and plateau of the absorption (α0) [52]:
(3)
where EB is the "effective bandgap" of the sample and ∆E is a broadening parameter equivalent to the localization energy due to oxygen vacancies. Eq. 3 was used to obtain the carrier localization energy level values (∆E) for the 200-TiO2–X, 250-TiO2–X, 300-TiO2–X, 350-TiO2–X, and 380-TiO2–X samples as 0.0029, 0.028, 0.125, 0.108, and 0.075 eV, respectively. More importantly, the variation of the carrier localization energy with the defect concentration was similar to that of the efficiency of the photocatalysts containing defects, indicating that the localization state has an important effect on the catalytic performance.
The detailed energy band structures of the photocatalysts were examined by density functional theory (DFT) calculations, low-temperature PL measurements, XPS valence band spectra, and Mott–Schottky curve analysis, and the complete band location is obtained (Figs. S24-S26 in Supporting information). The excellent photocatalytic performance of the reduced TiO2–X MS was ascribed to the vicinity of the introduced defect level to the valence band and the more negative conduction band strengthening the redox properties.
On the basis of the above results, a plausible reaction mechanism for the solar-driven photocatalytic processes over the TiO2−X MS was proposed as illustrated in Fig. 4B. As the oxygen vacancy concentration increased from 1.88 × 10⁶ spins/Ti atom to 2.37 × 10⁵ spins/Ti atom (200-TiO2–X to 300-TiO2–X), the carrier localization value increased. At this point, the quantum-confined Stark effect dominates the carrier localization [53], which leads to enahanced separation of the photogenerated carriers, increasing electrical conductivity, resulting in the continuous improvement of photocatalytic performance. As the oxygen vacancy concentration further increased from 2.37 × 10⁵ spins/Ti atom to 6.22 × 10⁴ spins/Ti atom (300-TiO2–X to 380-TiO2–X), it can be seen that the half-height width of Luminous peak measured at same temperature widened and Luminescent peak position red shift gradually (Fig. S23B). The weakening of the Stark effect is particularly important, in addition to the decrease in crystal quality due to the increase in the concentration of oxygen vacancies. At this point, taking into account the increase in localised states, the resonance attempts of electrons and microstrip transport allow for "forbidden" transitions, the decrease in carrier localisation, and higher defect concentrations lead to an increase in the number of non-radiative complex centres, which results in enhanced light absorption and reduced carrier localisation, ultimately leading to a decrease in photocatalytic performance [54].
In summary, a series of TiO2−X MS with various oxygen vacancy concentrations were prepared by a simple high-temperature reduction method using sodium borohydride. Compared with the as-prepared TiO2 MS, the reduced TiO2−X MS exhibited excellent hydrogen production performance. In particular, the TiO2−X MS obtained at a reduction temperature of 300 ℃ afforded a photocatalytic hydrogen evolution rate of 523.7 µmol g-1 h-1 under simulated sunlight and an RhB degradation efficiency as high as 95.9% after 40 min. Mechanistic analysis revealed that significant lattice strain occurred at the TiO2−X containing oxygen defects, and electrons gather around oxygen atoms to modulate the electronic structure, and the doping of oxygen defects improves the surface hydrophilicity by increasing the humidity stability. More importantly, the Stark effect induced by the introduction of oxygen vacancies in the defect area enhances light absorption and promotes efficient carrier separation. This effect creates a conducive environment for photocatalysis. However, as the number of oxygen vacancies continues to increase, the Stark effect gradually weakens, leading to a decrease in photocatalytic efficiency. This work provides new insights for defect engineering and lattice strain modulation of photocatalyst surfaces and band structures to assist with the preparation of efficient photocatalytic systems for both hydrogen production and pollutant degradation.
Declaration of competing interest
The authors declare that they have no known competing financial interests or personal relationships that could have appeared to influence the work reported in this paper.
This work was supported by the National Key Research and Development Program of China, (No. 2019YFA0705201), and the National Natural Science Foundation of China (No. U2032129).
Supplementary materials
Supplementary material associated with this article can be found, in the online version, at doi:10.1016/j.cclet.2024.110254.
[1]
H. Nishiyama, T. Yamada, M. Nakabayashi, et al., Nature 598 (2021) 304–307. doi: 10.1038/s41586-021-03907-3
[2]
Z.Z. Li, S.J. Wang, J.X. Wu, W. Zhou, Renew. Sust. Energy Rev. 156 (2022) 111980. doi: 10.1016/j.rser.2021.111980
Figure 1
(A) TEM images of the as-prepared TiO2 MS and the TiO2−X MS obtained at different reduction temperatures (inset: HRTEM images). (B) EPR spectra of the TiO2/TiO2−X MS (diamond: g = 2.003, club: g = 1.988). (C) Variation of the lattice strain measured by TEM (left y axis) and the normalized defect concentration measured by EPR (right y axis) with the reduction temperature.
Figure 2
(A) Comparison of the hydrogen evolution rates of the photocatalysts under simulated sunlight. (B) Recycling runs of 300-TiO2−X for photocatalytic hydrogen generation.
Figure 4
(A) Temperature-dependent PL spectra of the 300-TiO2−X sample with an excitation wavelength of 325 nm after Gaussian fitting. (B) Possible reaction mechanism for solar-driven photocatalytic processes over the TiO2−X MS.

 DownLoad:

 下载:
下载:


