Department of Chemistry, Shanghai Stomatological Hospital & School of Stomatology, State Key Laboratory of Molecular Engineering of Polymers, Shanghai Key Laboratory of Molecular Catalysis and Innovative Materials, iCHEM, Fudan University, Shanghai 200433, China
b.
Frontier Institute of Chip and System, State Key Laboratory of ASIC and System, Fudan University, Shanghai 200433, China
c.
State Key Lab of Transducer Technology Shanghai Institute of Microsystem and Information Technology Chinese Academy of Sciences, Shanghai 200050, China
kpyuan@fudan.edu.cn (K. Yuan). 1 These authors contributed equally to this work.
Received Date:
02 April 2024 Accepted Date:
11 June 2024 Revised Date:
17 May 2024 Available Online:
15 November 2024
Abstract:
As a key biomarker for noninvasive diagnosis of diabetes, the selective detection of trace acetone in exhaled gas using a portable and low-cost device remains a great challenge. Semiconductor metal oxide (SMO) based gas sensors have drawn signification attention due to their potential in miniaturization, user-friendliness, high cost-effectiveness and selective real-time detection for noninvasive clinical diagnosis. Herein, we propose a one-pot solvent evaporation induced tricomponent co-assembly strategy to design a novel ordered mesoporous SMO of silica-implanted WO3 (SiO2/WO3) as sensing materials for trace acetone detection. The controlled co-assembly of silicon and tungsten precursors and amphiphilic diblock copolymer poly(ethylene oxide)-block-polystyrene (PEO-b-PS), and the subsequent thermal treatment enable the local lattice disorder of WO3 induced by the amorphous silica and the formation of ordered mesoporous SiO2/WO3 hybrid walls with a unique metastable ε-phase WO3 framework. The obtained mesoporous SiO2/WO3 composites possess highly crystalline framework with large uniform pore size (12.0–13.3 nm), high surface area (99–113 m2/g) and pore volume (0.17–0.23 cm3/g). Typically, the as-fabricated gas sensor based on mesoporous 2.5%SiO2/WO3 exhibits rapid response/recovery rate (5/17 s), superior sensitivity (Rair/Rgas = 105 for 50 ppm acetone), as well as high selectivity towards acetone. The limit of detection is as low as 0.25 ppm, which is considerably lower than the thresh value of acetone concentration (>1.1 ppm) in the exhaled breath of diabetic patients, demonstrating its great prospect in real-time monitoring in diabetes diagnosis. Moreover, the mesoporous 2.5%SiO2/WO3 sensor is integrated into a wireless sensing module connected to a smart phone, providing a convenient real-time detection of acetone.
The detection of volatile organic compounds (VOCs) in exhaled breath is a promising noninvasive and safe approach for screening medical conditions [1-5]. The chemical composition and concentration of exhaled breath in humans represent their real-time health state. For instance, acetone is one of the earliest identified gaseous disease biomarkers in breath associated with type-1 diabetes [6-8]. Exhaled acetone is mainly generated by hepatocytes via decarboxylation of excess acetyl-coenzyme A [9]. Inadequate blood glucose management in diabetes patients can result in higher acetone levels (>1.8 ppm) in exhaled breath compared to that of healthy individuals (<0.9 ppm) [10,11]. Although many advanced noninvasive detection technologies have been developed in recent years, such as gas chromatography [12], mass spectrometry [13], optical absorption [14], and colorimetric analysis [15], most of them require complex and large-scale instruments for measurement. To achieve convenient and cost-effective detection of exhale breath for clinical applications, various approaches have been explored by designing significantly portable, easier-to-use, real-time monitoring and low-cost devices. It is noteworthy that chemical sensor devices based on nanomaterials have emerged as the promising alternative tools for modern point-of-care practice [16-19]. Among them, chemo-resistive gas sensors with semiconductor metal oxides (SMOs) as sensing materials have great potential because they are less expensive, easier to use and more suitable for miniaturization than conventional measurement approaches [20-29].
In order to achieve accurate and real-time concentration of the monitoring target gas in complex exhaled breath, the gas sensors should possess high sensitivity, good selectivity and fast response/recovery rate. Therefore, considerable efforts have been made to synthesize SMOs-based sensing materials with tunable compositions/nanostructures and surface/interface properties [30,31], which can further guarantee the selectivity to ensure exact recognition of a specific biomarker. Notably, the synthesis of multicomponent metal oxides is an effective strategy to introduce the nanocomposite with specific crystal planes or phases, which can greatly improve the sensitivity and selectivity and facilitate the reliable detection of target gas [32-36]. WO3 is widely recognized as an important n-type semiconductor in heterogeneous catalysis and gas sensing, due to its relatively narrow band gap. Recent studies have shown that modification of WO3 nanomaterials by doping or introducing foreign heteroatoms or components can further tune their gas sensing behavior because of the changed chemical microenvironment of the nanostructures [37,38]. Owing to spontaneous electric dipole moment, the ε-phase WO3 has been reported to show enhanced interaction with the analytes of high dipole moment (e.g., acetone), leading to the increase of sensitivity and selectivity in detection of acetone gas [32,39]. The ε-phase WO3 material can be synthesized through flame spray pyrolysis of tungsten precursors with chromium ions or silica precursors [40,41]. However, these solid ε-phase WO3 materials with ill-defined structure and low specific surface area exhibit few exposed active sites and limited gas-solid interfaces, and thus the gas sensing performance needs to be further improved. The porosity of SMOs has been proved to play a critical role in obtaining high sensitivities due to the facile penetration and diffusion of gas molecules dominated by Knudsen diffusion [42]. The rational design of ordered mesoporous SMOs is of great interest to enhancing the gas sensing performance, due to that the materials with high surface areas would expose more active sites and favor the formation of surface-chemisorbed oxygen species. Besides, the interconnected and controllable mesopores with developed porosity would facilitate gas diffusion, and the highly crystalline solid framework could maintain long-term stability of gas sensors [43-45]. However, to date, the controllable one-pot synthesis of SMO materials with desired porosity, modified surface properties and crystalline framework remained to be explored.
Herein, ordered mesoporous silica-implanted WO3 (SiO2/WO3) composites were synthesized with a facile one-pot solvent evaporation induced tricomponent co-assembly strategy by using diblock copolymer PEO-b-PS as the structure directing agent, and WCl6 and tetraethyl orthosilicate (TEOS) as the tungsten and silicon precursors, respectively. By precisely controlling the co-hydrolysis and calcination of tungsten and silicon precursors, the local lattice disorder of WO3 was induced by chemically mixed amorphous silica to generate ε-phase WO3. The obtained mesoporous SiO2/WO3 materials exhibit highly crystalline framework with large uniform pore size (12.0–13.3 nm), high surface area (99–113 m2/g) and pore volume (0.17–0.23 cm3/g). Gas sensing measurement reveals that the mesoporous silica-implanted ε-WO3 shows superior sensing performance to acetone in exhaled breath. The mesoporous 2.5%SiO2/WO3 exhibits the highest sensitivity (Rg/Ra=105 to 50 ppm acetone), fastest response/recovery rate (5/17 s to 50 ppm acetone) and low limit of detection (0.25 ppm). This gas sensor was successfully integrated to the wireless sensor module connected to a mobile phone via Bluetooth, which achieves a real-time detection of acetone, showing a promising application in convenient noninvasive diagnosis of diabetes in the human breath. The sensing mechanism was proposed that the improved selectivity to acetone is ascribed to the enhanced adsorption of polar acetone molecules onto the surface of ε-WO3 induced by insertion of Si species.
Scheme 1 illustrates the synthesis of ordered mesoporous silica-implanted tungsten oxide (SiO2/WO3) through a ligand-assisted solvent evaporation induced co-assembly strategy, in which PEO-b-PS copolymers and tetrahydrofuran (THF) are used as the soft template and the solvent, respectively. Acetyl acetone as chelating agent can effectively match the hydrolysis and condensation rate of TEOS and WCl6, leading to the formation of homogeneous inorganic silicon and tungsten precursors. These precursors can steadily interact with the hydrophilic PEO segments of PEO-b-PS molecules by hydrogen bonding to prohibit phase separation. During the evaporation process of THF, the PEO-b-PS molecules combined with inorganic precursors gradually assemble into spherical micelles, which are composed of hydrophobic PS segments as the core and inorganic species-attached PEO segments as the shell. As the solvent further evaporates, these micelles are driven to self-assemble and pack into organic-inorganic composites with face-centered cubic (fcc) ordered mesostructure to decrease the interface free energy [46]. During followed pyrolysis process under nitrogen atmosphere, the PEO segments are completely decomposed, and the PS segments with sp2-hybridized carbon are converted into solid residual carbon. Both the carbon and the silica can act as a rigid support to prevent mesopore collapse when the tungsten oxide nucleates and sinters into mesoporous walls [47]. Finally, the residual carbon is thoroughly removed by calcination in air, leaving highly crystalline ordered mesoporous SiO2/WO3 hybrid materials behind.
Scheme 1
Scheme 1.
The co-assembly mechanism and synthesis process of ordered mesoporous SiO2/WO3. Step 1, with continual evaporation of THF, PEO-b-PS copolymers can co-assemble with tungsten and silicon precursors to form spherical micelles with a PS core and a PEO/inorganic species shell. After complete evaporation of solvent and thermosetting for solidification, the spherical micelles further self-aggregate into organic-inorganic composites (A) with fcc mesostructures; Step 2, by high-temperature pyrolysis of PEO-b-PS copolymers under N2 atmosphere, the as-made composites are transformed into carbon-supported mesoporous SiO2/WO3/C materials (B); Step 3, further calcination in air is conducted to remove the supporting carbon, and the crystalline ordered mesoporous SiO2/WO3 composites (C) are obtained.
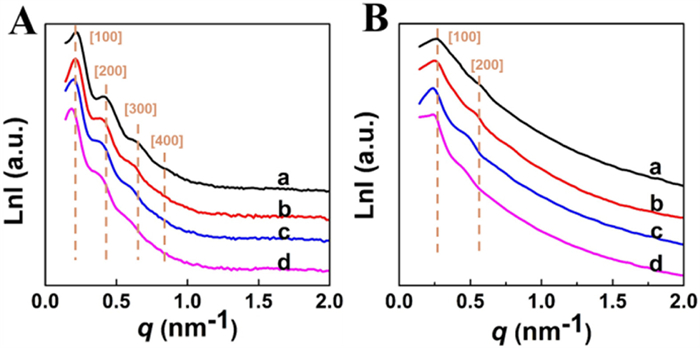
Small angle X-ray scattering (SAXS) patterns of mesoporous SiO2/WO3/C samples display four well-resolved scattering peaks, suggesting high degree of long-range order (Fig. 1). The q values of the four scattering peaks in mesoporous WO3/C are 0.213, 0.426, 0.625, and 0.839 nm−1 (Fig. 1A-a), which have a ratio of 1:2:3:4 and can be exactly indexed as [100], [200], [300]/[221], and [400] reflections of well-ordered fcc mesostructure, respectively [48,49]. The unit-cell parameter of mesoporous WO3/C is calculated to be as large as 29.5 nm. The q values and calculated unit-cell parameters of the mesoporous SiO2/WO3/C with different SiO2 amount are similar with those of mesoporous WO3/C. After further calcination in air, the black composites were converted into light green crystalline powder. The SAXS patterns of the calcined samples still have two resolved scattering peaks with slightly lower intensities and larger q values (Fig. 1B), revealing remaining of the ordered mesoporous structures but slight shrinkage of the mesoporous framework after removal of carbon support at high temperatures. The q values of the two scattering peaks in mesoporous WO3 are 0.270 and 0.541 nm−1 (Fig. 1B-a), respectively. The unit-cell parameter of mesoporous WO3 is about 23.3 nm, which is smaller than that of mesoporous WO3/C, confirming framework shrinkage of mesoporous WO3. Interestingly, the unit-cell parameters gradually increase when increasing the amount of implanted silica in mesoporous walls (Table S1 in Supporting information). It is worth noting that the unit-cell parameter of mesoporous 5%SiO2/WO3 is nearly equal to that of mesoporous 5%SiO2/WO3/C, indicating that the implanted silica can effectively prohibit the framework shrinkage during calcination.
Figure 1
Figure 1.
SAXS patterns of ordered mesoporous SiO2/WO3 composites (A) decomposed under nitrogen atmosphere: (a) WO3/C, (b) 1%SiO2/WO3/C, (c) 2.5%SiO2/WO3/C, and (d) 5%SiO2/WO3/C; (B) calcinated in air: (a) WO3, (b) 1%SiO2/WO3, (c) 2.5%SiO2/WO3, and (d) 5%SiO2/WO3.
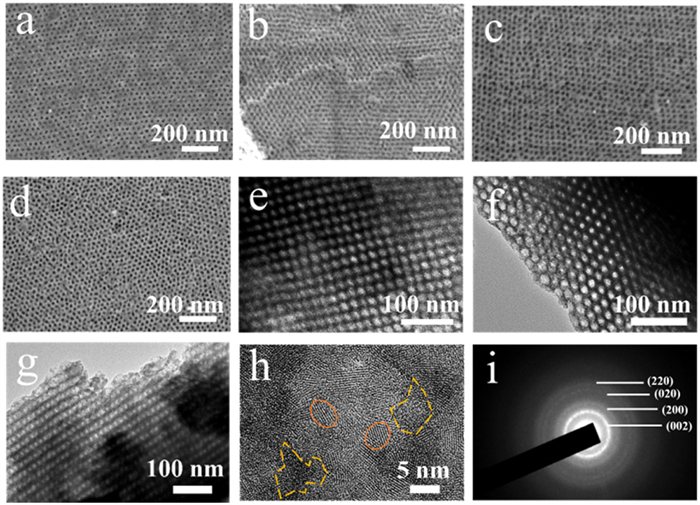
Field-emission scanning electron microscopy (FESEM) images reveal that all the SiO2/WO3/C samples exhibit large-domain ordered mesoporous structures with uniform spherical mesopores both on surface and cross section (Fig. S2 in Supporting information), indicating a long-range mesostructural regularity from carbonization of the organic-inorganic composites. The addition of silica components has nearly no influence on the assembly procedure and formation of mesoporous composites. After further calcination in air, the SiO2/WO3 samples show opened mesopores regularly aligned in large domains over rough surface, owning to the removal of residual carbon inside mesopores during high-temperature thermal treatment (Figs. 2a-d). The remaining of highly ordered mesoporous structure with uniform pore size suggests good thermal stability of the obtained SiO2/WO3 frameworks. The transmission electron microscopy (TEM) images of n%SiO2/WO3 samples (n = 0, 1, 2.5, 5) further confirm the regular mesostructures with large spherical mesopores and thick pore walls over a large area (Fig. S3 in Supporting information). Moreover, the TEM images of 2.5%SiO2/WO3 recorded along the [100], [110], and [211] directions (Figs. 2e-g) prove a highly ordered mesostructure with typical fcc symmetry. The unit-cell parameter of this sample is estimated to be about 26 nm from TEM images, in good agreement with the value calculated from the SAXS pattern (Table S1). The high-resolution TEM (HRTEM) image (Fig. 2h) clearly exhibits amorphous SiO2 regions and ultrasmall crystallized WO3 with crystal lattice grains in pore walls, both of which are uniformly integrated throughout the mesoporous framework. The polycrystalline walls of mesoporous SiO2/WO3 can also be proved by the distinct concentric rings in the selected area electron diffraction (SAED) pattern (Fig. 2i).
Figure 2
Figure 2.
SEM images of the crystalline ordered mesoporous SiO2/WO3 composites: (a) WO3, (b) 1%SiO2/WO3, (c) 2.5%SiO2/WO3, (d) 5%SiO2/WO3. TEM images of the sample of 2.5%SiO2/WO3 viewed from the directions of (e) [100], (f) [111] and (g) [210]. (h) HRTEM image of 2.5%SiO2/WO3 and (i) its SAED pattern. Representative amorphous SiO2 and crystallized WO3 regions were highlighted by yellow and orange circles, respectively.
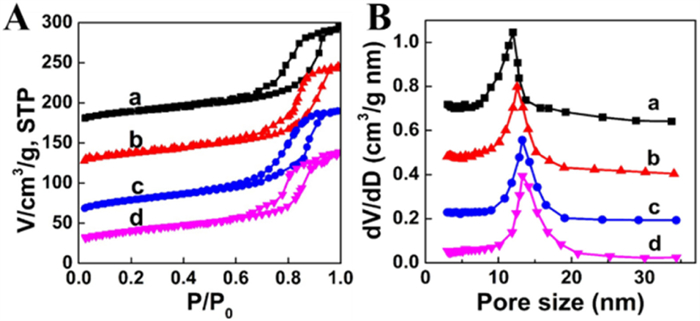
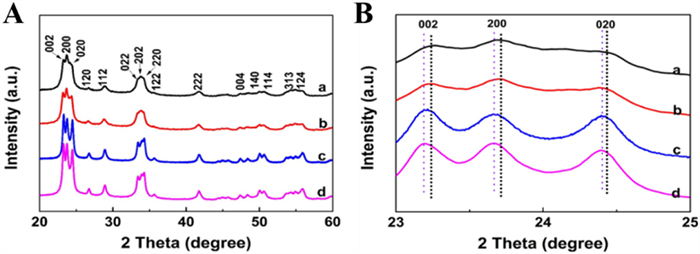
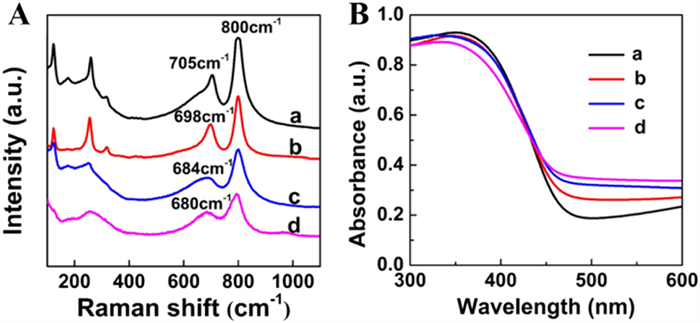
Nitrogen adsorption-desorption isotherms of all the SiO2/WO3 samples present type-Ⅳ curves with a sharp capillary condensation step at high relative pressure (P/P0 ~ 0.8) and H1-type hysteresis loop (Fig. 3A), revealing the existence of uniform spherical mesopores in large size. Interestingly, as the amount of modified silica increases, the capillary condensation step slightly shifts to high relative pressure ranges, due to gradual increase of pore size. The pore size distribution curves derived from the adsorption branches by using the Broekoff-de Boer model indicate uniform pore sizes of the mesoporous SiO2/WO3 composites. The average pore size slightly rises from 12.0 nm to 13.3 nm with the increase of SiO2 content (Fig. 3B and Table S1), revealing that the implanted amorphous SiO2 species can obviously prohibit framework shrinkage after removal of residual carbon. The Brunauer-Emmett-Teller specific surface areas and pore volumes of the mesoporous SiO2/WO3 samples are in the range of 93–111 m2/g and 0.19–0.23 cm3/g, respectively (Table S1). Due to the low density of implanted silica, the specific surface area of sensing materials increases as the amount of silica increases. It suggests that the modified silica components can not only restrain the collapse of mesopores, but also contribute more pores. Wide-angle X-ray diffraction (XRD) patterns of the mesoporous WO3 show typical diffraction peaks assigned to the monoclinic phase of crystalline γ-WO3 (JCPDS No. 43–1035). The diffraction intensity of mesoporous SiO2/WO3 composites is nearly the same with that of pure mesoporous SiO2, indicating that the implantation of silica species in framework has little influence on the crystallization of WO3 (Fig. 4A). It is noteworthy that with the increase of silicon content, three diffraction peaks attributed to [002], [200] and [020] reflections slightly shifted to the low-angle region (Fig. 4B). It suggested that the implantation of SiO2 into the WO3 lattice can increase the cell size. Raman spectroscopy is an effective characterization method in revealing structural information about the position evolution of tungsten atoms [50], which can be used to identify the minor structural changes of WO3 when undergoing a phase transition after SiO2 modification. The Raman spectrum of pure mesoporous WO3 (Fig. 5A-a) exhibits five well-resolved peaks centered at 122.8, 177.6, 259.2, 315.1, 705.8 and 800 cm−1 referred to monoclinic γ phase WO3 (space group: P21/n) [51]. With increase of the SiO2 content, the peak at about 705 cm−1 assigned to the stretching mode of W-O bond shows a dramatic red shift at 698, 684 and 680 cm−1 for 1%SiO2/WO3, 2.5%SiO2/WO3 and 5%SiO2/WO3, respectively (Fig. 5A), indicating the enhancement of the asymmetric stretching of W-O bond [52]. Significantly, the crystalline structure of pure WO3 is a typical three-dimensional network of corner-sharing [WO6] octahedrons. Therefore, the incorporation of SiO2 can lead to the distortion of the symmetric structure of [WO6] octahedrons and formation of acentric ε-phase WO3 [44]. Moreover, the peak intensity of the W-O-W stretching and bending modes gradually decreases with the increase of silica amount, mainly due to the shielding effects of the amorphous SiO2 species in framework [53]. Diffusive reflectance UV–vis spectroscopy is usually used to depict the energy band structures of SiO2/WO3 composites. The UV–vis diffuse reflectance spectra (Fig. 5B) illustrate that the light absorption of the mesoporous SiO2/WO3 composites is extended with the increased SiO2 species, which moves toward longer wavelengths, leading to narrowing of the band gaps (Table S1) [54]. According to the Tauc plots, the optical bandgap of 2.5%SiO2/WO3 is 2.5 eV, which is about 0.13 eV lower than that of pure WO3. The reduction of band gaps can be ascribed to the increase of W5+ concentration and oxygen vacancies by introduction of silica species [55].
Figure 3
Figure 3.
(A) N2 adsorption-desorption isotherms and (B) pore size distribution curves of the ordered mesoporous SiO2/WO3 composites: (a) WO3, (b) 1%SiO2/WO3, (c) 2.5%SiO2/WO3 and (d) 5%SiO2/WO3. The N2 adsorption-desorption isotherms of (a) WO3, (b) 1%SiO2/WO3, (c) 2.5%SiO2/WO3 were offset vertically 120, 60, 20 cm3/g.
Figure 4.
(A) XRD patterns of the ordered mesoporous SiO2/WO3 composites: (a) WO3, (b) 1%SiO2/WO3, (c) 2.5%SiO2/WO3 and (d) 5%SiO2/WO3. (B) Enlagerd view in the region of 23°–25°.
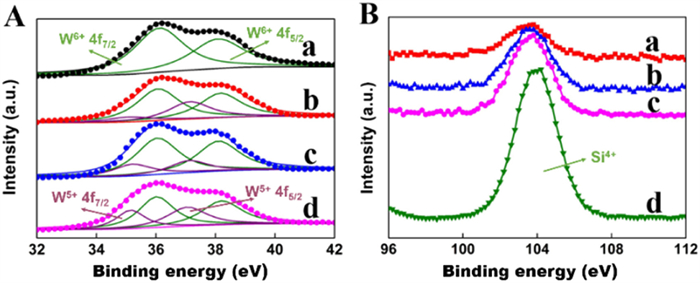
X-ray photoelectron spectroscopy (XPS) was used to deeply investigate the valence states of surface elements of the obtained mesoporous SiO2/WO3 composites (Fig. 6). Two fitted peaks centered at 36.2 and 38.2 eV are observed in W 4f XPS spectrum of mesoporous WO3 (Fig. 6A-a), corresponding to the W6+4f7/2 and W6+4f5/2, respectively. In comparison, the W 4f XPS spectra of mesoporous SiO2/WO3 samples can be deconvoluted into two types of peaks (Fig. 6A-b to d), which are assigned to the binding energies of two typical W oxidation states for W6+ (38.2 and 36.2 eV) and W5+ (centered at 37.0 and 35.0 eV), respectively [47]. With the increase of silica content from 1% to 5%, the content of W5+ in mesoporous SiO2/WO3 composites increases from 19.1% to 28.6% (Table S2 in Supporting information). The binding energy shift of W to lower positions and the incresing content of W5+ reveal the structural distortion of [WO6] octahedrons and variation of the coordination states of the W-O bonds [54]. The Si 1s XPS spectra (Fig. 6B) of mesoporous SiO2/WO3 exhibit a broad peak at 104.0 eV attributed to Si4+ from the Si-O bond of SiO2 [56]. The O 1s XPS spectra of all samples were also investigated. Mesoporous WO3 only exhibits a main peak at 530.3 eV attributed to lattice oxygen O2− and another trivial peak at 532.0 eV belonged to molecular-type adsorbate O2− (Fig. S4A in Supporting information), meaning that the mesoporous WO3 possess little oxygen vacancy (531.0 eV). As shown in Figs. S4B-D (Supporting information), the content of molecular-type adsorbate oxygen and oxygen vacancy increase as the introduction of more silica into the mesoporous matrix, proving that the distortion of [WO6] octahedrons can bring about oxygen vacancy.
Figure 6
Figure 6.
(A) Normalized W 4f XPS spectra: (a) WO3, (b) 1%SiO2/WO3, (c) 2.5%SiO2/WO3, and (d) 5%SiO2/WO3. (B) Si 1s XPS spectra: (a) 1%SiO2/ WO3, (b) 2.5%SiO2/WO3, (c) 5%SiO2/WO3, and (d) mesoporous SiO2.
Previous studies have revealed that acetone in exhaled breath is one of the typical disease biomarkers related to metabolic disorders such as diabetes [10,11]. Therefore, it is highly urgent to develop emerging technologies for noninvasive diagnostics of acetone concentration in diabetics breath, and the chemo-resistive sensors with metal oxides as sensing materials have attracted great attention because of their rapid detection, device miniaturization and low cost. As one of the most representative gas-sensitive materials, ε-phase WO3 with a spontaneous electric dipole moment show a potential application in acetone sensing. In this work, mesoporous WO3 and SiO2/WO3 hybrid materials were utilized to construct sensors to study their acetone sensing performance on the established measurement system.
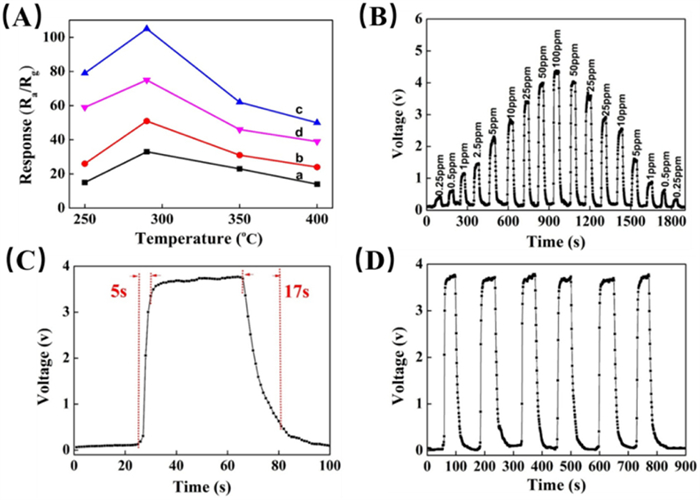
The operating temperature is one of the most important influence factors on the sensing performance for gas sensors [57]. In this study, the responses of mesoporous SiO2/WO3 samples toward 50 ppm acetone at different operating temperatures of 250–400 ℃ are displayed in Fig. 7A. The response of all sensors first increases with operating temperature up to 290 ℃, due to the activation of adsorbed molecular oxygen on the material surface to form active oxygen species (O2−, O− and O2−), which can oxidize acetone into CO2 and H2O over materials surface [58]. The adsorption/desorption process and surface chemical reaction of the acetone molecules would achieve a balance at 290 ℃, exhibiting the highest response value at the optimal operating temperature. When the temperature continues to increase, the sensor response gradually declines, because of the reduction of surface coverage of O2 and acetone molecules by progressive desorption [52]. Therefore, 290 ℃ was adopted as the optimal operating temperature for the following study. Moreover, all the mesoporous silica-implanted WO3 based sensors show higher responses than the pure mesoporous WO3 based sensor at the same operating temperature (Fig. 7A). Notably, the responses first increase and then decrease with the increasing of silica amount, and the sensor based on mesoporous 2.5%SiO2/WO3 exhibits the highest response. As a typical ferroelectric material, the ε-WO3 crystals show spontaneous electric dipole moment, resulting from tungsten atoms being displaced from the core of [WO6] octahedrons [34]. Additionally, the acetone molecules exhibit larger dipole moment than other gases. Consequently, the adsorption of acetone molecules on the ε-WO3 could be much stronger than that of pure γ-WO3, which enables SiO2/WO3 exhibit higher sensitivity toward acetone. However, the response decreases when the SiO2 amount increases to 5%. The WO3 nanocrystals in pore walls are separated by excess dielectric SiO2 regions, which own electrically isolated nanostructures and remain high resistance, resulting in lower response to acetone [59]. Therefore, the sensing properties of the mesoporous 2.5%SiO2/WO3 based sensor are superior to those of the other hybrid composites, which has been chosen for further investigation.
Figure 7
Figure 7.
(A) Response of mesoporous SiO2/WO3 composites-based sensors to 50 ppm acetone at different operating temperatures: (a) WO3, (b) 1%SiO2/WO3, (c) 2.5%SiO2/WO3, and (d) 5%SiO2/WO3. (B) Response-recovery curve of the mesoporous 2.5%SiO2/WO3-based sensor to acetone gas of different concentrations (0.25–100 ppm) at 290 ℃. (C) Response-recovery time and (D) cycling stability of the mesoporous 2.5%SiO2/WO3-based sensor to acetone gas of 50 ppm at 290 ℃.
The mesoporous 2.5%SiO2/WO3 based sensor exhibited excellent reversibility and repeatability of dynamic electrical response (Fig. 7B). It exhibits an increasing response to acetone gas across a range of concentrations from 0.25 ppm to 100 ppm (Fig. S5 in Supporting information). Then the response gradually decreases as the acetone concentration decreases from 100 ppm to 0.25 ppm, showing a good stability of the sensor. Notably, the maximal value of the response to acetone is 158 at 100 ppm, and the detection limit is down to 0.25 ppm. This detection limit is even lower than the average acetone concentration found in healthy human breath (0.3–0.9 ppm) [6,34]. This superior sensitivity toward acetone is mainly due to high surface area and appropriate grain size of the obtained SiO2/WO3 composite material. The selectivity of mesoporous 2.5%SiO2/WO3 to different interfering gases of 50 ppm at 290 ℃ is shown in Fig. S6 (Supporting information). The mesoporous 2.5%SiO2/WO3 composite displays excellent selectivity towards acetone gas, as evidenced by the high response (over 150) to acetone and low responses (below 10) to other gases. Considering that the gas sensing mechanism of the semiconductor sensor is usually attributed to the oxygen adsorption and reaction on material surface, more adsorption sites are induced from the high exposed surface for sensing reaction. Meanwhile, according to the electronic depletion layer theory, when the crystal size is smaller than double Debye length, the electron transition in the depleted inter crystal boundaries can be amplified, leading to a depleted bottleneck-controlled mechanism that can reduce the total resistance and maximize the response as well. The thin pore walls of mesoporous SiO2/WO3 material are made of tiny WO3 grains with average crystal size of about 8.0 nm, which can be fully depleted to increase the sensitivity to acetone gas. The mesoporous 2.5%SiO2/WO3 based sensor displays very short response (5 s) and recovery time (17 s) to 50 ppm acetone gas (Fig. 7C). Such a fast response/recovery rate primarily benefits from the well-defined and interconnected pore structure of mesoporous SiO2/WO3 composites, which not only shortens the diffusion distance of acetone molecules, but also ensures fast transport of charge carriers throughout the whole material. The reversible cycles of the response curves further illustrate a stable and reliable operation of acetone sensing, due to the good stability of 3D interconnected frameworks in the highly crystalline mesoporous SiO2/WO3 composites even calcination at high temperature (Fig. 7D). In order to ensure the anti-interference ability to the humidity, simulated acetone sensing was conducted on the mesoporous 2.5%SiO2/WO3 based sensor toward 50 ppm acetone under various relative humidity (Fig. S7 in Supporting information), exhibiting high response value of approximately 60 even at the relative humidity of 90%. The promising sensing performance to acetone and strong anti-humidity ability reveals a potential application in fast and noninvasive detection of exhaled acetone. In comparison with other metal oxide-based sensors to acetone gas reported in literatures (Table S3 in Supporting information), the mesoporous 2.5%SiO2/WO3 based sensor in this work exhibits much better sensing performance with high response and fast response/recovery rate to acetone gas. The excellent gas sensing performance of the mesoporous 2.5%SiO2/WO3 based sensor toward acetone can be attributed to high specific surface area, unusual implanted ε-WO3 phase and increased adsorbed oxygen species (O−, O2−). The ordered mesoporous SiO2/WO3 composites with interconnected mesopores show extra specific surface area compared with bulk materials, which can provide abundant active sites to facilitates the adsorption and reaction of gas molecules. Besides, the ink bottle-shape mesopores are favorable for Knudsen diffusion due to the nano-confinement effect. This diffusion process promotes the collision frequency between gas molecules and the mesoporous walls, resulting in an improved sensing response. On the other hand, the unusual ε-WO3 phase with a large lattice parameter induced by amorphous SiO2 can significantly increase the polarity of the surface, thus enhancing the adsorption capacity of acetone. This unique structure can facilitate the adsorption of oxygen species to form a thicker electron depletion layer, thus showing more obviously resistance change during sensing process.
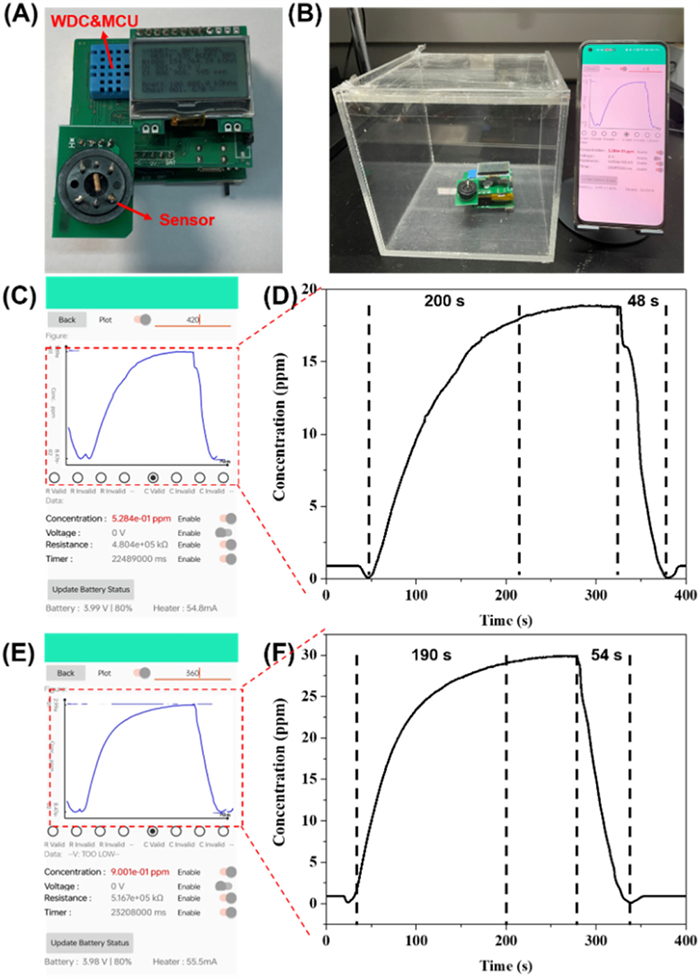
To investigate the feasibility of mesoporous 2.5%SiO2/WO3 based sensor in practical application, a wireless sensing module (WSM) system (Figs. 8A and B) was developed by integrating the sensor with a micro-controller unit (MCU), a Bluetooth communication unit and Li-ion battery. A prerecorded standard regression curve was firstly input into WSM, through which MCU transforms the electrical sensing signal to gas concentration information. Meanwhile, the WSM information can be visualized on a smart phone software, enabling a real-time display of concentration information on the screen. The lab-made WSM was placed in a test-box containing 20 ppm of acetone, the smart phone software displayed a quick sensing response, and the read-out concentration reached a stable value (18.9 ppm) in 200 s (Figs. 8C and D). Even in a higher concentration gas (30 ppm) of acetone, the read-out concentration displayed as 29.9 ppm in 190 s (Figs. 8E and F). The readout concentrations on the smart phone were all close to the real values with relative deviations of 0.5%, implying the reliability and feasibility of our sensors for practical acetone sensing.
Figure 8
Figure 8.
(A, B) Optical photograph of wireless sensing module connected to a smartphone via Bluetooth. (C, D) Dynamic concentration transition curve of acetone displayed on smartphone when the WSM was exposed to 20 ppm of acetone. (E, F) Dynamic concentration transition curve of acetone displayed on smartphone when the WSM was exposed to 30 ppm of acetone. Relative humidity: 60%.
In summary, novel ordered mesoporous silica-implanted crystalline ε-WO3 composites were successfully synthesized via a solvent evaporation induced tricomponent co-assembly strategy. The mesoporous SiO2/WO3 composite materials possess highly crystalline framework with large uniform pore size (12.0–13.3 nm), high surface area (99–113 m2/g) and pore volume (0.17–0.23 cm3/g). The insertion of amorphous silica would expand the lattice space and distort the symmetry of [WO6] octahedrons of crystalline WO3, leading to the increase of the adsorption and interaction with dipole molecules, e.g., acetone. In particular, the gas sensor based on the mesoporous 2.5%SiO2/WO3 shows the highest sensitivity (S = 105 to 50 ppm acetone), fastest response/recovery rate (5/17 s to 50 ppm acetone), low limit of detection (0.25 ppm), and good anti-humidity ability. Moreover, mesoporous 2.5%SiO2/WO3 was applied in a miniaturized WSM system connected to a smart phone, indicating a good reliability in real-time displaying a concentration of acetone, showing great potential in the convenient detection of acetone. This promising sensing performance of the ordered mesoporous silica-implanted crystalline ε-WO3 composites to low-concentration acetone paves a brand avenue for the rational design of novel sensing materials and gas sensors to realize real-time non-invasive diagnosis of diabetes and guide the insulin intake for diabetes as well.
Declaration of competing interest
The authors declare that they have no known competing financial interests or personal relationships that could have appeared to influence the work reported in this paper.
CRediT authorship contribution statement
Jichun Li: Writing – original draft, Investigation, Data curation. Zhengren Wang: Writing – original draft, Investigation, Data curation. Yu Deng: Writing – original draft, Investigation. Hongxiu Yu: Writing – original draft, Investigation. Yonghui Deng: Writing – original draft, Supervision. Xiaowei Cheng: Writing – original draft. Kaiping Yuan: Writing – original draft.
Acknowledgments
This work was financially supported by National Natural Science Foundation of China (Nos. 62104045, 22125501, U22A20152), State Key Laboratory of Transducer Technology of China (No. SKT2207), Medical Engineering Jiont Fund of Fudan University (No. yg2023–10) and Fundamental Research Funds for the Central Universities (No. 20720220010).
Supplementary materials
Supplementary material associated with this article can be found, in the online version, at doi:10.1016/j.cclet.2024.110111.
Y. Zhu, Y. Zhao, J. Ma, et al., J. Am. Chem. Soc. 139 (2017) 10365–10373. doi: 10.1021/jacs.7b04221
[49]
J. Li, X. Yang, J. Ma, et al., ChemCatChem 13 (2021) 2863–2872. doi: 10.1002/cctc.202100385
[50]
R.F. Garcia-Sanchez, T. Ahmido, D. Casimir, S. Baliga, P. Misra, J. Phys. Chem. A 117 (2013) 13825–13831. doi: 10.1021/jp408303p
[51]
M.F. Daniel, B. Desbat, J.C. Lassegues, B. Gerand, M. Figlarz, J. Solid State Chem. 67 (1987) 235–247. doi: 10.1016/0309-1651(87)90049-X
[52]
M. Arai, S. Hayashi, K. Yamamoto, S.S. Kim, Solid State Commun. 75 (1990) 613–616. doi: 10.1016/0038-1098(90)90429-F
[53]
T. Singh, R. Mueller, J. Singh, S. Mathur, Appl. Surf. Sci. 347 (2015) 448–453. doi: 10.1016/j.apsusc.2015.04.126
[54]
N. Zhang, X. Li, H. Ye, et al., J. Am. Chem. Soc. 138 (2016) 8928–8935. doi: 10.1021/jacs.6b04629
[55]
J. Yan, T. Wang, G. Wu, et al., Adv. Mater. 27 (2015) 1580–1586. doi: 10.1002/adma.201404792
[56]
F. Dai, J. Zai, R. Yi, et al., Nat. Commun. 5 (2014) 3605. doi: 10.1038/ncomms4605
[57]
Z. Wu, H. Wang, Q. Ding, et al., Adv. Funct. Mater. 33 (2023) 2300046. doi: 10.1002/adfm.202300046
[58]
Y. Liao, X. Cheng, Y. Zou, L. Wu, Y. Deng, Adv. Sci. 10 (2023) 2204810. doi: 10.1002/advs.202204810
[59]
A. Tricoli, M. Graf, S.E. Pratsinis, Adv. Funct. Mater. 18 (2008) 1969–1976. doi: 10.1002/adfm.200700784
Scheme 1
The co-assembly mechanism and synthesis process of ordered mesoporous SiO2/WO3. Step 1, with continual evaporation of THF, PEO-b-PS copolymers can co-assemble with tungsten and silicon precursors to form spherical micelles with a PS core and a PEO/inorganic species shell. After complete evaporation of solvent and thermosetting for solidification, the spherical micelles further self-aggregate into organic-inorganic composites (A) with fcc mesostructures; Step 2, by high-temperature pyrolysis of PEO-b-PS copolymers under N2 atmosphere, the as-made composites are transformed into carbon-supported mesoporous SiO2/WO3/C materials (B); Step 3, further calcination in air is conducted to remove the supporting carbon, and the crystalline ordered mesoporous SiO2/WO3 composites (C) are obtained.
Figure 2
SEM images of the crystalline ordered mesoporous SiO2/WO3 composites: (a) WO3, (b) 1%SiO2/WO3, (c) 2.5%SiO2/WO3, (d) 5%SiO2/WO3. TEM images of the sample of 2.5%SiO2/WO3 viewed from the directions of (e) [100], (f) [111] and (g) [210]. (h) HRTEM image of 2.5%SiO2/WO3 and (i) its SAED pattern. Representative amorphous SiO2 and crystallized WO3 regions were highlighted by yellow and orange circles, respectively.
Figure 4
(A) XRD patterns of the ordered mesoporous SiO2/WO3 composites: (a) WO3, (b) 1%SiO2/WO3, (c) 2.5%SiO2/WO3 and (d) 5%SiO2/WO3. (B) Enlagerd view in the region of 23°–25°.
Figure 7
(A) Response of mesoporous SiO2/WO3 composites-based sensors to 50 ppm acetone at different operating temperatures: (a) WO3, (b) 1%SiO2/WO3, (c) 2.5%SiO2/WO3, and (d) 5%SiO2/WO3. (B) Response-recovery curve of the mesoporous 2.5%SiO2/WO3-based sensor to acetone gas of different concentrations (0.25–100 ppm) at 290 ℃. (C) Response-recovery time and (D) cycling stability of the mesoporous 2.5%SiO2/WO3-based sensor to acetone gas of 50 ppm at 290 ℃.
Figure 8
(A, B) Optical photograph of wireless sensing module connected to a smartphone via Bluetooth. (C, D) Dynamic concentration transition curve of acetone displayed on smartphone when the WSM was exposed to 20 ppm of acetone. (E, F) Dynamic concentration transition curve of acetone displayed on smartphone when the WSM was exposed to 30 ppm of acetone. Relative humidity: 60%.


 DownLoad:

 下载:
下载:


