Citation:
Xiaoxiao Wang, Bolun Wang, Fenfen Ji, Jie Yan, Jiacheng Fang, Doudou Zhang, Ji Xu, Jing Ji, Xinran Hao, Hemi Luan, Yanjun Hong, Shulan Qiu, Min Li, Zhu Yang, Wenlan Liu, Xiaodong Cai, Zongwei Cai. Discovery of plasma biomarkers for Parkinson’s disease diagnoses based on metabolomics and lipidomics[J]. Chinese Chemical Letters,
2024, 35(11): 109653.
doi:
10.1016/j.cclet.2024.109653
Discovery of plasma biomarkers for Parkinson’s disease diagnoses based on metabolomics and lipidomics
English
Discovery of plasma biomarkers for Parkinson’s disease diagnoses based on metabolomics and lipidomics
State Key Laboratory of Environmental and Biological Analysis, Department of Chemistry, Hong Kong Baptist University, Hong Kong, China
b.
Department of Neurosurgery, Shenzhen Key Laboratory of Neurosurgery, the First Affiliated Hospital of Shenzhen University, Shenzhen Second People’s Hospital, Shenzhen 518035, China
c.
The Central Laboratory, the First Affiliated Hospital of Shenzhen University, Shenzhen Second People’s Hospital, Shenzhen 518035, China
d.
Mr. and Mrs. Ko Chi Ming Centre for Parkinson’s Disease Research, School of Chinese Medicine, Hong Kong Baptist University, Hong Kong, China
zwcai@hkbu.edu.hk (Z. Cai). 1 These authors contributed equally to this work.
Received Date:
16 October 2023 Accepted Date:
14 February 2024 Revised Date:
04 February 2024 Available Online:
15 November 2024
Abstract:
Parkinson’s disease (PD) is an aging-associated neurodegenerative movement disorder with increasing morbidity and mortality rates. The current gold standard for diagnosing PD is clinical evaluation, which is often challenging and inaccurate. Metabolomics and lipidomics approaches have been extensively applied because of their potential in discovering valuable biomarkers for medical diagnostics. Here, we used comprehensive untargeted metabolomics and lipidomics methodologies based on liquid chromatography-mass spectrometry to evaluate metabolic abnormalities linked with PD. Two well-characterized cohorts of 288 plasma samples (143 PD patients and 145 control subjects in total) were used to examine metabolic alterations and identify diagnostic biomarkers. Unbiased multivariate and univariate studies were combined to identify the promising metabolic signatures, based on which the discriminant models for PD were established by integrating multiple machine learning algorithms. A 6-biomarker predictive model was constructed based on the omics profile in the discovery cohort, and the discriminant performance of the biomarker panel was evaluated with an accuracy over 81.6% both in the discovery cohort and validation cohort. The results indicated that PC (40:7), eicosatrienoic acid were negatively correlated with severity of PD, and pentalenic acid, PC (40:6p) and aspartic acid were positively correlated with severity of PD. In summary, we developed a multi-metabolite predictive model which can diagnose PD with over 81.6% accuracy based on this unique metabolic signature. Future clinical diagnosis of PD may benefit from the biomarker panel reported in this study.
Parkinson’s disease (PD) is a chronic, progressive neurodegenerative condition that affects approximately 2% to 3% of people over the age of 65 [1]. Its rising prevalence among the elderly has made it one of the fastest-growing neurodegenerative diseases, exerting a heavy social burden [2]. PD is characterized by a reduction in striatal dopamine, and a selective degeneration of dopaminergic neurons in the substantial nigra pars compacta (SNpc), accompanied by intraneuronal proteinaceous inclusions known as Lewy bodies [3]. Common motor symptoms of PD include postural instability, bradykinesia, muscle rigidity, and resting tremor. Along with that, PD patients exhibit non-motor symptoms like dementia, depression, and anxiety [4]. PD is diagnosed primarily by clinical examinations, medical histories, and responses to dopaminergic treatment, resulting in a high rate of misdiagnosis in clinical practice [5]. Exploring reliable, specific, and highly predictive biomarkers is, therefore, critical for improving PD diagnosis and developing effective PD treatments and prevention strategies [6].
Metabolomics, as a powerful phenotyping technique, can detect thousands of features and determine global changes associated with illness states, as well as identify diagnostic and/or predictive indicators of disease progression [7,8]. Emerging evidence has linked metabolic dysfunctions to the development and progression of PD [9]. Previous studies indicated the involvement of alterations in redox metabolism and central carbon metabolism in PD [10,11]. Additionally, amino acids, bile acids, caffeine metabolites, and fatty acids were assessed and found to be significantly altered in PD patients [12–17]. Lipidomics, as a subfield of metabolomics, has the potential to provide new insights and answers that may enhance our ability to diagnose and track disease progression, predict critical endpoints, and identify people at risk before they show symptoms. Recently, lipid abnormalities have also been implicated in many aspects of PD pathology [18–20]. A combination of metabolomics and lipidomics that can encompass a broad range of compounds will largely facilitate the detection of biomarkers for disease. To date, there are relatively few studies that have combined untargeted and targeted metabolomics and lipidomics with machine learning to discover a unique metabolic pattern to enhance the diagnostic capability of PD.
In the present study, we investigated metabolic changes in the plasma and identified diagnostic biomarkers associated with PD in two well-characterized cohorts composed of 288 subjects using untargeted metabolomics and lipidomics approaches based on liquid chromatography-mass spectrometry (LC-MS). To improve the reliability of the discovered biomarkers, we used an ensemble-based algorithm consisting of random forest (RF), support vector machine (SVM), and least absolute shrinkage and selection operator (LASSO) to develop prediction models based on potential metabolic biomarkers for the discrimination of PD patients from healthy subjects. Multi-algorithm ensemble learning improved feature selection accuracy by combining complementary algorithms. A panel of 6 plasma markers showed a good performance in distinguishing PD patients, which had the potential to enhance PD diagnosis and might further contribute to future investigation of the disease.
A total of 288 participants were enrolled and assigned to a discovery cohort (N = 190, 99 PD subjects and 91 healthy controls) and a validation cohort (N = 98, 44 PD subjects and 54 healthy controls). All participants were recruited by the Second People’s Hospital of Shenzhen, and the study was approved by the hospital’s Ethics Committee. Written information was provided to all participants, and informed consent was obtained from both PD and control participants. Table S2 (Supporting information) details the demographics and clinical characteristics of the recruited participants. The age of PD participants ranged from 50 years to 71 years. Control subjects in both cohorts were between the ages of 47 and 73, with an average age of 57–61. The PD patients of the discovery and validation cohorts had an average disease duration of 9.40 ± 6.36 and 7.60 ± 3.19 years, respectively. The proportion of male participants in both PD cohorts was greater than that of female participants in the control group (M/F > 1.2). There is ample evidence indicating that the male population has a PD prevalence rate 1.4–1.5 times higher than the females although the reasons for this are unknown [21–23]. According to the Hoehn and Yahr (H-Y) scale rating system, the H-Y stages of the patients in both PD groups ranged from 2 to 4 with an average of 3.05 and 2.64, respectively. As demonstrated by a two-tailed Mann-Whitney U test performed on the discovery and validation cohorts, the gender and age distributions of subjects in each group did not differ significantly (P > 0.05) from each other.
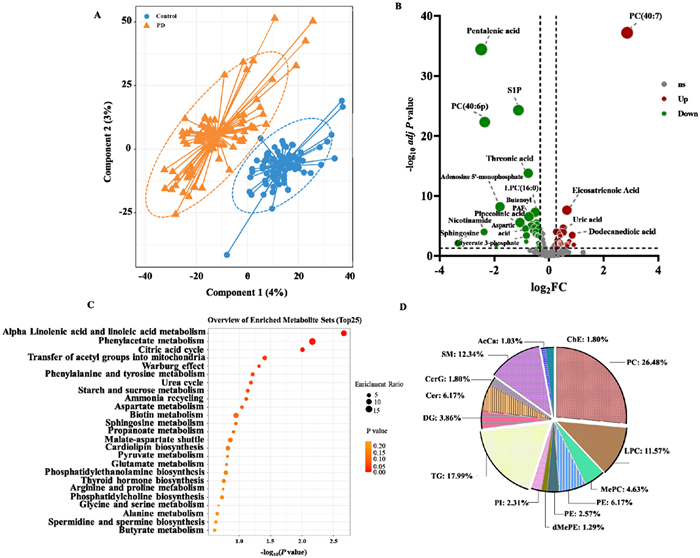
LC-MS-based metabolomic and lipid profiling was performed on 190 plasma samples from PD patients and control subjects in discovery cohort. There were 9129 accurate mass-retention time pairs for metabolites. We repeatedly tested the QC sample throughout the analysis sequence to evaluate the quality of metabolomic data. The data from the QC sample were well clustered in the PCA scores plot (Figs. S1A and B in Supporting information). After instrumental analysis, peak alignment, and metabolite identification, 445 metabolites and lipids were identified. A PLS-DA model was developed to identify distinct metabolites in the plasma of PD patients. The PLS-DA model provided a clear separation between the plasma metabolomes of PD and HC (Fig. 1A). The model was subjected to a permutation test to ensure that it did not overfit (Fig. S2 in Supporting information). In PD patients, 67 metabolites and lipids were found to be significantly altered (Fig. 1B, Table S3 in Supporting information). Specifically, these differential metabolites and lipids comprised 28 glycerophospholipids, 20 organic acids, 6 ceramides, 4 fatty acyls, and 2 sphingolipids. These metabolites represent key metabolic pathways involving alpha linolenic acid and linoleic acid metabolism, phenylacetate metabolism, citric acid cycle, etc. according to the annotations in the KEGG database (Fig. 1C). In total, 1840 species of lipid were detected by LipidSearch, among which 399 individual species covering 15 subclasses of lipids were confidently identified after manually correlating the results with the LipidSearch output results. Over half of the lipids belong to GP category, including 103 phosphatidylcholines (PCs), 45 lysophosphatidylcholines (LPCs), 18 methyl phosphatidylcholines (MePCs), 24 phosphatidylethanolamines (PEs), 10 lysophosphatidylethanolamines (LPEs), 5 dimethylphosphatidylethanolamine (dMePE), 9 phosphatidylinositols (PIs). Approximately one-fifth of the total lipids were GL category, consisting of 70 (TGs) and 15 diglycerides (DGs). Sphingolipids with 24 ceramides (Cers), 7 glucosylceramides (CerGs), 48 sphingomyelins (SMs) compromised nearly 20% of the total 339 lipids. Besides, 4 acyl carnitines (AcCas), 7 cholesterol esters (ChEs) were also identified (Fig. 1D).
Figure 1
Figure 1.
Metabolomic and lipidomic profile abnormalities in PD compared with control subjects. (A) The PLS-DA score plot showing the distinct metabolites and lipids profiles of PD and control subjects in the discovery cohort. (B) Volcano plot illustrating the univariate analysis of differential metabolites and lipids between PD and control subjects in the discovery cohort. FC and t-tests were used to analyze the data S1P: sphingosine-1-phosphate. (C) A metabolic pathways enrichment analysis showing the metabolic pathways disturbed in PD compared with controls for the discovery cohort. (D) Pie chart of lipids distribution in different lipid classes.
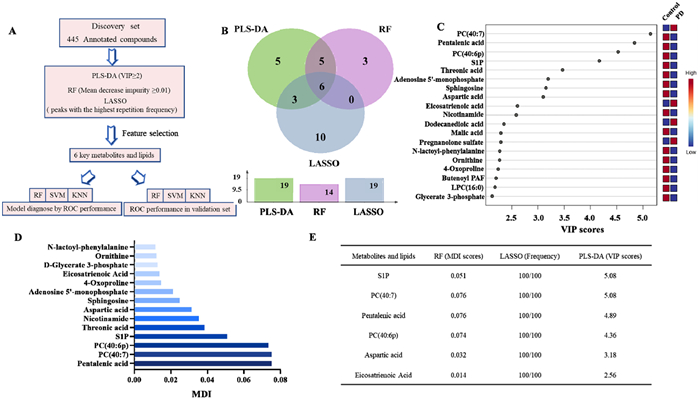
The process depicted in Fig. 2A was used to select features to identify potential biomarkers for PD and further validate the metabolic changes associated with this disease. We employed machine learning approaches to reduce the dimensions of metabolomic and lipidomic data sets, which can also help improve the accuracy of risk prediction [24]. An algorithmic combination of PLS-DA, RF and LASSO was utilized for this purpose (Fig. 2B). These methods are particularly suitable for large amounts of highly complex data from metabolomics and lipidomics studies in which sample numbers are significantly lower than that of variables [25,26]. In addition, ensemble learning provides better predictive performance compared to individual learning algorithms [27].
Figure 2
Figure 2.
Multi-metabolite model development for PD diagnosis combing multiple machine learning methods in the discovery cohort. (A) Statistical workflow for feature selection. (B) Venn diagram of the differential metabolites and lipids filtered by PLS-DA, RF and LASSO analysis. (C) The top 19 important metabolic predictors ranked by VIP scores. The VIP scores ≥ 2 is statistically significant. (D) The contribution of top 14 metabolites and lipids for PD and controls classification ranked by MDI in the discovery cohort. (E) The selected metabolic predictor and their P values for Mann-Whitney U tests, PLS-DA VIP scores, MDI scores, and LASSO frequencies in the discovery cohort.
After intensity normalization and missing value imputing in the discovery cohort, we first used PLS-DA to do feature reduction due to the high number of metabolomic and lipidomics features. Fig. 2C displays the top 19 important metabolic predictors that are related to PD (VIP ≥ 2). After that, we utilized RF, another machine learning method commonly used to discover biomarkers based on omics data, to determine the variables that were more indicative of predictability in the discovery cohort. RF is resistant to overfitting, insensitive to noise, and resilient to high-dimensionality data [28]. In Fig. 2D, the contributions of the metabolites to the classification of PD and control subjects were evaluated based on mean decrease impurity (MDI) values from the RF model (MDI ≥ 0.01). The top 14 metabolites given by the MDI scores were chosen for the following analysis. The LASSO algorithm has also been found to perform well in analyzing multidimensional and multicollinear data [29]. LASSO frequencies (100 random simulations) were used to rank the contribution of different metabolites to the classification of PD patients from normal control subjects in Fig. 2E. Finally, 6 metabolites and lipids met the threshold requirements for all three machine learning approaches (VIP ≥ 2 in PLS-DA, LASSO frequencies of top 19, and MDI ≥ 0.01) in the discovery cohort.
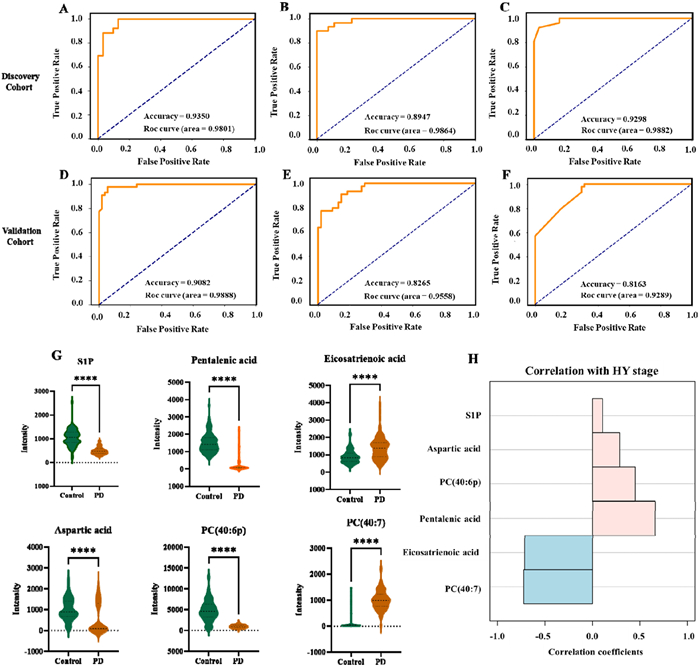
Furthermore, classification models were developed for PD discrimination based on the 6 feature peaks of the discovery cohort. The cross-validation strategy (9:1, 10 times) was applied to 3 machine learning methods, support vector machine (SVM), RF and K-nearest neighbor (KNN). The receiver operating characteristic (ROC) curves depicted in Fig. 3 illustrate the performance of the different machine learning models. To assess the performance of the ensemble-based algorithm, the area under the curve (AUC) was used. The AUCs for SVM, RF and KNN are 0.9801, 0.9864 and 0.9882, respectively. The accuracy for SVM, RF and KNN is > 0.89 (Figs. 3A–C). We then examined 98 samples (44 PD patients and 54 control subjects) to test the diagnostic performance of the biomarker panel in the validation cohort. SVM, RF, and KNN analysis of the validation cohort suggested that the 6-biomarker predictive model exhibited good performance with AUCs of 0.9888, 0.9558, and 0.9289, respectively with an accuracy over 81.6% (Figs. 3D–F). Fig. 3G illustrates the differences in the relative intensity of 6 biomarkers in normal subjects and in PD patients with different disease severity. Among them, PC (40:7) and eicosatrienoic acid exhibited a negative correlation with the severity of PD, showing correlation coefficients of −0.72 and −0.71, respectively. Conversely, pentalenic acid, PC (40:6p), and aspartic acid demonstrated a positive correlation with PD severity with correlation coefficients of 0.66, 0.45, and 0.29, respectively (Fig. 3H). Fig. S3 (Supporting information) illustrates that there is no significant in the distribution of 6 biomarkers in PD patients and normal control subjects in both genders. Similarly, the six biomarkers did not correlate with the age of patients and normal subjects (Fig. S4 in Supporting information).
Figure 3
Figure 3.
Roc curve of different machine learning methods for discovery and validation cohort. (A) Random Forest discovery cohort; (B) KNN discovery cohort; (C) SVM discovery cohort; (D) Random Forest validation cohort; (E) SVM validation cohort; (F) KNN validation cohort. (G) A relative quantitative analysis of six metabolic predictors. Mann-Whitney U test was carried out to examine the differences between PD and controls. (H) A correlation analysis of six metabolic predictors with HY stages. The Pearson correlation was performed on the correlation analysis.
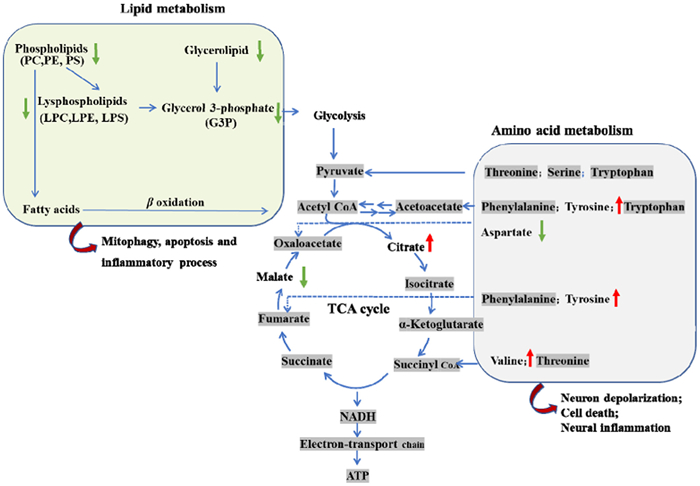
In this study, an LC-MS-based metabolomics evaluation for PD was carried out on a cohort of Plasma samples from 153 PD and 135 control subjects to find potential biomarkers. We investigated the metabolic profiles and related disturbed metabolism pathways of subjects with PD. Based on PLS-DA models, 67 significantly altered metabolites and lipids were identified. The key metabolic pathways involved alpha linolenic acid and linoleic acid metabolism, phenylacetate metabolism, citric acid cycle, etc. Finally, we identified and validated a novel biomarker panel for distinguishing between PD and healthy controls. The lipids abnormalities between PD patients and control subjects were found in the reduced levels of GP (PE, PC, LPC, LPE). PC and LPC play an important role in mitochondrial function [30]. Their changes might be a response to mitochondrial dysfunction. Mitochondria dysfunction, implicated in PD pathology [31], may lead to a reduction in mitochondrial integrity and autophagy, resulting in decreased lipid catabolism [32]. The reduction in GP (PE, PC, LPC, LPE) in PD patients may involve decreased fatty acid oxidation process and glycolysis (Fig. 4). The alterations caused by these modifications result in an increase of lipotoxicity in the cell, a decrease in energy in the tissue, and a disruption of cellular signaling that leads to premature aging and the emergence of age-related illnesses [32]. A multitude of lipid-related pathways or metabolism alterations in PD patients or experimental models are implicated in PD pathology, from specific cytotoxic interactions with PD-causing genes to mutations in lipid-metabolizing enzymes that significantly increase PD risk [33,34]. PC is a class of lipids that serves as an essential mediator in a variety of structural and signaling tasks [35]. LPC, drived from PC, have previously been implicated in a wide range of processes, including neuroinflammatory signaling as well as pro- and anti-apoptotic pathways [36,37]. Previous studies suggested that PC/LPC ratios in plasma might serve as an early signal of lipid reconfiguration in patients with PD [38].
Figure 4
Figure 4.
Metabolic and lipids disturbances in PD.
Biomarker discovery is one of the most essential and challenging aspects of metabolomics research. This study employed machine learning to reduce dimensionality and improve prediction accuracy. In the discovery cohort, feature selection and reduction were performed using an ensemble-based methodology by combining multiple machine learning approaches. A second independent population cohort was then applied to further validated the developed multi-metabolite models. PLS-DA (a multivariate dimensionality-reduction tool) is becoming increasingly useful in metabolomics both for feature selection and classification. Cross-validation is required when utilizing PLS-DA as a feature selector and classifier in discriminant analysis as it is susceptible to overfitting [39]. Another variable selection algorithm used in this study was RF, which has been proven successful as a tool for biomarker selection in metabolomics data. This algorithm is resilient to high-dimensional data, insensitive to noise, and resistant to overfitting [40]. Another variable selection technique used in this study was LASSO which could enable sparse modeling of high-dimensional data. Although LASSO is a useful tool for selecting biomarker candidates, it is not always effective when applied to metabolomic profiling data which is frequently characterized by higher inter-correlation between related metabolites. Therefore, it is necessary to employ an ensemble-based strategy for biomarker selection in metabolomics data analysis, which could leverage individual algorithms’ advantages, overcome their limitations, as well as provide more reliable outcomes. Further studies are needed to develop our discovery of promising plasma biomarkers for PD diagnoses although multiple analysis methods were employed in this study. Firstly, there is a relatively small sample size in the validation cohort. Additional validation with a larger sample size and more patient samples from different regions is necessary to verify our findings. Secondly, quantifying the identified metabolites and lipids and validating their range in both healthy individuals and PD patients is highly meaningful. The concentrations’ distribution of these compounds in PD patients and healthy subjects are suggested to be quantified, which can provide valuable insights for clinical studies.
In summary, we developed a multi-metabolite predictive model which can diagnose PD with over 81.6% accuracy based on this unique metabolic signature. These results may serve as a reference for further clinical examination.
Declaration of competing interest
The authors declare that they have no known competing financial interests or personal relationships that could have appeared to influence the work reported in this paper.
Acknowledgments
We thank the support from the Collaborative Research Fund (No. C2011-21GF) and Guangdong Province Basic and Applied Basic Research Foundation (No. 2021B1515120051). We also thank all patients who participated in this study.
Supplementary materials
Supplementary material associated with this article can be found, in the online version, at doi:10.1016/j.cclet.2024.109653.
[1]
D. Aarsland, L. Batzu, G.M. Halliday, G.J. Geurtsen, et al., Nat. Rev. Dis. Primers 7 (2021) 1–21. doi: 10.1038/s41572-020-00234-1
B. Fuchs, J. Schiller, U. Wagner, H. Häntzschel, K. Arnold, Clin. Biochem. 38 (2005) 925–933. doi: 10.1016/j.clinbiochem.2005.06.006
[37]
A. Goonesinghe, E.S. Mundy, M. Smith, et al., Biochem. J. 387 (2005) 109–118. doi: 10.1042/BJ20041389
[38]
J. Miletic Vukajlović, D. Drakulić, S. Pejić, et al., Rapid Commun. Mass Spectrom. 34 (2020) e8595. doi: 10.1002/rcm.8595
[39]
D. Ruiz-Perez, H. Guan, P. Madhivanan, K. Mathee, G. Narasimhan, BMC Bioinform. 21 (2020) 1–10. doi: 10.1186/s12859-019-3325-0
[40]
D. Grissa, M. Pétéra, M. Brandolini, et al., Front. Mol. Biosci. 3 (2016) 30.
Figure 1
Metabolomic and lipidomic profile abnormalities in PD compared with control subjects. (A) The PLS-DA score plot showing the distinct metabolites and lipids profiles of PD and control subjects in the discovery cohort. (B) Volcano plot illustrating the univariate analysis of differential metabolites and lipids between PD and control subjects in the discovery cohort. FC and t-tests were used to analyze the data S1P: sphingosine-1-phosphate. (C) A metabolic pathways enrichment analysis showing the metabolic pathways disturbed in PD compared with controls for the discovery cohort. (D) Pie chart of lipids distribution in different lipid classes.
Figure 2
Multi-metabolite model development for PD diagnosis combing multiple machine learning methods in the discovery cohort. (A) Statistical workflow for feature selection. (B) Venn diagram of the differential metabolites and lipids filtered by PLS-DA, RF and LASSO analysis. (C) The top 19 important metabolic predictors ranked by VIP scores. The VIP scores ≥ 2 is statistically significant. (D) The contribution of top 14 metabolites and lipids for PD and controls classification ranked by MDI in the discovery cohort. (E) The selected metabolic predictor and their P values for Mann-Whitney U tests, PLS-DA VIP scores, MDI scores, and LASSO frequencies in the discovery cohort.
Figure 3
Roc curve of different machine learning methods for discovery and validation cohort. (A) Random Forest discovery cohort; (B) KNN discovery cohort; (C) SVM discovery cohort; (D) Random Forest validation cohort; (E) SVM validation cohort; (F) KNN validation cohort. (G) A relative quantitative analysis of six metabolic predictors. Mann-Whitney U test was carried out to examine the differences between PD and controls. (H) A correlation analysis of six metabolic predictors with HY stages. The Pearson correlation was performed on the correlation analysis.

 DownLoad:

 下载:
下载:


