
Figure 1.
Acute oral toxicity of carboxylic acids.
Efficient and selective photocatalytic nitrite reduction to N2 through CO2 anion radical by eco-friendly tartaric acid activation
Jingtai Bi , Yupeng Cheng , Mengmeng Sun , Xiaofu Guo , Shizhao Wang , Yingying Zhao

The flue gas emitted by factories generates a large amount of wastewater containing nitrite, after undergoing denitrification process [1,2]. Nitrite poses significant risks to human health, as it can not only induce methemoglobinemia but also form potentially carcinogenic N-nitrosamines in the gastrointestinal tract [3,4]. In response to this situation, the World Health Organization (WHO) has set a limit of 3 mg/L for nitrite concentration in drinking water [5,6]. Therefore, to ensure the safety of drinking water, it is necessary to propose efficient methods to treat wastewater containing nitrite.
Currently, various methods are employed for the treatment of nitrite, including adsorption [7], membrane separation [8], biological approaches [9,10], electrochemical reduction [11,12], and photocatalytic reduction [13,14]. However, adsorption and membrane separation methods only concentrate nitrite without achieving its mineralization, which may result in potential secondary pollution. The biological method requires a relatively long period for cultivating adapted bacteria and mild conditions for microbial communities. The electrochemical method encounters challenges in the preparation of suitable electrocatalysts and the effective modulation of reduction products. In contrast, with the development of advanced reduction processes (ARPs), photocatalytic reduction has gained increasing popularity as an emerging approach for nitrite removal [15].
Photocatalytic reduction is an innovative and sustainable technology specifically developed for the treatment of oxidative pollutants in wastewater [16,17]. It utilizes electrons and highly reactive radicals generated under illumination to eliminate contaminants [18]. Among the various reductive radicals such as sulphur dioxide radical (SO2•−) and bisulphide ion (HS•−) [19], CO2•− is a relatively emerging species [20,21]. It exhibits remarkable reducing capabilities by utilizing its unpaired electrons as electron donors. Hence, it possesses a strong reduction potential (E0(CO2/CO2•−) = −1.81 V vs. SHE) and thus could effectively eliminate nitrite [22,23]. Numerous researchers have demonstrated that the reduction of NO2− by the CO2•− radical results in a high selectivity for N2 in the resulting products [24]. Consequently, the primary products of the NO2− reduction in this process are N2 and CO2, mitigating the risk of secondary pollution compared to sulfur-containing radicals. However, this photocatalytic reduction process is limited by the CO2•− generated from the activation of carboxylic acid precursors [21,22]. Consequently, enhancing the efficiency and sustainability of CO2•− generation from these acids plays a significant role in modulating nitrite reduction [25]. As shown in Fig. 1, the group of common small molecular carboxylic acids comprises formic acid (FA), oxalic acid (OA), and TA. Considering the structural and property aspects of carboxylic acids, TA presents distinct advantages. Primarily, TA demonstrates heightened reducibility and possesses two carboxyl groups, potentially yielding a greater number of CO2•− during activation. Furthermore, with lower toxicity (Fig. 1), TA exhibits an acute oral toxicity LC50 value ranging from 2000 mg/kg to 5000 mg/kg (rat), significantly exceeding the values of formic acid (730 mg/kg) and oxalic acid (375 mg/kg), thereby signifying its reduced potential hazard [26]. Overall, TA serves as an effective and eco-friendly precursor for CO2•−, highlighting its promising potential for application in the treatment of nitrite-containing wastewater.
To confirm the excellent characteristics of TA, a UV/Fe3+/TA system was fabricated to explore the activation of TA in the production of CO2•− and the reduction of nitrite under various factors (Fe3+ dosage, TA dosage and pH). The details are shown in Supporting information.
In the UV/Fe3+/TA system, Fe3+ primarily promotes the CO2•− activation from carboxylic acids through light-induced electron transfer and •OH activation originating from its own photoactivity [25]. To examine the influence of Fe3+, the impact of different Fe3+ dosage on the reduction of nitrite ions was investigated. As the Fe3+ dosage increases, the removal rate of NO2−-N continuously rises, with pseudo-first-order rate constant increasing from 4.48 h–1 to 6.67 h–1, suggesting that elevating the Fe3+ dosage can accelerate the reduction of NO2−-N (Fig. 2a). As shown in Eqs. 1 and 2, upon exposure to ultraviolet light, Fe3+ engages in photoinduced electron transfer, facilitating the activation of TA to generate CO2•− and subsequently reducing the NO2− to form N2 (Fig. 2b and Eq. 3). Consequently, increasing the Fe3+ dosage stimulates the production of CO2•−, thereby boosting the reduction rate of NO2−-N.
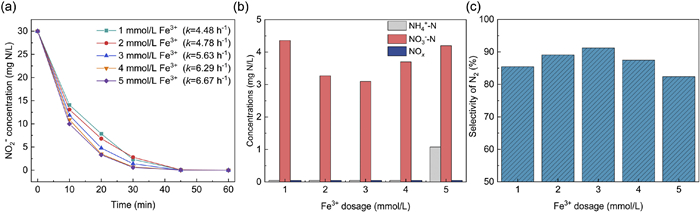
Except for the main product, N2, there are three byproducts, namely NH4+-N, NO3−-N, and NOx, at the reaction endpoint under varying Fe3+ dosages, as shown in Fig. 2b. When the Fe3+ dosage is less than 4 mmol/L, the NH4+-N concentration remains negligible until the dosage reaches 5 mmol/L, producing around 1 mg N/L of NH4+-N. This effect arises due to the substantial generation of CO2•− at the 5 mmol/L dosage, causing an excessive reduction of NO2−-N to NH4+-N. On the other hand, NO3−-N demonstrates an initial decline followed by an increase on the graph. The minimum production of NO3−-N is observed at a Fe3+ dosage of 3 mmol/L. This trend prompts speculation regarding the occurrence of reactions outlined in Eqs. 3 and 4. When subjected to ultraviolet light, Fe3+ undergoes self-photoreduction and generate •OH, which can activate TA to produce CO2•−. Nevertheless, •OH also exhibits potent oxidative characteristics, leading to the oxidation of NO2−-N and the generation of NO3−-N. Therefore, there is a trade-off effect between the accelerating generation of CO2•− and enhanced production of •OH with the elevated Fe3+ undergoes, which induces the trend of NO3−-N concentration exhibits as Fig. 2b. Specifically, with increasing Fe3+ dosage, the concentration of CO2•− rises. Simultaneously, the production of •OH remains relatively low. Consequently, NO2−-N mainly reacts with CO2•− to form N2, and concurrently, oxidatively generated NO3−-N can also undergo a reduction reaction with CO2•−, resulting in a gradual decrease in the accumulation of NO3−-N during the process. However, upon increasing the Fe3+ dosage to 4 mmol/L, the extent of Fe3+ photoreduction significantly increases, leading to a gradual rise in •OH production. This phenomenon, in turn, leads to the accumulation of oxidatively formed NO3−-N [24]. Consequently, NO3−-N exhibits an ascending trend in the system. Finally, concerning NOx, its presence was not detected in the gas phase, indicating the absence of NOx generation within this specific dosage range.
|
|
(1) |
|
|
(2) |
|
|
(3) |
|
|
(4) |
Based on the above data, the variation in N2 selectivity with Fe3+ dosages is depicted in Fig. 2c. With the Fe3+ dosage increasing from 1 mmol/L to 3 mmol/L, the N2 selectivity rises from 85.5% to 91.2%. Conversely, as the Fe3+ dosage further increases from 3 mmol/L to 5 mmol/L, the N2 selectivity decreases from 91.2% to 82.4%. This trend parallels the variation tendencies of the nitrogen byproducts in Fig. 2b. It particularly aligns with the trend of NO3−-N production, influenced by the trade-off effect. Through comprehensive analysis, it is evident that at a Fe3+ dosage of 3 mmol/L, the production of nitrogen byproducts is minimized, and the N2 selectivity reaches its peak. Consequently, the Fe3+ dosage of 3 mmol/L is chosen as the optimal condition.
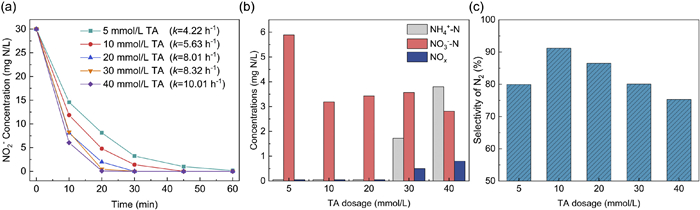
Except for the Fe3+ dosage, TA functions as a precursor for CO2•− generation in UV/Fe3+/TA system and was considered as a key factor. As illustrated in Fig. 3a, an increase in TA dosage results in a significant improvement in the removal rate of NO2−-N. This observation suggests that higher TA dosages can significantly enhance the generation rate of CO2•−, consequently enhancing the reduction of NO2−-N. Fig. 3b illustrates the concentrations of three byproducts with changing TA dosages. As shown in Fig. 3b, NO3−-N exhibits the highest production as a byproduct at a TA dosage of 5 mmol/L. With an increase in TA dosage, the elevated production of CO2•− promotes the reduction of NO3−-N, resulting in a reduction of its concentration. However, the photocatalytic Fe3+-generated •OH also facilitates the transformation of NO2−-N into NO3−-N, thus maintaining NO3−-N at approximately 3–3.5 mg N/L at TA dosage ranging from 10 mmol/L to 40 mmol/L. Additionally, as the TA dosage increases to 30 mmol/L or higher, the system generates additional NH4+-N and NOx, with their concentrations correspondingly increasing as TA dosage rises. This phenomenon could be attributed to the excessive reducing agents TA and CO2•− over-reducing NO2−-N into NH4+-N or NOx. Finally, according to Fig. 3c, at a TA dosage of 5 mmol/L, the N2 selectivity is 79.9%. As the dosage increases to 10 mmol/L, the N2 selectivity significantly rises to 91.2%. However, with continued dosage escalation, the N2 selectivity gradually decreases. Consequently, a TA dosage of 10 mmol/L is selected as the optimal condition to investigate the impact of pH on the performance.
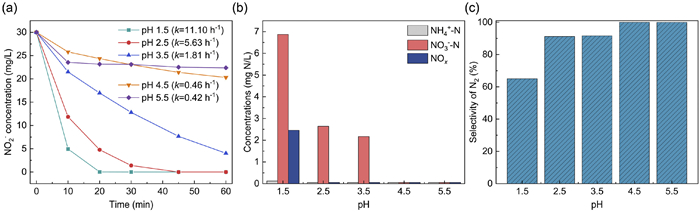
As illustrated in Fig. 4a, the reduction rate of NO2−-N exhibits a decreasing trend as pH increases, especially, this value significantly diminishes when pH ≥ 4.5. This is primarily because (1) the reduction of NO2−-N requires lower pH levels to provide sufficient H+ as proton to participate in the reaction, as shown in Eq. 2; (2) with increasing pH, the increasing OH– precipitates Fe3+ into Fe(OH)3 with lower photocatalytic activity. After the reduction reaction of NO2−-N, the trends of three dominant byproducts are shown in Fig. 4b. It can be observed that when pH > 3.5, the byproduct concentrations are low. However, as the pH gradually decreases to 3.5 and below, the endpoint concentrations of NO3−-N and NOx significantly increase, while NH4+-N, although slightly elevated, remains at a relatively low concentration level. The occurrence of these phenomena may be attributed to the instability of trivalent NO2−-N to the formation of NO3−-N and NO by dimerization reactions under highly acidic conditions. Based on the above data, the N2 selectivity was calculated, as illustrated in Fig. 4c. At a pH of 1.5, the prevalence of dimerization reactions results in the generation of a significant amount of NO3−-N and NOx, leading to lower N2 selectivity. When the pH is increased, the photochemical reduction of NO2−-N gains higher advantage over its inherent dimerization reaction, resulting in the higher N2 selectivity. Considering the goal of efficiently treating harmful NO2−-N, it was determined that under conditions of Fe3+ dosage at 3 mmol/L, TA dosage at 10 mmol/L, and pH at 2.5, it was possible to completely remove 30 mg N/L of NO2−-N, with 91.2% of NO2−-N being converted into N2. However, the UV/TA/Fe3+ system also exhibits the ability to eliminate NO2−-N at higher pH levels with satisfactory nitrogen selectivity. If the elimination rate of NO2−-N is less favorable than the selectivity, a higher pH may also represent an optimal condition.
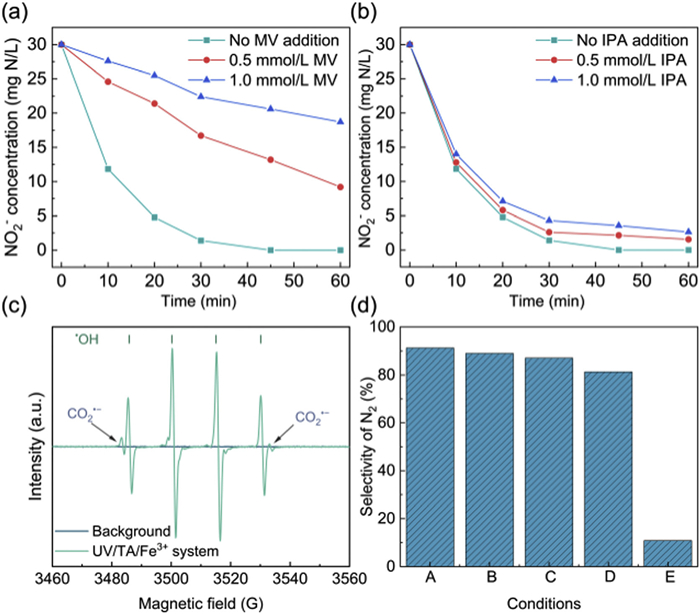
According to Section S3 in Supporting information, it can be concluded that only when UV, TA, and Fe3+ coexist, TA can be promptly activated to form CO2•−, thus facilitating the efficient conversion of NO2−-N to N2. To further investigate the roles of the radicals in the mechanism, quenching experiments were conducted to confirm the presence and contributions of the related radicals. In these experiments, methyl violet (MV) and isopropanol (IPA) were selected as quenchers for CO2•− and •OH, respectively [24]. Fig. 5a reveals a notable reduction in the efficiency of NO2−-N degradation upon the addition of MV, indicating that CO2•− plays a dominant role as the key radical in NO2−-N reduction. In contrast, the impact of IPA addition on NO2−-N removal, as evident in Fig. 5b, appears comparatively limited, signifying that the activation of TA through the •OH pathway is less potent compared to its direct activation by UV and Fe3+. To provide additional clarity on the presence of these radicals, the electron paramagnetic resonance (EPR) technique was employed, utilizing DMPO as the spin-trapping agent. As depicted in Fig. 5c, the quadruplicate signal can be attributed to the DMPO-•OH adducts, and the additional faint signals correspond to the DMPO-CO2•− [27]. Moreover, as illustrated in Fig. 5d, the influence of these two quenchers on N2 selectivity becomes more evident. The addition of IPA results in a reduction of N2 selectivity to approximately 87%, while the introduction of MV sharply decreases N2 selectivity to around 11%. This observation underscores the predominant role of CO2•− in facilitating the successful reduction of NO2−-N to N2. Therefore, CO2•− stands as a critical radical determining whether NO2−-N can be effectively and selectively reduced to N2.
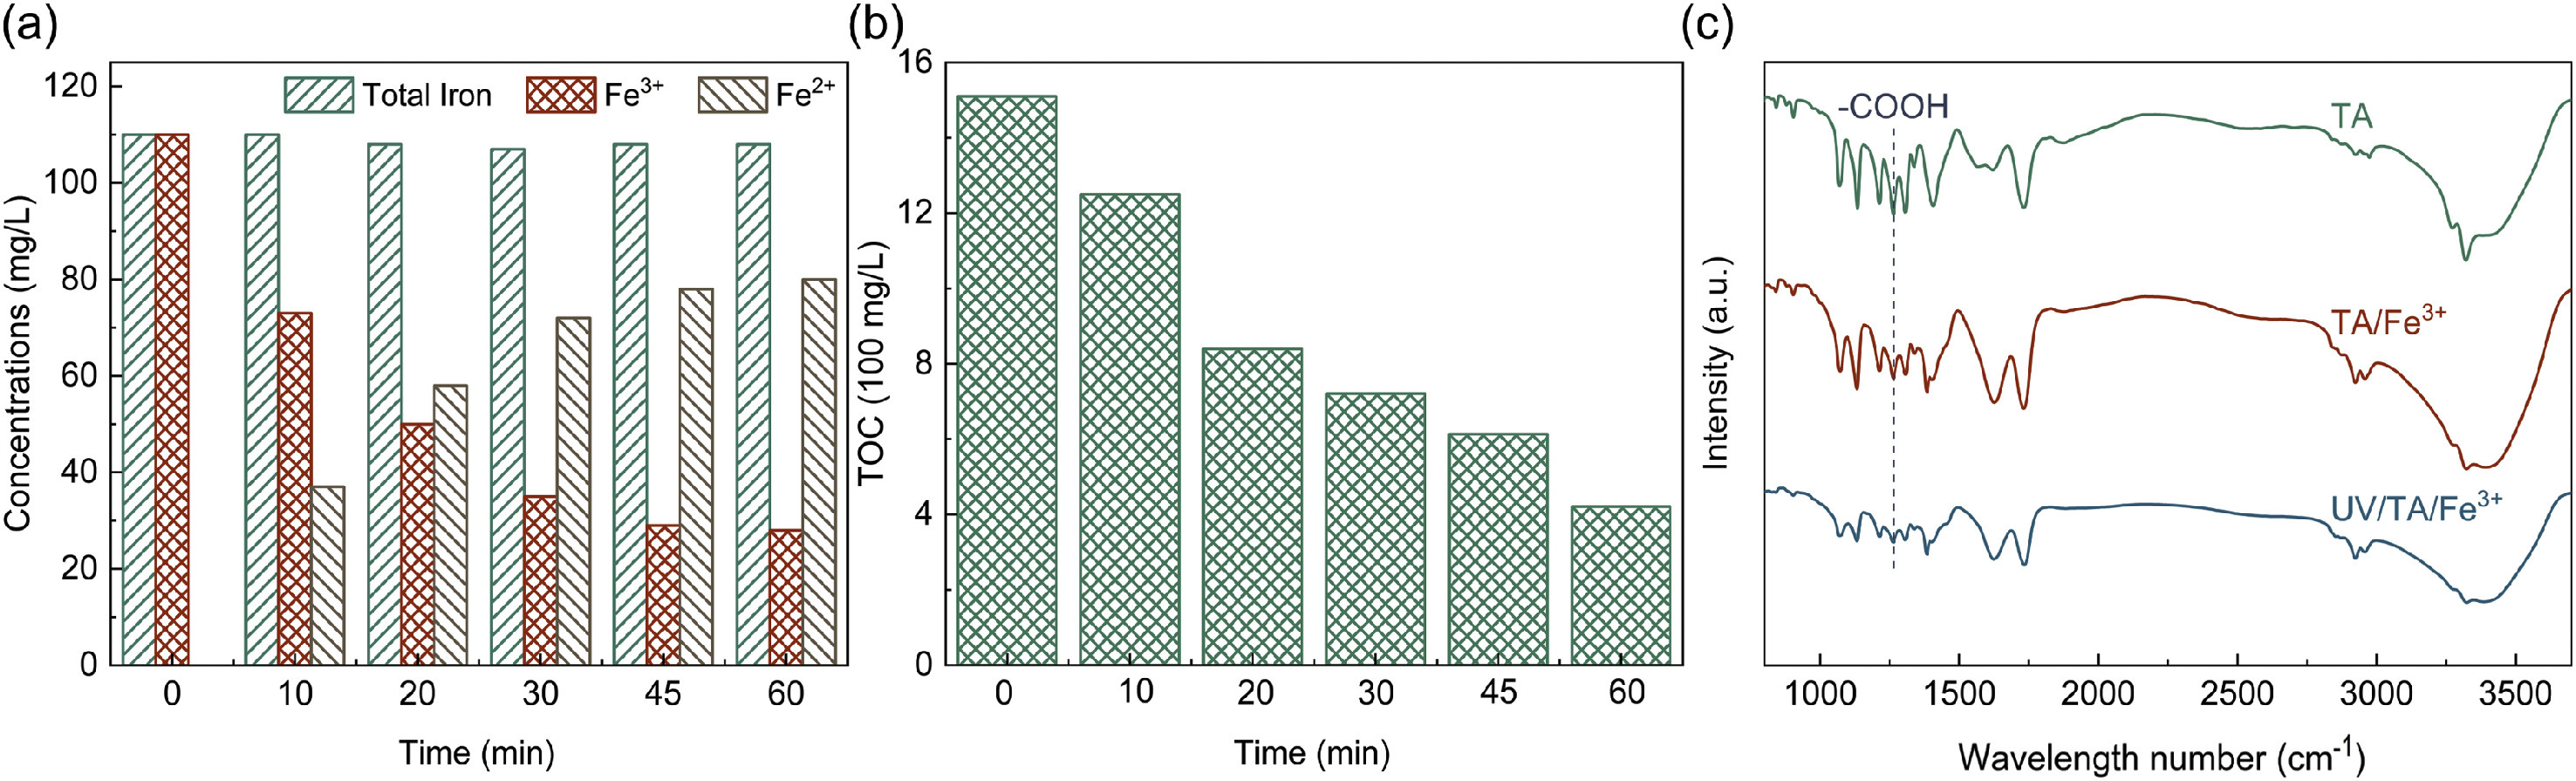
On the other hand, in the reduction mechanism, UV irradiation accompanied with Fe3+ would result in the decarboxylation of TA and the generation of CO2•− (Eq. 1). Accordingly, both Fe3+ and TA undergo transformations with the proceeding of NO2−-N reduction. Fig. 6a illustrates the relationship between Fe3+, Fe2+, and the total iron ion concentration. Before the reduction of NO2−-N, the total iron ion concentration matches that of Fe3+, with no presence of Fe2+ in the solution system. As the reduction reaction progresses, the total iron ion content remains relatively constant, while the Fe3+ content gradually decreases, and the Fe2+ content increases. This indicates the conversion of Fe3+ to Fe2+ in the system, indicating that Fe3+ undergoes photoinduced electron transfer and photoreduction reactions, as described in Eqs. 1 and 3. Fig. 6b displays the variation in TOC concentration over time. As the reaction proceeds, TOC gradually decreases, signifying a reduction in the organic carbon content within TA. In conjunction with Fig. 6c, after UV irradiation, the carboxyl group intensity at 1264 cm−1 in the system is significantly lower compared to the TA and TA/Fe3+ groups, which further demonstrates that TA undergoes continuous decarboxylation and activation catalyzed by Fe3+ and UV [24]. Based on the HR-MS spectrum (Fig. S3 in Supporting information), the decarboxylation of TA may involve carboxylic intermediates such as oxalic acid and 2-oxoacetic acid, ultimately leading to the formation of CO2•−. While HR-MS captured some of these intermediates, it is important to note that their concentrations are relatively low and most of the tartaric acid undergoes conversion to CO2•−. These findings align with those presented in Fig. 6b, showing a decrease in TOC concentration in the UV/TA/Fe3+ system post-activation.
In summary, the reduction mechanism can be deduced as follows: Under UV irradiation, Fe3+ activates the carboxyl groups in TA through photoinduced electron transfer, generating CO2•− [24,28,29]. Additionally, Fe3+ undergoes photodegradation reactions in the presence of UV and produces •OH, which can also activate the carboxyl groups in TA to form CO2•− radicals [25]. However, it may also oxidize NO2−-N into NO3−-N [24]. Furthermore, TA can undergo self-photolysis under UV irradiation, albeit to a lesser extent. Once CO2•− is generated in the solution, it primarily reduces NO2−-N to N2, however, minor byproducts like NH4+-N, NO3−-N, NOx could also be undesirably generated due to excessive NO2−-N reduction, dimerization reactions, and •OH oxidation during the process [24,29].
According to the above discussions, the fabricated UV/TA/Fe3+ system efficiently reduces NO2−-N to N2. However, many real water bodies containing NO2−-N are not simple single systems and their compositions are rather complex. Considering seawater as a potential flue gas absorption medium, it generates nitrified seawater containing NO2−-N [30]. Thus, nitrified seawater serves as a typical real NO2−-N pollution system. Therefore, we employ the UV/TA/Fe3+ system to assess its performance in treating real nitrified seawater. Table S1 (Supporting information) indicates the concentrations of ions other than NO2− in this water body.
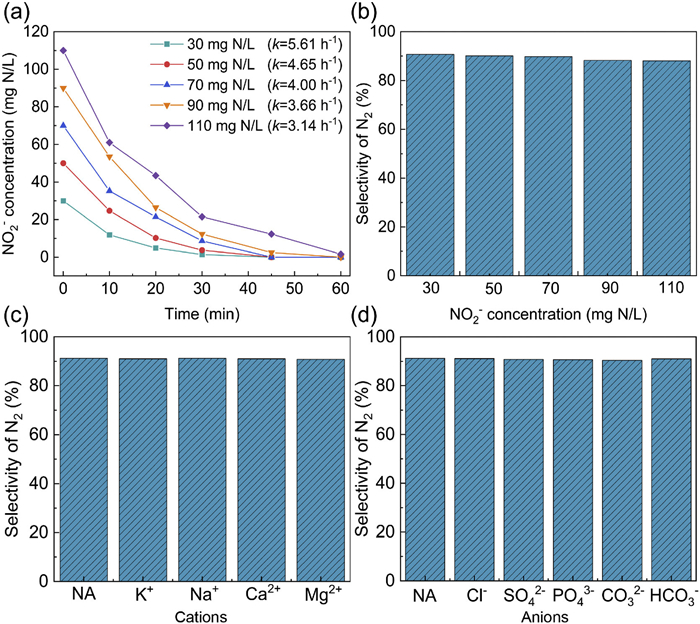
As shown in Figs. 7a and b, at an initial NO2−-N concentration of 30 mg N/L, the UV/TA/Fe3+ system rapidly removed NO2−-N from nitrified seawater, achieving a N2 selectivity of 90.7%, which is nearly identical to the optimal performance in aqueous solutions. To further confirm the efficiency of the UV/TA/Fe3+ system in treating real water samples, the influence of various ions present in seawater on the selectivity of NO2−-N reduction was investigated. By introducing ions at concentrations consistent with those in nitrified seawater (Table S1 in Supporting information) in the aqueous system, as shown in Figs. 7c and d, it was observed that a range of common anionic and cationic species did not inhibit the reduction of NO2−-N. This further substantiates the potential of the UV/TA/Fe3+ system in treating real wastewater. Furthermore, as the initial NO2−-N concentration increased, the rate of NO2−-N reduction in nitrified seawater gradually decreased from 5.61 h–1 at 30 mg N/L NO2−-N to 3.14 h–1 at 110 mg N/L NO2−-N. Nevertheless, as depicted in Fig. 7a, within the concentration range of 30–110 mg N/L NO2−-N, the UV/TA/Fe3+ system effectively achieved complete removal of nitrites. Finally, Fig. 7b illustrates a slight decrease in N2 selectivity with increasing initial NO2−-N concentration. This primarily results from the reduction in CO2•− available per unit concentration of NO2−-N as the NO2−-N concentration rises, leading to reduced reduction efficiency.
In conclusion, this study proposes an eco-friendly approach employing TA as a precursor for nitrite reduction. Under the activation of Fe3+ and ultraviolet light, this system generates highly reducing CO2•− for selective reduction of nitrites to N2. The impact of TA dosage, Fe3+ dosage and pH on the reduction process is systematically examined. The findings reveal that the UV/TA/Fe3+ system can completely eliminate nitrites from the wastewater within 1 h, achieving an impressive N2 selectivity of 91.2%. Finally, this system is applied to the reduction of nitrites in nitrified seawater, demonstrating that even in complex seawater systems, nitrite removal is feasible, with N2 selectivity consistently exceeding 90%.
The authors declare that they have no known competing financial interests or personal relationships that could have appeared to influence the work reported in this paper.
This research was financially supported by National Natural Science Foundation of China (No. 22208081), Central Guidance on Local Science and Technology Development Fund of Hebei Province (No. 226Z3102G) and Fundamental Research Funds of Hebei University of Technology (No. JBKYTD2001).
Supplementary material associated with this article can be found, in the online version, at doi:
X. Chen, X. Tong, J. Gao, et al., Environ. Sci. Technol. 56 (2022) 4542–4552. doi: 10.1021/acs.est.2c00786
D.B. Gingerich, M.S. Mauter, Environ. Sci. Technol. 54 (2020) 3783–3792. doi: 10.1021/acs.est.9b07433
C.P. Bondonno, L. Zhong, N.P. Bondonno, et al., Trends Food Sci. Technol. 135 (2023) 57–73. doi: 10.1016/j.tifs.2023.03.014
M. Carlström, C.H. Moretti, E. Weitzberg, J.O. Lundberg, Free Radic, Bio. Med. 161 (2020) 321–325.
O. El hani, A. Karrat, K. Digua, A. Amine, Spectrochim. Acta A 267 (2022) 120574. doi: 10.1016/j.saa.2021.120574
H. Min, Z. Han, M. Wang, et al., Inorg. Chem. Front. 7 (2020) 3379–3385. doi: 10.1039/D0QI00780C
M.R. Awual, M.M. Hasan, A. Islam, et al., J. Clean. Prod. 228 (2019) 778–785. doi: 10.1016/j.jclepro.2019.04.280
X. Xiang, J. Wang, Q. Liu, et al., Sep. Purif. Technol. 275 (2021) 119195. doi: 10.1016/j.seppur.2021.119195
M. Jiang, X. Zheng, Y. Chen, Water. Res. 169 (2020) 115242. doi: 10.1016/j.watres.2019.115242
B. Zhang, Y. Jiang, K. Zuo, et al., J. Hazard. Mater. 382 (2020) 121228. doi: 10.1016/j.jhazmat.2019.121228
X. Zhang, Y. Wang, Y. Wang, et al., Chem. Commun. 58 (2022) 2777–2787. doi: 10.1039/D1CC06690K
Y. Zhang, Y. Wang, L. Han, et al., Angew. Chem. Int. Ed. 62 (2023) e202213711. doi: 10.1002/anie.202213711
S.R. Huang, P.J. Huang, J. Environ. Chem. Eng. 10 (2022) 106902. doi: 10.1016/j.jece.2021.106902
S. Lee, Y. Lee, W. Choi, Appl. Catal. B 327 (2023) 122432. doi: 10.1016/j.apcatb.2023.122432
N. Hoinkis, M.I. Litter, Ind. Eng. Chem. Res. 61 (2022) 16408–16417. doi: 10.1021/acs.iecr.2c02296
Q. Wang, L. Wang, S. Zheng, et al., J. Hazard. Mater. 451 (2023) 131149. doi: 10.1016/j.jhazmat.2023.131149
J. Bi, X. Huang, J. Wang, et al., Chem. Eng. J. 366 (2019) 50–61. doi: 10.1016/j.cej.2019.02.017
S. Lu, L. Shen, X. Li, et al., J. Clean. Prod. 378 (2022) 134589. doi: 10.1016/j.jclepro.2022.134589
X. Yu, D. Cabooter, R. Dewil, J. Hazard. Mater. 357 (2018) 81–88. doi: 10.1016/j.jhazmat.2018.05.049
C.M. Hendy, G.C. Smith, Z. Xu, T. Lian, N.T. Jui, J. Am. Chem. Soc. 143 (2021) 8987–8992. doi: 10.1021/jacs.1c04427
J. Guo, J. Deng, B. An, et al., Chemosphere 295 (2022) 133785. doi: 10.1016/j.chemosphere.2022.133785
H. Shi, C. Li, L. Wang, et al., Sep. Purif. Technol. 300 (2022) 121854. doi: 10.1016/j.seppur.2022.121854
S. Wang, Y. Zhao, J. Feng, et al., Chem. Eng. J. 455 (2023) 140787. doi: 10.1016/j.cej.2022.140787
B. An, H. He, B. Duan, J. Deng, Y. Liu, Chemosphere 278 (2021) 130388. doi: 10.1016/j.chemosphere.2021.130388
B. Wang, B. An, Y. Liu, J. Chen, J. Zhou, Sep. Purif. Technol. 248 (2020) 117061. doi: 10.1016/j.seppur.2020.117061
Merck Millipore, Safety data sheet.
Q. Zhou, W. Niu, Y. Li, X. Li, J. Clean. Prod. 258 (2020) 120790. doi: 10.1016/j.jclepro.2020.120790
J. Chen, R. Zhang, D. Chen, J. Liu, S. Chen, J. Water Process Eng. 40 (2021) 101934. doi: 10.1016/j.jwpe.2021.101934
Z. Shi, F. Wang, Q. Xiao, S. Yu, X. Ji, Catalysts 12 (2022) 348. doi: 10.3390/catal12030348
Y. Zhao, Y. Cheng, T. Zhang, et al., Fuel 340 (2023) 127436. doi: 10.1016/j.fuel.2023.127436

Figure 2 Effect of Fe3+ dosage on (a) NO2−-N degradation; (b) Concentrations of NH4+-N, NO3−-N and NOx at the reaction endpoint; (c) Selectivity of N2. TA dosage: 10 mmol/L, pH 2.5.

Figure 3 Effect of TA dosage on (a) NO2−-N degradation; (b) Concentrations of NH4+-N, NO3−-N and NOx at the reaction endpoint; (c) Selectivity of N2. Fe3+ dosage: 3 mmol/L, pH 2.5.

Figure 4 Effect of pH on (a) NO2−-N degradation; (b) Concentrations of NH4+-N, NO3−-N and NOx at the reaction endpoint; (c) Selectivity of N2. Fe3+ dosage: 3 mmol/L, TA dosage: 10 mmol/L.

Figure 5 Free radical quenching experiments: (a) NO2−-N concentration in CO2•− quenching experiment; (b) NO2−-N concentration in •OH quenching experiment; (c) EPR free radical detection; (d) selectivity of N2 in the presence of quenching agent (A: No quencher, B: 0.5 mmol/L IPA, C: 1.0 mmol/L IPA, D: 0.5 mmol/L MV, E: 1.0 mmol/L MV).

Figure 6 (a) Concentration of iron species during reduction. (b) TOC concentration during reduction. (c) FTIR spectra of different systems.

 扫一扫看文章

扫一扫关注我们
 DownLoad:

 下载:
下载:
