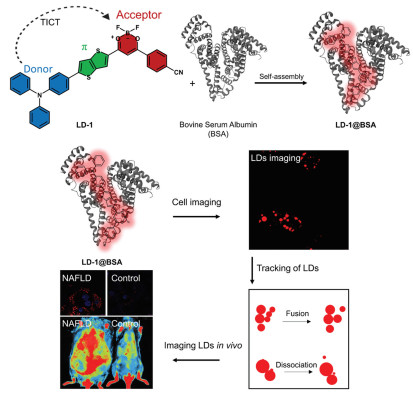
Scheme 1.
Chemical structure of LD-1 and its self-assembly with BSA to form the LD-1@BSA hybrid for the long-wavelength fluorescence imaging of LDs in cells and in vivo.
Protein-encapsulated long-wavelength fluorescent probe hybrid for imaging lipid droplets in living cells and mice with non-alcoholic fatty liver
Han-Min Wang , Yan-Chen Li , Lu-Lu Sun , Ming-Ye Tang , Jia Liu , Jiahao Cai , Lei Dong , Jia Li , Yi Zang , Hai-Hao Han , Xiao-Peng He

Non-alcoholic fatty liver disease (NAFLD) is the leading cause of chronic liver disease globally and its prevalence is ever-rising. Approximately 25%–30% of adults worldwide are diagnosed with NAFLD, with 3%–6% potentially progressing into non-alcoholic steatohepatitis (NASH) [1,2]. NAFLD not only directly contributes to the development of cirrhosis and hepatocellular carcinoma (HCC), but it can also lead to other chronic diseases such as type 2 diabetes (T2D) and atherosclerosis. More than 55% of T2D patients have NAFLD, with an estimated 37.3% of which having NASH and advanced fibrosis [3]. The connection between NAFLD and other systemic diseases increases the overall mortality rate, particularly for individuals with NASH and advanced fibrosis [4]. However, the exact mechanism underlying NAFLD remains poorly understood. This is in part due to a lack of effective and non-invasive methods for the dynamic monitoring of NAFLD at different pathological stages.
Currently, there are three main methods for NAFLD diagnosis, i.e., liver biopsy, imaging, and serological detection [5]. Liver biopsy is viewed as the gold standard for NAFLD detection; however, it is invasive, error-prone, and highly dependent on the physicians' experience [6]. Imaging techniques such as ultrasound, computed tomography (CT), and magnetic resonance imaging (MRI) are also used clinically. Ultrasound is generally of low sensitivity and can be compromised by subcutaneous fat [7]. CT is more sensitive than ultrasound, but its radioactivity rises toxicity issues. MRI is expensive and barely applicable in developing areas [5]. The detection of serological biomarkers shows promise for NAFLD diagnosis. However, the currently identified NAFLD biomarkers cannot indicate the level to which hepatic steatosis is occurred [8,9]. The unmet needs associated with conventional analytical methods highlight the importance of developing new powerful tools for NAFLD study and diagnosis [10].
A primary characteristic of NAFLD is the accumulation of excessive lipids in liver cells, leading to the accentuation of lipid droplets (LDs) intracellularly. LDs consist of a hydrophobic core of triacylglycerols (TG) and/or sterol esters, which are encapsulated by protein-embedded phospholipids [11]. Thus, in-situ measuring the level of LDs in the liver more directly indicates fat accumulation, and thus, aids in the diagnosis of NAFLD. Currently, Oil red O is the most widely used reagent for the histological staining of LDs. Nevertheless, the chemical structure of Oil red O is relatively unstable, and the selectivity and sensitivity of the staining agent for LDs remains to be improved [12]. Additionally, this method is not amenable to real-time imaging of LDs in vivo [13].
Fluorescence imaging has proven to be an effective and non-invasive approach for monitoring LDs in cells and in vivo with satisfactory spatiotemporal resolution and signal-to-noise ratio being achieved [14-27]. The currently developed fluorescent probes for LD imaging are mainly based on the following two strategies [28-30]. (1) The fluorescence of probes is tuned by solvatochromism, i.e., a bright fluorescence is observed in lipophilic solutions, and a red-shifted, much weaker fluorescence seen under polar conditions. (2) Restriction of the intramolecular rotation of aryl groups installed onto probes under high-viscous conditions enhances fluorescence. At present, a number of fluorescent probes have been developed for LDs with Nile red and BODIPY™ 493/503 having been commercialized [31,32]. However, the previously developed probes generally emit fluorescence in a visible region of 400–650 nm, which may suffer from biological autofluorescence in vivo. Long-wavelength fluorescent probes with large Stokes shift, high polarity sensitivity and the ability to track LD dynamics remain elusive [33-35].
Herein, we developed a long-wavelength fluorescent probe (LD-1) based on difluoroboron diketonates (BF2bdks) for LD imaging in cells and in vivo (Scheme 1). Triphenylamine (TPA) and cyanobenzene are coupled to the different ends of the BF2bdks scaffold, producing LD-1 with a typical electronic donor-acceptor structure and twisted intramolecular charge transfer (TICT) characteristics. LD-1 exhibits intensive long-wavelength fluorescence and a large Stokes shift (> 100 nm) in nonpolar and viscous solutions but minimal fluorescence in highly polar solvent. To further enhance its biocompatibility [36-39], LD-1 was associated with bovine serum albumin (BSA) by self-assembly to form a probe hybrid, LD-1@BSA. Importantly, this hybrid achieved the noninvasive and real-time monitoring of LD accumulation in a NAFLD mouse model.
To achieve sensitive and selective LD imaging, probe LD-1 characteristic of TICT was designed and synthesized (Scheme 1). Polarity-sensitive difluoroboron diketonates (BF2bdks) derivatives exhibiting a red-shifted and weak fluorescence in low-polar solvents such as CH2Cl2 or tetrahydrofuran (THF) was selected as the main skeleton to construct LD-1 [40]. TPA was used as the electron donor whilst endowing the probe with TICT properties. TPA also serves to target the hydrophobic LDs. Cyanobenzene was introduced to the BF2bdks scaffold, and the resulting conjugate serves as the electron acceptor. Bithiophene was used as the linker to connect between the electron donor and acceptor, and this π-conjugated system also red-shifts the fluorescence wavelength. To synthesize the probe, first, bithiophene was acetylated by Friedel-Crafts reaction to obtain 1-S1, to which bromine was introduced on the opposite site affording 1-S2. Subsequently, diphenylaminophenylboric acid was introduced to 1-S2 by Suzuki coupling, and the resulting intermediate 1-S3 was reacted with methyl-4-cyannobenzoate to produce 1-S4. After coordinating with boron trifluoride, the designed probe LD-1 was obtained in an overall yield of 13% (Scheme S1 in Supporting information).
With LD-1 in hand, we first tested its photophysical properties in different solvents. LD-1 was dissolved in different organic solvents including cyclohexane (Cyc), 1,4-dioxane (Oxa), THF, dichloromethane, ethyl acetate (EtOAc), acetonitrile, methanol and dimethyl sulfoxide (DMSO), and then the ultraviolet–visible (UV–vis) absorption and fluorescence spectra of the probe solutions were measured. A broad absorbance band (~450–650 nm) was seen for LD-1 in all tested organic solvents with an absorption maximum at ~555 nm (ε = ca. 65,000–74,000 L mol−1 cm−1) (Fig. S1 in Supporting information). Then, the fluorescence spectra of LD-1 in the different organic solvents were obtained by excitation at 500 nm. A high quantum yield of ΦCyc = 75.4% was obtained for LD-1 in cyclohexane with a Stokes shift of 58 nm. The fluorescence maxima of LD-1 in 1,4-dixoane red-shifted to 661 nm with an increased Stokes shift (118 nm); however, the quantum yield dropped largely (ΦOxa = 8.4%). The fluorescence intensity of LD-1 was almost negligible in other solvents tested, irrespective of their polarity (Figs. 1a, b, h and Table S1 in Supporting information). This suggests that the excellent polarity sensitivity of LD-1 can efficiently avoid providing the false fluorescence signal in higher polar environments rather than that in cyclohexane or hydrophobic LDs. To better corroborate this point, we measured the fluorescence variation of LD-1 in a mixture of dioxane and DMSO. Minimal fluorescence was observed for LD-1 when the proportion of dioxane in the solvent mixture is below 80%. Upon the gradual increase of dioxane from 80% to 100%, the fluorescence intensity of the probe sharply enhanced (Figs. 1c and d). These results demonstrate that the fluorescence of LD-1 is dependent on environmental polarity.
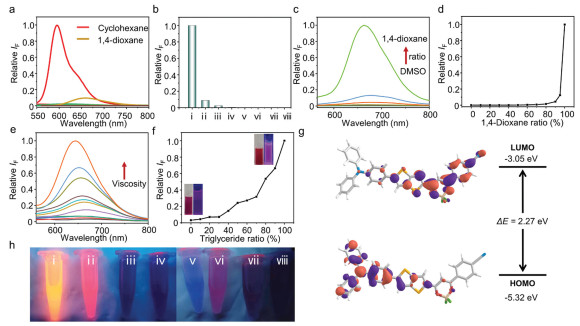
Next, the fluorescence of LD-1 was measured in triglyceride, which is the main component of LDs (Fig. S2 in Supporting information). We observed that the probe emitted a bright fluorescence with an emission maximum at 644 nm (Φ = 21.2%) and a large Stokes shift of 104 nm. The absorption and fluorescence properties of LD-1 in triglyceride are similar to that in 1,4-dioxane. However, its fluorescence quantum yield in triglyceride is ~3-fold higher than in 1,4-dioxane, suggesting that the fluorescence of LD-1 is also determined by the viscosity of microenvironment. To testify our hypothesis, LD-1 was added to a mixed solvent of EtOAc and triglyceride. Upon increasing the triglyceride ratio, the fluorescence band of LD-1 slightly blue-shifted with a gradually enhanced emission intensity (Figs. 1e and f). These results demonstrated the sensitivity of the probe to environmental viscosity.
To better understand the mechanism underlying the photophysical properties of LD-1, the frontier molecular orbital energies were calculated through the density functional theory. The spatial distribution of the highest occupied molecular orbitals (HOMO), that of the lowest unoccupied molecular orbitals (LUMO) and the optimal conformation of LD-1 were simulated (Fig. 1g and Fig. S3 in Supporting information). The simulation results suggest that at the HOMO level (−5.32 eV), the electron density is uniformly distributed over the electron donors, i.e., the TPA and bithiophene groups. While, at LUMO (−3.05 eV), LD-1 exhibits an electronic delocalization on the BF2bdks and cyanobenzene scaffolds. The calculated preferential conformation of the probe illustrates a dihedral angle of 2° for both the bithiophene-BF2bdks and BF2bdks-cyanobenzene conjugation, suggesting a good coplanarity of the three moieties. However, the dihedral angles of the phenyl groups in TPA were determined to be 45° and 42°, and that between TPA and bithiophene 40° (Fig. S3). The twisted TPA conformation determines the TICT property of LD-1 [41], thus making the probe sensitive to subtle microenvironmental changes.
With its promising photophysical properties determined, we sought to use LD-1 for in-situ imaging of LDs in live cells. Before cellular experiments being conducted, we first tested whether the presence of a range of naturally existing biospecies including DNA, RNA, glutathione, cysteine, tyrosinase, BSA and metal ions (K+, Na+, Ca2+ and Mg2+) would cause the fluorescence of the probe to non-specifically enhance. When measured in a phosphate buffer saline (PBS) solution, we found that LD-1 exhibited minimal fluorescence when the competing biospecies were added (Fig. S4 in Supporting information). To further improve the biocompatibility and stability of the small-molecule probe, LD-1 was associated with BSA to form a probe hybrid through simply mixing the probe with the albumin in PBS for 5 min [42]. Dynamic laser scanning used indicated a larger hydrodynamic diameter of the ensemble (~135 nm) than those of BSA (102 nm) and LD-1 (4 nm) in H2O, suggesting the self-assembly being successful (Fig. S5 in Supporting information). We also studied the morphology of LD-1 and LD-1@BSA by transmission electron microscopy (TEM) (Fig. S6 in Supporting information). LD-1 was determined to self-assemble into nanoparticles. In a representative TEM image of LD-1@BSA, it was found that core-shell architectures were formed, corroborating the hybridization between the probe and the protein.
Molecular docking was carried out to better elucidate the binding manner between LD-1 and BSA [43]. BSA has two major binding domains for hydrophobic small molecules, namely the subdomain IIA (site Ⅰ) and IIIA (site Ⅱ). Our molecular docking experiments revealed that the binding energy of LD-1 to subdomain IIA (−8.30 kcal/mol) was significantly lower than that to subdomain IIIA (887.08 kcal/mol), suggesting that LD-1 exhibits a stronger binding affinity towards the IIA domain. Subsequently, we proceeded to simulate how LD-1 interacts with the amino acid residues in the IIA region of BSA through protein-ligand interaction profiler (PLIP) analysis [44]. Fig. S7 (Supporting information) illustrates the plausible interactive mode of LD-1 within the IIA region of BSA. The binding motif suggests that LD-1 was immobilized by the amino acid residues of Glu186, Thr190, Trp213, Arg217, Leu218, Lys221, Leu237, and Ala290 mainly through hydrophobic interactions. In addition, LD-1 formed hydrogen bonds with Arg198 and His241, a π-cation interaction existed between the probe molecule and Arg194.
A human hepatoma cell line (HepG2) was used as the cellular model for fluorescence imaging. After treatment with oleic acid (OA), LDs form intracellularly [45]. A preliminary cell counting kit-8 (CCK-8) assay showed that the probe did no cause cell death after incubation with LD-1@BSA at different concentrations for 24 h (Fig. S8 in Supporting information). First, the intracellular LDs formed in HepG2 cells were imaged using LD-1 alone with a fluorescence microscope. The result showed that the probe did not enter the cells effectively probably due to its insufficient solubility in full-aqueous solution (Fig. S9 in Supporting information). This prompts us to use the probe hybrid LD-1@BSA for LD imaging. A commercial LD tracker, Nile Red [46], was used for colocalization. Granular dots characteristic of LDs, were visualized in both the red (LD-1@BSA) and green channel (Nile Red) of the fluorescence imaging (Fig. S10a in Supporting information). The Pearson's colocalization coefficients of the two fluorescence channels reached 0.96, validating the effectiveness of LD-1 for LD imaging. Furthermore, a random plotting of the merged channels also indicates an excellent spatial overlap of the two fluorescent staining agents (Fig. S10b in Supporting information).
We also tested the photostability of LD-1@BSA, and Nile Red. HepG2 cells stained with the probes were subject to laser irradiation every 30 s, and the resulting fluorescence intensities were quantified after each scan. We determined that LD-1@BSA was less photobleached than that of Nile Red over the whole period of laser scanning (Fig. S11 in Supporting information).
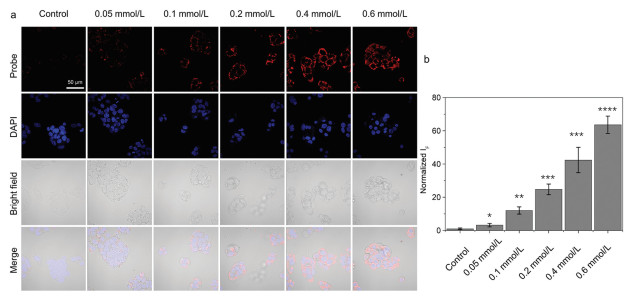
OA was reported to modulate both the quantity and morphology of LDs in living cells [47]. LD-1@BSA was therefore used to monitor LD dynamics in cells. Initially, HepG2 cells were treated with varying concentrations of OA (0, 0.05, 0.1, 0.2, 0.4, 0.6 mmol/L) for 24 h, followed by a 2 h incubation with LD-1@BSA. While minimal fluorescence was observed in HepG2 cells without OA treatment, the fluorescence gradually enhanced with OA concentration (Fig. 2). In addition, we studied time-dependent LD production with a fixed OA concentration of 0.4 mmol/L. The results similarly demonstrated a fluorescence enhancement with incubation time (Fig. S12 in Supporting information). These results suggest the reliability of our probe hybrid for LD imaging in cells.
Previous research has established that LDs are involved in a variety of dynamic processes including fusion, dissociation, and interactions with other cellular organelles [48]. We thus evaluated the capacity of LD-1@BSA for the in-situ monitoring of LD motion with live cells. To image LD fusion, HepG2 cells were treated with OA and then stained with LD-1@BSA. Cells were then washed to remove free dyes, and cell images were recorded every 10 s for continuously 30 s. In a representative fluorescence field of the cell imaging shown in Fig. S13a (Supporting information), relatively smaller LDs were observed to fuse into a larger droplet at 30 s. We then turned to investigate whether the probe hybrid could monitor LD degradation. HepG2 cells were treated with forskolin, an activator of adenylate cyclase that increases the intracellular cyclic AMP concentration and thus accelerates the degradation of TG in LDs. Cells with preformed LDs were first stained with LD-1@BSA, and then treated with forskolin (10 µmol/L). The fluorescence images were recorded at 0, 10 and 20 min. Protruded droplets with a diameter of ~980 nm were observed in a representative fluorescence field of two adjacent LDs at 0 and 10 min (Fig. S13b in Supporting information). Interestingly, an excreted small droplet was finally detected at 20 min. This suggests the potency of LD-1@BSA to effectively discern the subtle movement trajectories of nanometer LDs.
Liver is the main organ in the human body that modulates lipid metabolism. During NAFLD, an extensive amount of LDs are observed in the liver as a result of abnormal lipid accumulation [49]. Before in vivo imaging, mouse primary hepatocytes were used to corroborate the LD imaging capacity of LD-1@BSA. The cells were treated with an excess of OA to mimic the lipid accumulation process of NAFLD. Obeticholic acid (OCA), an inhibitor of lipid accumulation by activating the farnesoid X receptor, was also employed [50]. In the cells without OCA treatment, an intensive probe fluorescence was observed. However, with OCA, the fluorescence was largely supressed, suggesting that the fluorescence imaging is dependent on LD production (Figs. S14a and b in Supporting information). A subsequent TG quantification assay indicated that the TG content in the primary hepatocytes increased from 0.09 mmol/g to 0.33 mmol/g after treating with OA, and the value decreased to 0.24 mmol/g when OCA was added (Fig. S14c in Supporting information). The same trend was observed in HepG2 cells (Fig. S15 in Supporting information).
Finally, a mouse model of NAFLD was established by subjecting the leptin-deficient (ob/ob) mice to a high-fat diet (HFD) for a duration of four weeks. All animal experiments were carried out under the Guidelines for Care and Use of Laboratory Animals of Shanghai Institute of Materia Medica (SIMM), Chinese Academy of Sciences and approved by the Institutional Animal Care and Use Committee (IACUC) of SIMM (Shanghai, China). Subsequently, LD-1@BSA was injected intravenously, and mice were imaged with a Newton 7.0 in vivo imaging system. In the group of wild type (WT) mice, minimal fluorescence was shown in the hepatic region over 8 h of fluroescence imaging (Figs. 3a and b). In contrast, in the NAFLD mice group, a strong fluorescence was detected to concentrate on the liver at 4 h of imaging; the fluorescence remained almost unchanged at 6 h, and slightly decreased at 8 h (Figs. 3a and b).
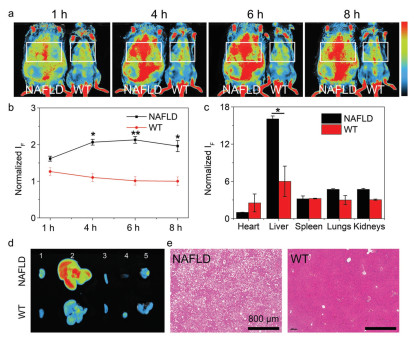
To better localize the fluorescence signal, mice in both groups were sacrificed 8 h after the administration of LD-1@BSA, and the liver and other major organs including the liver, heart, kidney, spleen, and lungs were removed for and ex vivo fluorescence imaging. A much stronger fluorescence was observed in the liver of NAFLD mice than in the other organs. Notably, the fluorescence intensity detected in the liver of NAFLD mice is ~2.7-fold higher than that of the WT mice, suggesting an upregulation of LDs during the development of NAFLD (Figs. 3c and d). In addition, hematoxylin-eosin (H & E) staining was performed to analyze the liver slices obtained from the NAFLD and WT mice. In contrast to the histologically normal liver tissue characterized by orderly hepatic cord arrangement, the NAFLD model manifested prominently enlarged and vacuolated hepatocytes with disrupted hepatic cords (Fig. 3e). We did not observe any discernible tissue injury in the spleen, lungs, heart, and kidneys of both groups, suggesting biocompatibility of LD-1@BSA (Fig. S16 in Supporting information). These findings substantiate the potential of LD-1@BSA for non-invasive early-stage detection of NAFLD by in-situ fluorescence imaging of LDs.
In summary, we designed and synthesized a TICT-based long-wavelength fluorescent probe, LD-1, for the imaging of LDs. LD-1 exhibits a strong long-wavelength fluorescence in the range of 600–800 nm, a large Stokes shift of 104 nm, and a fluorescence quantum yield of 21.2% when exposed to TG. After self-assembly with BSA, the resulting LD-1@BSA hybrid with good photostability achieved the sensitive fluorescence imaging of LDs formed in human hepatoma cells and mouse primary hepatocytes after OA treatment. The probe hybrid was also capable of monitoring LD fusion and separation induced by different external stimuli. Finally, the successful in-situ fluorescence visualization of the liver of mice with NAFLD suggests the potential of our developed probe hybrid as a molecular probe for the study of LD biology.
The authors declare that they have no known competing financial interests or personal relationships that could have appeared to influence the work reported in this paper.
The authors thank the National Natural Science Foundation of China (Nos. 22107029, 22377135, 22305178, 92253306 and 82130099), the Taishan Scholars Program (No. tsqn202312305), the Young Elite Scientists Sponsorship Program by Chinese Chemical Society, the Fundamental Research Projects of Science & Technology Innovation and development Plan in Yantai City (No. 2023JCYJ059), the Shandong Laboratory Program (No. SYS202205), the Fundamental Research Funds for the Central Universities (No. 222201717003), the Programme of Introducing Talents of Discipline to Universities (No. B16017), the Open Funding Project of the State Key Laboratory of Bioreactor Engineering, the State Key Laboratory of Drug Research (No. SKLDR-2023-KF-10) and the Ministry of Education Key Laboratory on signaling Regulation and Targeting Therapy of Liver Cancer (Naval Medical University) (No. 2023-MEKLLC-MS/ZD-00*). The authors are grateful to staff members of the Integrated Laser Microscopy System at the National Facility for Protein Science in Shanghai (NFPS), Shanghai Advanced Research Institute, Chinese Academy of Sciences, China, for their help in data collection.
Supplementary material associated with this article can be found, in the online version, at doi:
L. Henry, J. Paik, Z.M. Younossi, Aliment. Pharmacol. Ther. 56 (2022) 942–956. doi: 10.1111/apt.17158
Z.M. Younossi, J. Hepatol. 70 (2019) 531–544. doi: 10.1016/j.jhep.2018.10.033
Z.M. Younossi, P. Golabi, L. de Avila, et al., J. Hepatol. 71 (2019) 793–801. doi: 10.1016/j.jhep.2019.06.021
Z. Younossi, F. Tacke, M. Arrese, et al., Hepatology 69 (2019) 2672–2682. doi: 10.1002/hep.30251
E. Makri, A. Goulas, S.A. Polyzos, Arch. Med. Res. 52 (2021) 25–37. doi: 10.1016/j.arcmed.2020.11.010
N. Chalasani, Z. Younossi, J.E. Lavine, et al., Hepatology 67 (2018) 328–357. doi: 10.1002/hep.29367
E. Chartampilas, Hormones 17 (2018) 69–81. doi: 10.1007/s42000-018-0012-x
V.W.S. Wong, L.A. Adams, V. de Lédinghen, G.L.H. Wong, S. Sookoian, Nat. Rev. Gastro. Hepat. 15 (2018) 461–478. doi: 10.1038/s41575-018-0014-9
S.A. Polyzos, C.S. Mantzoros, Metabolism 63 (2014) 161–167. doi: 10.1016/j.metabol.2013.10.010
M. de Vries, J. Westerink, K.H.A.H. Kaasjager, H.W. de Valk, J. Clin. Endocrinol. Metab. 105 (2020) 3842–3853. doi: 10.1210/clinem/dgaa575
E. Scorletti, R.M. Carr, J. Hepatol. 76 (2022) 934–945. doi: 10.1016/j.jhep.2021.11.009
A. Mehlem, C.E. Hagberg, L. Muhl, U. Eriksson, A. Falkevall, Nat. Protoc. 8 (2013) 1149–1154. doi: 10.1038/nprot.2013.055
Y. Minami, A. Hoshino, Y. Higuchi, et al., Nat. Commun. 14 (2023) 4084. doi: 10.1038/s41467-023-39404-6
Y.H. Pan, X.X. Chen, L. Dong, et al., Chin. Chem. Lett. 32 (2021) 3895–3898. doi: 10.1016/j.cclet.2021.06.024
H.H. Han, H. Tian, Y. Zang, et al., Chem. Soc. Rev. 50 (2021) 9391–9429. doi: 10.1039/d0cs01183e
L. Wu, J. Liu, X. Tian, et al., J. Am. Chem. Soc. 144 (2022) 174–183. doi: 10.1021/jacs.1c07954
H.N. Xie, Y.Y. Chen, G.B. Zhu, et al., Chem. Commun. 58 (2022) 5029–5032. doi: 10.1039/d1cc06809a
H.H. Han, H.M. Wang, P. Jangili, et al., Chem. Soc. Rev. 52 (2023) 879–920. doi: 10.1039/d2cs00673a
C.C.Y. Wong, L.L. Sun, M.J. Liu, et al., Chem. Commun. 59 (2023) 4328–4331. doi: 10.1039/d3cc00364g
X. Chai, B. Li, C. Chen, et al., Anal. Chem. 95 (2023) 5747–5753. doi: 10.1021/acs.analchem.3c00007
H. Zhou, J. Tang, L. Sun, et al., Sens. Actuat. B: Chem. 278 (2019) 64–72. doi: 10.1016/j.snb.2018.09.081
L. Dong, M.Y. Zhang, H.H. Han, et al., Chem. Sci. 13 (2022) 247–256. doi: 10.1039/d1sc05057e
J. Guo, M. Du, Z. Chen, X. Chen, Z. Yuan, iRADIOLOGY 1 (2023) 209–224. doi: 10.1002/ird3.26
Y. Chen, J. Chen, B. Chang, iRADIOLOGY 1 (2023) 36–60. doi: 10.1002/ird3.10
J. Chen, D. Huang, M. She, et al., ACS Sens. 6 (2021) 628–640. doi: 10.1021/acssensors.0c02343
Y. Wu, L.L. Sun, H.H. Han, et al., Chem. Sci. 15 (2024) 757–764. doi: 10.1039/D3SC05010F
H.H. Han, M.J. Liu, W. Zhang, et al., Talanta 270 (2024) 125526. doi: 10.1016/j.talanta.2023.125526
J. Yin, M. Peng, Y. Ma, R. Guo, W. Lin, Chem. Commun. 54 (2018) 12093–12096. doi: 10.1039/c8cc07398h
X. Zheng, W. Zhu, F. Ni, et al., Chem. Sci. 10 (2019) 2342–2348. doi: 10.1039/c8sc04462g
Z.R. Grabowski, J. Dobkowski, Pure Appl. Chem. 55 (1983) 245–252. doi: 10.1351/pac198855020245
Y. Zhao, W. Shi, X. Li, H. Ma, Chem. Commun. 58 (2022) 1495–1509. doi: 10.1039/d1cc05717k
J. Zhang, W. Han, X. Zhou, et al., Anal. Chem. 95 (2023) 11785–11792. doi: 10.1021/acs.analchem.3c02053
Y. Cheng, X. Wang, J. Chen, et al., Chin. Chem. Lett. 35 (2024) 109156. doi: 10.1016/j.cclet.2023.109156
H. Zhu, K. Ma, R. Ruan, et al., Chin. Chem. Lett. 35 (2024) 108536. doi: 10.1016/j.cclet.2023.108536
C. Li, Y. Pang, Y. Xu, et al., Chem. Soc. Rev. 52 (2023) 4392–4442. doi: 10.1039/d3cs00227f
Y. Fu, H.H. Han, J. Zhang, et al., J. Am. Chem. Soc. 140 (2018) 8671–8674. doi: 10.1021/jacs.8b05425
X. Chai, H.H. Han, A.C. Sedgwick, et al., J. Am. Chem. Soc. 142 (2020) 18005–18013. doi: 10.1021/jacs.0c05379
Z. Jia, H.H. Han, A.C. Sedgwick, et al., Front. Chem. 8 (2020) 389. doi: 10.1038/s41417-019-0106-x
H.H. Han, A.C. Sedgwick, Y. Shang, et al., Chem. Sci. 11 (2020) 1107–1113. doi: 10.1039/c9sc03961a
Z.F. Liu, J. Ren, P. Li, et al., Angew. Chem. Int. Ed. 62 (2023) e202214211. doi: 10.1002/anie.202214211
H. Wang, H. Zheng, W. Zhang, et al., Sens. Actuat. B: Chem. 394 (2023) 134347. doi: 10.1016/j.snb.2023.134347
W.T. Dou, P. Qiu, Y. Shi, et al., J. Am. Chem. Soc. 145 (2023) 17377–17388. doi: 10.1021/jacs.3c05052
T.A. Wani, A.H. Bakheit, S. Zargar, M.A. Bhat, A.A. Al-Majed, Bioorg. Chem. 89 (2019) 103010. doi: 10.1016/j.bioorg.2019.103010
S. Salentin, S. Schreiber, V.J. Haupt, M.F. Adasme, M. Schroeder, Nucleic Acids Res. 43 (2015) W443–W447. doi: 10.1093/nar/gkv315
Y. Fujimoto, H. Itabe, T. Kinoshita, et al., J. Lipid Res. 48 (2007) 1280–1292. doi: 10.1194/jlr.M700050-JLR200
H. Tian, A.C. Sedgwick, H.H. Han, et al., Coord. Chem. Rev. 427 (2021) 213577. doi: 10.1016/j.ccr.2020.213577
Y. Fujimoto, J. Onoduka, K.J. Homma, et al., Biol. Pharm. Bull. 29 (2006) 2174–2180. doi: 10.1248/bpb.29.2174
J. Chen, C. Wang, W. Liu, et al., Angew. Chem. Int. Ed. 60 (2021) 25104–25113. doi: 10.1002/anie.202111052
G.J. Ooi, P.J. Meikle, K. Huynh, et al., J. Hepatol. 75 (2021) 524–535. doi: 10.1016/j.jhep.2021.04.013
R. Papazyan, X. Liu, J. Liu, et al., J. Lipid Res. 59 (2018) 982–993. doi: 10.1194/jlr.m081935

Scheme 1 Chemical structure of LD-1 and its self-assembly with BSA to form the LD-1@BSA hybrid for the long-wavelength fluorescence imaging of LDs in cells and in vivo.

Figure 1 (a) Fluorescence spectra and (b) relative intensity of LD-1 (with respect to cyclohexane) in different organic solvents. (c) Fluorescence spectra and (d) plotting the relative fluorescence intensity of LD-1 as a function of 1,4-dioxane ratio in DMSO (0–100%). (e) Fluorescence spectra and (f) plotting the relative fluorescence intensity of LD-1 in EtOAc with increasing triglyceride (0–100%). Inset: Photo of LD-1 dissolved in EtOAc (lower left) and triglyceride (upper right) without and with excitation. (g) Density functional theory (DFT) calculated frontier molecular orbital plots and energy level diagrams of LD-1. (h) Photo of LD-1 dissolved in different organic solvents upon excitation. ⅰ: cyclohexane; ⅱ: 1,4-dioxane; ⅲ: THF; ⅳ: CH2Cl2; ⅴ: CH3CN; ⅵ: EtOAc; ⅶ: MeOH; ⅷ: DMSO. c = 10 µmol/L, λex = 500 nm.

Figure 2 Fluorescence images (a) and quantification (b) of HepG2 cells incubated with different concentrations of OA for 24 h, followed by LD-1@BSA (5 µmol/L) for another 2 h. Scale bar: 50 µm. Data are expressed as mean ± standard deviation (S.D.) of three parallel experiments. Statistical analysis: P < 0.05, **P < 0.01, ***P < 0.001, ****P < 0.0001 vs. control. λex/λem = 488/650–750 nm for LD-1@BSA; λex/λem = 405/420–480 nm for DAPI.

Figure 3 In vivo fluorescence imaging of NAFLD and WT mice treated with LD-1@BSA (1 mg/kg). (a) Fluorescence imaging and (b) quantification of NAFLD ob/ob mice fed with a HFD diet and WT mice fed with normal diet used as control. (c) Fluorescence quantification and (d) imaging of selected organs isolated from mice of both groups. 1: kidney, 2: liver, 3: spleen, 4: heart, 5: lung. The fluorescence intensity of control group is defined as 1.0. Statistical significance levels: P < 0.05, **P < 0.01 vs. WT. Error bars represent S.D. (n = 3). (e) Representative H & E histological staining of the liver slices obtained from the NAFLD and WT mice treated with LD-1@BSA. Scale bar: 800 µm.

 扫一扫看文章

扫一扫关注我们
 DownLoad:
 下载:
下载: