Figure 1.
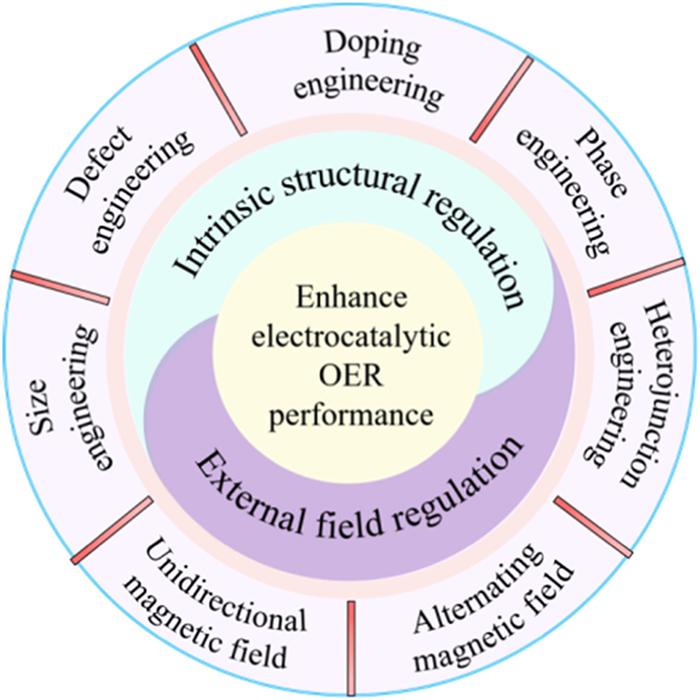
Various strategies to improve TMDs electrocatalytic OER.
The strategies to improve TMDs represented by MoS2 electrocatalytic oxygen evolution reaction
Junan Pan , Xinyi Liu , Huachao Ji , Yanwei Zhu , Yanling Zhuang , Kang Chen , Ning Sun , Yongqi Liu , Yunchao Lei , Kun Wang , Bao Zang , Longlu Wang

Transition metal dichalcogenides (TMDs) typically represented by MoS2 have been widely studied in the field of electrocatalytic hydrogen evolution reaction (HER), which have enormous potential in replacing precious metal commercial Pt/C [1–6]. It is expected to reduce the cost of electrocatalytic HER, thus promoting the development of hydrogen energy. Nevertheless, for the overall water splitting, the oxygen evolution reaction (OER) is the rate limiting reaction, which determines the overall water splitting performance [7–11]. Therefore, it is necessary to explore some strategies to enhance the performance of OER, thus to accelerate overall water splitting.
In terms of OER, the reaction process involved a four electron transfer, which is much more complicated than hydrogen evolution reaction (HER) with two electron transfer process [12–15]. In recent years, some outstanding progress has been made for the application of TMDs in oxygen evolution reactions [16–20]. The catalytic OER efficiency is mainly determined by the structure of the catalyst. It is acknowledged that the number of active sites, the intrinsic activity of each active site, and the conductivity of the catalyst are the main effective factors of catalytic performance for OER [21–26]. At present, researchers mainly regulate the structure of catalysts through size engineering [27,28], defect engineering [29,30], doping engineering [31,32], phase engineering [33,34] heterojunction engineering [35–38] and so on. It is necessary to review above structural regulation of TMDs electrocatalyst represented by MoS2 to improve electrocatalytic OER performance and to revisit the corresponding catalytic mechanism [39–43]. It is also worth noted that the structure of the catalyst is easily reconstructed during the OER process. In other words, the atomic structure of the active sites would dynamically evolve during the catalytic reaction process, which makes the true active sites difficult to determine [44–50]. The external field assisted OER strategies represented by magnetic field regulation are also worth attention [51,52]. Yuan et al. design a catalytic model in which anchored single cobalt atoms to the Mo vertex of MoS2 by laser molecular beam epitaxy to research the external field regulation for OER [53]. Single Co atom as the active site not only improves the OER performance of MoS2, but also induces the in-plane room temperature ferromagnetic properties through hybridization with nearby S and Mo atoms. On this basis, the OER performance of the magnetic monatomic catalyst has been significantly soared by using the magnetothermal effect caused by the continuous spin reversal of the magnetic monatomic catalyst under the high-frequency alternating magnetic field. At present, the research about TMDs electrocatalytic OER is still in the embryonic stage. It is urgent to summarize the recent progress on TMDs catalytic OER to promote the development of this field.
In this review, we comprehensively and systematically summarized the strategies to improve TMDs electrocatalytic OER as shown in Fig. 1. First of all, structural regulation of MoS2-based electrocatalyst was summarized in detail, mainly including size engineering, defect engineering, doping engineering, phase engineering and heterojunction engineering. Once more, external field regulation to improve MoS2 electrocatalytic OER performance was discussed in depth. Last but not least, the strategies to improve MoS2 electrocatalytic oxygen evolution is prospected and some views on the development of this field is outlined.
There are many ways to improve the properties of catalysts, among which the regulation of catalyst structure is one of the common methods [16–20]. By adjusting the structure of the catalyst, the surface active site density, adsorption capacity of reactant molecules, surface acidity and alkalinity can be changed, so as to achieve fine control of the reaction [21–26]. At present, the common methods to regulate the MoS2 structure to promote its OER performance include: size engineering, defect engineering, doping engineering, phase change engineering and heterojunction engineering [27–38].
The active sites are significant parts of the catalyst with extraordinary catalytic effect [1,2]. The active sites tend to exist in low-coordination atoms, and from a geometric point of view, the active sites tend to be concentrated at the vertex and edge of the material [54–58]. Then, if the bulk catalytic material is divided into small sized catalytic materials by certain means, more active sites can be exposed, which can produce a breakthrough increase in the original performance of the catalyst [16,17]. For this reason, nano-sized materials such as quantum dots will be preferred over their bulk counterparts [59–64]. Study the related catalytic properties of nano-sized catalysts such as quantum dots and the catalytic activity of active sites at the edges, vertices and surfaces should also be taken.
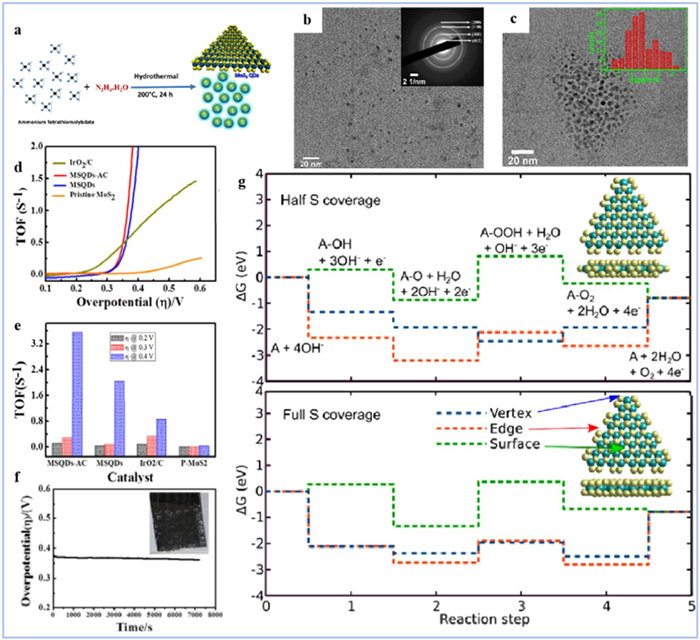
MoS2 quantum dots (MSQDs) are also demonstrated to have promising applications in OER [59,63,64]. Mohanty et al. uses (NH4)2MoS4 and hydrazide to obtain MSQDs through hydrothermal synthesis technology, which avoids the formation of carbon quantum dots (CQDs) caused by the use of carbon organic solution, and thus avoids the impact of CQDs on the performance of MSQDs (Fig. 2a) [59]. Based on the analysis of TEM images and the histogram of the size distribution, it can be observed that the synthesized MSQDs particles exhibit a size below 7 nm and demonstrate well-defined lattice fringes (Figs. 2b and c). Subsequently, the number of active sites and turn over frequency of MSQDs were estimated to test their OER performance. As shown in Figs. 2d and e, in the case of high overpotential, the TOF value of MSQDs-AC is higher than that of commercial IrO2/C, indicating that the OER performance of MSQDs-AC at this time has exceeded that of commercial IrO2/C. It also shows that MSQDs after activation cycle has more superb catalytic activity, which may be due to the increase of the number of active sites. Additionally, MSQDs also have excellent stability. After continuous electrolysis for 2 h at the current density of 10 mA/cm2, almost no change in overpotential is observed, which can be applied to long-term electrolysis applications (Fig. 2f). In order to further study the catalytic mechanism, the authors used DFT to calculate the OER free energy distribution at different positions of the catalyst under the condition of half S coverage and full S coverage (Fig. 2g). The results show that the catalytic activity at the vertex and edge is more superior than that at the surface. This work provides a profound insight into the synthesis method and catalytic properties of MSQDs, which is conducive to the further application of MSQDs in OER, and the structure can also be applied to other transition metals for catalytic production of related energy sources.
Different characteristics of crystal materials, including their electrical, optical, thermal, magnetic, and mechanical attributes, are linked to the presence of defects in their structure [29,30,65–68]. Defects usually exist in the preparation and application of materials, which serve as active sites for the synthesis of target catalyst materials and promote the occurrence of catalytic reactions [44,45]. Defect engineering offers a viable approach for regulating the surface physicochemical properties of catalytic materials. The existence of defects plays a crucial role in regulating its electronic structure and chemical properties, thereby facilitating the emergence of novel physical and chemical properties or fostering robust synergistic effects to enhance the catalytic efficiency of electrocatalysts [36,59,69–73].
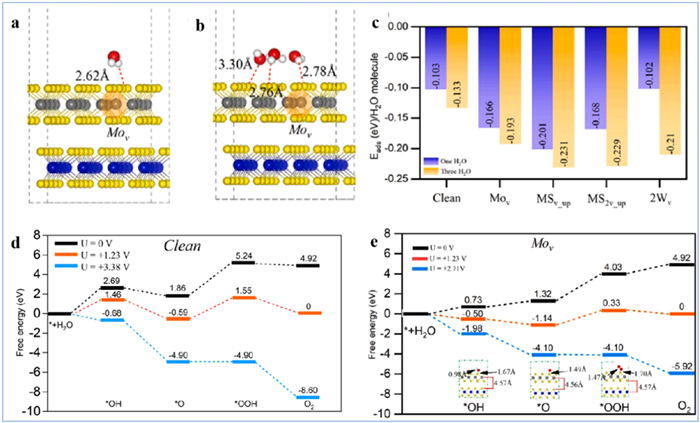
Asad Mahmood et al. investigated the effect of various defects on the OER catalysis of WS2/MoS2 heterojunction [69]. The bond length and the vacancy formation energy of WS2/MoS2 heterojunction material for clean (no vacancy) and other vacant WS2/MoS2 heterojunctionare calculated. The calculation results of the bond length show that the introduction of defects changes the layer spacing and interface distance of the material, and indeed enhances the interaction between WS2 and MoS2. The low formation energy and stability of the S defect can be inferred from the vacancy formation energy. In order to further study the OER properties of WS2/MoS2 heterojunction, the adsorption of one and three water molecules was simulated and the corresponding adsorption energy was calculated (Figs. 3a–c). The results show that the adsorption energy of three water molecules is greater than that of one water molecule, and the adsorption energy of clean WS2/MoS2 is smaller than that of other WS2/MoS2 with vacancy except for 2Wv WS2/MoS2. The greater degree degrader of OER free energy and the overpotential could be observed in the images of free energy of OER due to the introduction of Mo defects (Figs. 3d and e), which proves that the addition of defects could induce outstanding OER activity. This work provides a feasible approach for changing the structure of related materials including heterojunctions, and enhancing chemical properties such as the catalytic performance of OER. Expanding its application to other materials may further promote the development of OER catalytic material.
As a semiconductor material, 2H-MoS2 has poor intrinsic conductivity and its active sites only concentrated at the edge of the nanosheets, which leads to poor OER performance [33,74–77]. Doping engineering is one of the effective ways to active the inert basal plane. Doping oxophilic metals (such as Co, Ni, Fe) into basal plane of MoS2 nanosheets can regulate the electronic structure of MoS2, thereby speeding up the transfer of electrons to its active sites. Moreover, doping can also add the quantity of active sites and boost the intrinsic activity of per active sites. This will greatly improve the catalytic OER performance and the overall water splitting performance. At present, a lot of researches has been focus on metal doping including single metal doping engineering and bimetal doping engineering to facilitate the OER performance of MoS2 [78–81].
Single metal doping refers to the substitution of transition metals (such as Co, Ni) for the position of some Mo atoms in MoS2. Because the atomic radius size of doped metal atom’s, element type and coordination mode are different from Mo, it will cause the change of coordination valence and the formation of new defect forms and strains on the surface, thus further changing the electronic structure and then affect its catalytic activity [32,78–82].
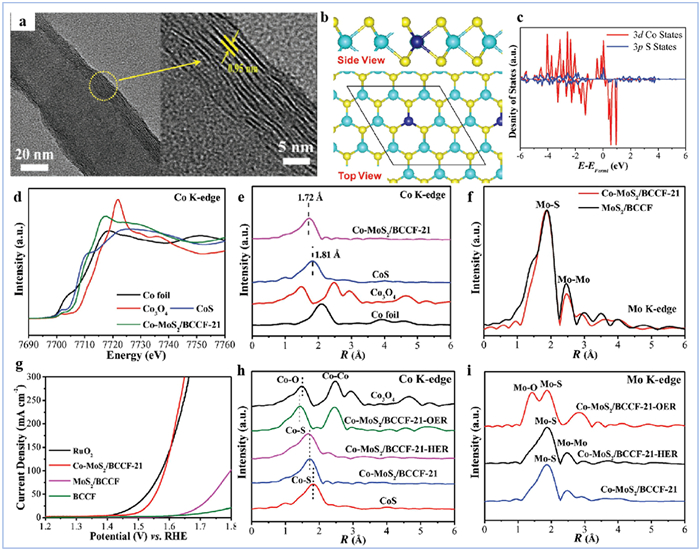
It has been reported that Co covalent doping in MoS2 can effectively solve the problem of poor catalytic effect of OER. Xiong et al. reported on a bifunctional Co covalently doped MoS2 catalyst, which can enhance the catalytic performance of both HER and OER [78]. They first prepared Co-Mo2C/BCCF-X (X represents the Mo/Co molar ratio in the adsorption solution) by using bacterial cellulose as an adsorption regulator, combined with (NH4)6Mo7O24 and Co(NO3)2 solutions. Then it is further converted to Co-MoS2/BCCF-X by vapor phase hydrothermal method. The TEM image of Co-MoS2/BCCF-21 is shown in Fig. 4a, it is composed of internal carbon cellulose and external layers of MoS2 shells with a layer spacing of about 10 nm. DFT calculations show that Co doped into MoS2 in the form of replacing Mo atoms in MoS2, forming a stable structure with a Mo/Co ratio of 8:1 (Fig. 4b). Additionally, Fig. 4c shows the formation of CO-S bond after Co doping. The Co valence state in Co-MoS2 /BCCF-21 exhibits dissimilarity compared to that in Co foil, Co3O4, and CoS (Fig. 4d), and the length of the Co-S bond formed is also 0.09 Å shorter than that in CoS, which indicates that Co is covalently doped into MoS2, not to form metal Co or CoOx (Fig. 4e). In addition, the decrease of Mo–Mo coordination from Co-MoS2/BCCF-21 is also proving this (Fig. 4f). Meanwhile, these results also confirm the change of electronic structure after Co covalently doped MoS2. Co doping significantly boost the activity of OER (Fig. 4g), the performance of Co MoS2/BCCF-21 and related materials, as well as commercial RuO2 electrodes were investigated. It can be found that the initial potential of Co-MoS2/BCCF-21 is only 1.45 V (vs. RHE), which is only 6 mV higher than RuO2. Besides, when the potential exceeds 1.6 V, the OER performance of Co-MoS2/BCCF-21 will exceed that of RuO2: A greater current density will occur at the same potential. However, the origin of the OER activity of Co covalently doped MoS2 remains ambiguous. In this regard, Xiong et al. compared the EXAFS spectra of the catalyst after HER and OER, and found that the catalyst after OER formed Co–O bonds and Mo-O bonds (Figs. 4h and i) [78]. In addition, considering that the OER performance of undoped MoS2-BCCF under alkaline conditions is poor (Fig. 4e), and the newly formed Co–O bond length is shorter than that of Co3O4 (Fig. 4h), it is reasonable to guess that the active source of OER is the formation of high valence state Co substances under alkaline conditions and anodic potentials. In summary, the catalyst provides a new way to improve the performance of OER by doping method and to design bifunctional catalysts. At the same time, the doping method can also be applied to other transition metal catalysts. Neverthless, the exact source of OER activity remains to be further research.
Single metal doping has relatively limited effects on the regulation of electronic structure, the increase of active site and the change of electron density of catalyst, so the improvement degree of catalyst performance still needs to be facilitated. Compared with single metal doped catalysts, some bimetal doped catalysts show better performance in the same aspect [79–81]. Appropriate doping of two metals can better alter the electronic structure and electron density of the catalyst, while achieving complementarity and mutual promotion in the improvement of related performance. Taking advantage of the synergistic effect between some bimetals and doping them into MoS2, the electronic structure and physical and chemical properties of MoS2 can be modified.
Sathiyan et al. synthesized Fe-Co doped MoS2 products with different Co/Fe ratios by hydrothermal method [79]. The surface of the synthesized Fe0.10Co0.90-MoS2 sample is rough and petal-like, which increases the active area of the catalyst, facilitates better contact with the reactants and improves catalytic activity. As shown in Fig. 5a, the OER performance of Fe and Co bimetal doped MoS2 catalyst is much higher than that of MoS2, and the OER performance is also improved tremendously compared with the single metal doped catalyst of Co or Fe. The doping of Fe and Co changed the binding energy of Mo and S, and the PDOS plots demonstrate doping modifies the electronic structure of the catalysts (Figs. 5b and c). This is one of the reasons for the exaltation of OER performance. Sathiyan et al. studied the difference of OER properties of catalysts doped with single-metal and bimetal in different proportions, obtained the result that the OER overpotential of bimetal doped was lower than that of single metal doped and verified the better performance of Fe-Co doped catalyst.
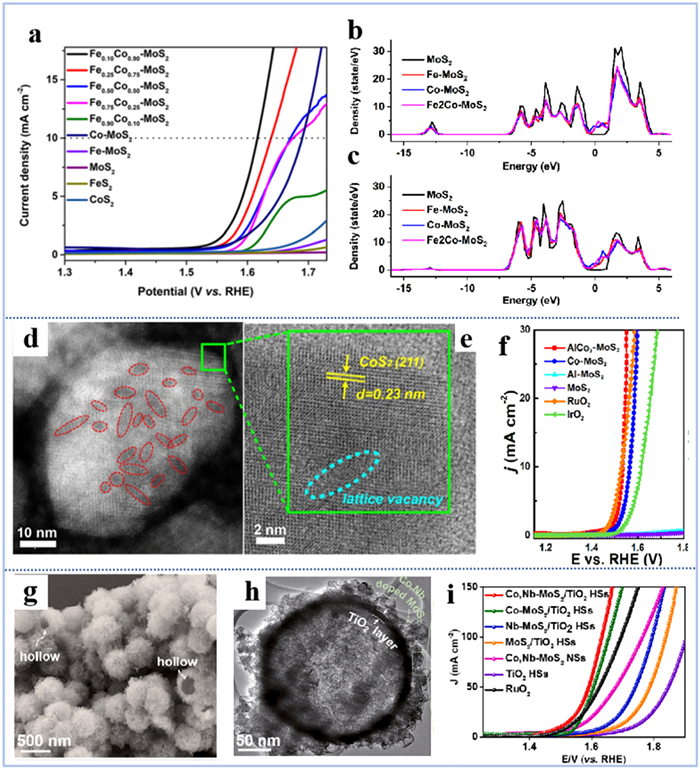
Al and Co doped MoS2 catalysts have also been designed to improve the catalytic efficiency of OER [80]. The stoichiometric ratio of Al and Co doped into MoS2 is 1:3. The HAADF image and HRTEM image of AlCo3-MoS2 are shown in Figs. 5d and e. The prepared AlCo3-MoS2 sample has a corrugated structure and lattice vacancy. It can be seen from Fig. 5f that the OER catalytic activity of Al-MoS2 is negligible, Co-MoS2 has relatively wonderful OER catalytic activity, and the catalytic activity of AlCo3-MoS2 is more splendid than that of Co-MoS2. The reason why this phenomenon appeared is that the doping of Al causes the Co2+ in Co-MoS2 to be oxidized into highly active Co3+, which further improves the performance of OER.
The Co and Nb doped MoS2 nanosheet shelled micro-TiO2 hollow spheres prepared by Nguyen et al. is also an excellent bimetal-doped OER catalyst [81]. Co and Nb doped MoS2 nanosheets are deposited directly on PS@TiO2 sphere by hydrothermal reaction. The obtained Co, Nb-MoS2/PS@TiO2 precursor is annealed at 650 ℃ in Ar atmosphere for 3 h, then it will be converted into Co, Nb-MoS2/TiO2 HSs. The hollow spherical structure of Co, Nb-MoS2/TiO2 HSs can be clearly observed from its SEM and TEM images (Figs. 5g and h). In addition, it could also indicate that the ultra-thin nanosheets are uniformly covered on the spherical surface. The results show that the catalytic performance of Co, Nb-MoS2/TiO2 HSs is more outstanding by testing and comparing the OER activity of correlative materials (Fig. 5i). The chemical coupling effect between Co, Nb-MoS2 NSs and TiO2 hollow spheres, the co-doping effect of Co and Nb is also one of the essential reasons. The electronic states of Co and Nb doped MoS2 are in proximity to the Fermi level, and the electronic states are higher than those of single metal Co or Nb doped catalysts, which is conducive to electron transfer and adsorption of intermediates. The high efficiency and stability of the material also make it have potential for application in the case of high current density of industrial grade. These works provide a valuable insight into how to use the synergistic effect of bimetal doping to further improve catalyst performance compared with single metal doping. At the same time, as an effective means to improve the catalytic performance of OER, it is worth further research and extension.
MoS2 has a variety of phase states, which can be roughly divided into semi-conductive and metallic phases. Generally speaking, the MoS2 semiconductor material refers to 2H-MoS2. 2H-MoS2 exhibits an adjustable band gap, thus it has semiconductor properties, while 1T-MoS2 has metallic behavior due to its lack of band gap. The 1T-MoS2 electrocatalyst has a higher conductivity, which improves the electron transport capacity and is able to enhance the contact between the electrolyte and the active site. Therefore, phase transition engineering is also an effective method that can change the properties of MoS2. By converting 2H-MoS2 to 1T-MoS2, superior OER catalytic activity can be obtained [33,34,83].
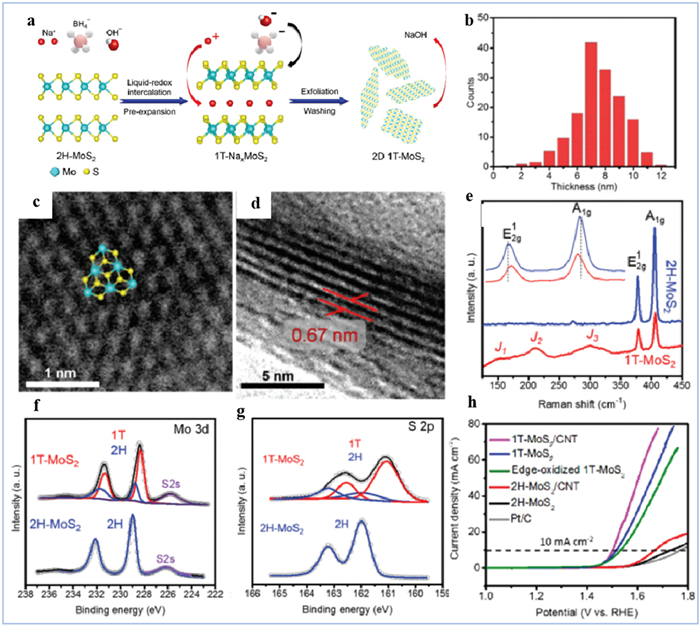
Sadighi et al. prepared 2D 1T-MoS2 nanosheets by in situ liquid-redox intercalation and solvent exchange exfoliation [83]. At the same time, the strong reductiveness of NaBH4 is used to stabilize the structure and transfer electrons to the S layer of 1T-NaxMoS2 to compensate for the charge generated by Na+ embedding (Fig. 6a). In addition, the gas released by NaBH4 decomposition is used to generate stress, which makes MoS2 pre-expand and facilitates the embedding of Na+. And it was hybridized with 30 wt% carbon nanorods to form a 1T-MoS2/CNT electrode. The thickness of the generated 2D 1T-MoS2 nanosheets with triangular pattern is mostly between 4 and 11 nm (Figs. 6b and c), and their layer spacing is 0.67 nm (Fig. 6d). 2H-MoS2 and 1T-MoS2 have different Raman spectra and X-ray photoelectron spectroscopy (Figs. 6e–g). Above all these indicate that 2H-MoS2 completes the transformation to metalic 1T-MoS2 after Na+ embedding. The OER performance of 1T-MoS2, 1T-NaxMoS2, 1T-MoS2/CNT, 2H-MoS2, 2H-MoS2/CNT and Pt/C were tested at a current density of 10 mA/cm2 (Fig. 6h). The results show that the OER performance of 1T-MoS2 series materials is much higher than that of 2H-MoS2, which demonstrates that phase transition an greatly change the properties of MoS2. 1T-MoS2 is a promising catalytic material for OER due to its unique conductor-like properties. It combines with materials such as carbon nanotubes will also expand its application areas.
The above strategies are all aimed at improving the poor oxygen precipitation performance of MoS2 single material by adjusting its own structure, achieving a qualitative leap in catalytic efficiency [84–88]. We can also solve this problem by forming heterojunctions with other materials with excellent OER catalytic performance [8,16,35–38,89–102]. For example, Co3O4 with OER catalytic performance and MoS2 with outstanding HER catalytic performance forming heterojunction materials can effectively promote the progress of HER and OER, achieving complementary performance and multifunctional catalytic performance [91]. The heterogeneous interface formed by the effective combination of two or more materials can fully utilize the synergistic effect between the materials. The strong interactions between materials will form electron transfer, which helps to increase the electron density of the catalyst. And heterogeneous interface could expose more OER active sites, induce electron reconstruction at the interface, which can improve the limited catalytic activity [8,10,31,33–35,72,103–107].
For instances, Yang et al. prepared Ni foam supported MoS2-Ni3S2 heterogeneous nanorods by hydrothermal method in one pot at 240 ℃ for more than 24 h (Fig. 7a) [90]. Ni3S2 nanorods are uniformly integrated with MoS2 nanomaterials, and the heterogeneous interface is also effectively exposed, which also promotes the effective transmission of electrons on the Ni3S2 nanorods.
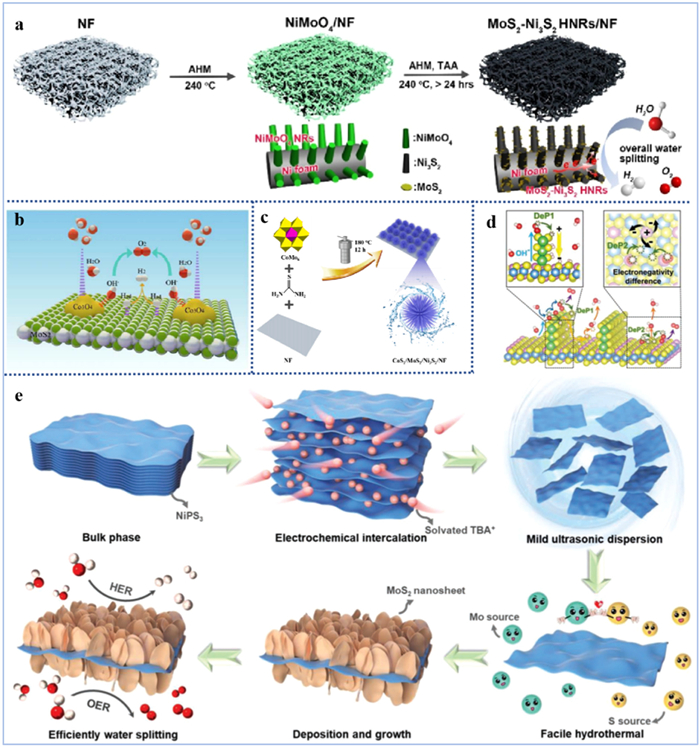
Electron reconfiguration driven by heterogeneous interfaces changes the electronic structure of the catalyst, thereby altering its properties, or may lead to the formation of new substances to improve the catalytic performance of OER. As a promising OER catalyst, Co3O4 was also used by Liu et al. to combine with MoS2 to form Co3O4@MoS2 heterojunction (Fig. 7b) [91]. The newly constructed interface induces a redistribution of electrons, which will reduce the Gibbs free energy of the OER intermediate and accelerate the OER process. Zhang et al. prepared a CoS2/MoS2/Ni3S2/NF electrode where electrons are transferred from Ni3S2 to CoS2 and then to MoS2, which will form a high-priced Ni substance that can accelerate OER (Fig. 7c) [92]. Liu et al. prepared a vertical heterostructure of MoS2/NiPS3 (Fig. 7e), in which the internal electron transfer changes the electronic structure and also forms an internal polarization field [93]. This internal polarization field is conducive to the adsorption of hydroxyl, and will also accelerate the two deprotonation processes, so that the performance of OER is enhanced (Fig. 7d). The above methods provide reference ideas for us to change the active area of the catalyst through interface engineering, promote electron transfer or reconstruction, and make full use of the synergistic effect of various materials to construct MoS2-related heterojunction to improve the performance of OER.
The strategies for improving the OER performance of MoS2 are multifaceted [108–117]. In addition to the strategy of regulating its structure, utilizing the energy provided or inducing new properties by external fields is also a fabulous way to improve the original performance [51,52]. Currently, strategies for improving the OER performance of MoS2 related materials by applying an external magnetic field have been studied [53,118]. Research has demonstrated that the strength and direction of the external magnetic field are key factors that affecting OER performance [53,118].
Through some methods, the original catalyst can be transformed into a ferromagnetic catalyst, and under the condition of an external magnetic field, the parallel spin arrangement of O atoms can be achieved, thus reducing the reaction barrier, optimizing the hysteresis kinetics of the reaction, accelerating the related adsorption and desorption process, leading a positive impact on the performance of OER.
Combining heterogeneous OER electrocatalysts such as ferromagnetic mixed-metal oxides/metals with external magnetic field could enhance OER performance [90,119–124]. Under acidic conditions, Sun et al. synthesized a Ni1/MoS2 single-atom spin catalysts (SASCs) with adjustable Ni content using nickel salt, ammonium molybdate tetrahydrate and thioacetamide by hydrothermal synthesis method (Fig. 8a) [118]. Ni1/MoS2 adopts a distorted tetragonally crystal structure, which induces ferromagnetic-coupled with nearby S atoms and adjacent Ni1 sites, leading to room-temperature ferromagnetism. When the Ni content in Ni1/MoS2 is 0.05 wt%, only paramagnetism is displayed. Nevertheless, the Ni content increases to 0.20, 0.38, 0.95, 1.42, 2.41 and 3.12 wt%, the Ni1/MoS2 shows ferromagnetism, and the magnetization increased with the increase of Ni content (Fig. 8b). Under an external magnetic field (a B field), Sun et al. tested the OER performance of Ni1/MoS2, proving the promotion of the OER performance of Ni1/MoS2. As shown in Fig. 8c, as the B-field increases from 0 to 502 mT, the current density surges significantly when the voltage is higher than 1.6 V. At the same time, the enhancement of OER performance can also be directly observed from the bubbles on the electrode surface. This is also demonstrated by the decrease of overpotential and Tafel slope of Ni1/MoS2 at the current density of 40 mA/cm2 (Fig. 8d). It can be seen from Fig. 8e that for the rate determining step of OER (the process from *OOH to O2), the energy barrier of the ferromagnetic-coupled active site is lower than that of the antiferromagnetic-coupled. And Fig. 8f indicates that the near-EF occupied spin density of S1 of two ferromagnetic-coupled NiMo sites decreased significantly compared with antiferromagnetic-coupled, but the empty state above EF increases. So, the magnetic field enhanced OER performance on Ni1/MoS2 is attributed to magnetic field induced spin alignment and spin density optimization at the S active site, which in turn optimizes the adsorption energy of the radical intermediates to reduce the overall reaction barrier. This study provides a solution to solve the problem of slow kinetics of OER and the development of efficient and stable OER catalysts, and also provides powerful support for accelerating the process of water splitting and realizing efficient production of hydrogen energy.

Sun et al. Studied the effect of external magnetic field on the OER properties of doped MoS2, but did not research the difference of the impact of different magnetic field direction on OER performance [118]. Nevertheless, Gong et al. improved the OER performance of the catalyst through magnetic heating induced by alternating magnetic fields [53]. The effect of vertical magnetic field and parallel magnetic field of opposite direction on the OER performance of Co@MoS2 catalyst was also compared with that of parallel magnetic field.
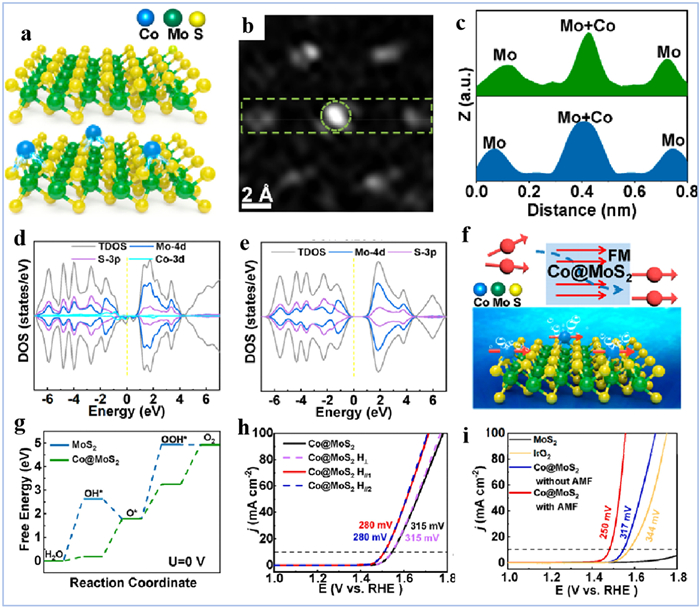
Gong et al. prepared Co@MoS2 catalyst by directly anchoring magnetic Co single-atom (SA) at the Mo top sites of monolayer MoS2, as shown in the lattice structure image (Fig. 9a) [53]. It is easy to observe the brighter part in the HAADF-STEM image, which is the position of the Co SA on the top of the Mo atom (Fig. 9b). The intensity spectrum analysis of HAADF-STEM images can also demonstrate that Co SA is anchored to the top of Mo atom (Fig. 9c). In addition, by calculating the spin-resolved density of states (DOS), it is found that the total density of states (TDOS) of MoS2 is symmetric in spin-down and spin-up, while for Co@MoS2, there is a significant asymmetry between the spin-down and spin-up TDOS near the Fermi level, indicating that Co@MoS2 is magnetic but MoS2 is not (Figs. 9d and e). The catalytic performance of OER can be improved by taking advantage of its room temperature ferromagnetism. The application of alternating magnetic field can induce the parallel spin arrangement of O atoms, thus reducing the dynamic barrier of O—O bond, and the alternating magnetic field could also generate local magnetic heating, heating the active site to further accelerate its adsorption and desorption process, which will drastically enhance the catalytic efficiency of OER (Fig. 9f). The performance optimization of Co@MoS2 catalyst can be learned from the Gibbs free energy images of the four basic reactions in the OER process (Fig. 9g). Further experiments show that when the magnetic field is applied in parallel direction (H//1), the OER performance is significantly improved; however, when the magnetic field is applied in vertical direction (H⊥), it can be seen that the OER performance is basically the same as that without the magnetic field. This may be due to the absence of out-of-plane ferromagnetism of the catalyst. If the parallel magnetic field is changed in the opposite direction (H//2), the improvement effect will not change compared with that before changing the direction. (Fig. 9h), which indicates that the magnetic field in the opposite direction will not have additional impact on the performance of OER. A comparison with commercial IrO2 is also shown in Fig. 9i, Co@MoS2 exhibits superior OER catalytic activity at the laboratory level with or without the addition of a magnetic field.
In general, it is an effective means to improve the poor OER performance of the original catalyst by constructing the catalyst with room temperature ferromagnetism in combination with the external magnetic field, and the direction of the magnetic field may also be a key factor affecting the performance improvement. At the same time, this method is not only suitable for the research and development of OER catalyst, but also can be extended to other catalytic fields.
TMDs has received extensive attention in the field of electrocatalytic hydrogen evolution. In spite of this, OER efficiency is the decisive factor affecting the speed of water splitting reaction, so how to enhance the catalytic efficiency of OER of TMDs is also an urgent problem to be solved. In recent years, strategies to improve TMDs OER performance have been studied and made great progress. In this paper, taking MoS2 as an example, the improvement strategies to improve its OER electrocatalytic performance are reviewed. Firstly, the structural regulation strategies of catalysts are summarized in detail, which are represented by size engineering, defect engineering, doping engineering, phase engineering and heterojunction engineering. The problem of external field control represented by magnetic field to improve the performance of electrocatalytic OER is also discussed in detail. These results laid a foundation for further research to enhance the OER catalytic activity of TMDs. However, for MoS2 catalyzed OER, its own stability needs to be paid attention to. Secondly, in the OER process, the structure of the catalyst is easy to reconstruct, which makes the real activity problem not known enough. In other words, the atomic structure of the active site also evolves dynamically during the catalytic reaction, which makes the true active site difficult to determine. In addition, even if these strategies are effective at the laboratory level, they may still face challenges at high industrial current densities, and the activity and stability of catalysts at high current densities need to be studied to provide reference for their potential industrial applications. In summary, our review is of great significance for improving the performance of MoS2 catalytic oxygen generation, and there is still a long way to go for the actual large-scale application of TMDs electrocatalysis to OER.
We declare that we have no financial and personal relationships with other people or organizations that can inappropriately influence our work, there is no professional or other personal interest of any nature or kind in any product, service and/or company that could be construed as influencing the position presented in, or the review of, the manuscript entitled.
This work was financially supported by the National Natural Science Foundation of China (No. 51902101), Natural Science Foundation of Jiangsu Province (No. BK20201381), Science Foundation of Nanjing University of Posts and Telecommunications (No. NY219144), and the National College Student Innovation and Entrepreneurship Training Program (No. 202310293173K).
S. Wang, J. Li, S. Hu, et al., ACS Appl. Nano Mater. 5 (2022) 2273–2279.
H. Wang, C. Tsai, D. Kong, et al., Nano Res. 8 (2015) 566–575. doi: 10.1007/s12274-014-0677-7
D. Saha, V. Patel, P.R. Selvaganapathy, et al., Nanoscale Adv. 4 (2022) 125–137. doi: 10.1039/D1NA00456E
X. Liu, B. Li, F.A. Soto, et al., ACS Catal. 11 (2021) 12159–12169. doi: 10.1021/acscatal.1c03016
S. Cao, A. Deshmukh, L. Wang, et al., Environ. Sci. Technol. 56 (2022) 8807–8818. doi: 10.1021/acs.est.2c00551
Y. Chen, Z. Tian, X. Wang, et al., Adv. Mater. 34 (2022) 2201630. doi: 10.1002/adma.202201630
J. Cho, H. Seok, I. Lee, et al., Sci. Rep. 12 (2022) 10335. doi: 10.1038/s41598-022-14233-7
L. Wang, X. Liu, Q. Zhang, et al., Nano Energy 61 (2019) 194–200. doi: 10.1016/j.nanoen.2019.04.060
S.H. Kim, J. Lim, R. Sahu, et al., Adv. Mater. 32 (2020) 1907235. doi: 10.1002/adma.201907235
L. Xie, L. Wang, W. Zhao, et al., Nat. Commun. 12 (2021) 5070. doi: 10.1038/s41467-021-25381-1
G. Zhou, Y. Shan, L. Wang, et al., Nat. Commun. 10 (2019) 399. doi: 10.1038/s41467-019-08358-z
J. Tang, Z. Wei, Q. Wang, et al., Small 16 (2020) 2004276. doi: 10.1002/smll.202004276
M. Tayyab, A. Hussain, W.A. Syed, et al., J. Mol. Model. 27 (2021) 213. doi: 10.1007/s00894-021-04834-w
Z. Wei, J. Tang, X. Li, et al., Small Methods 5 (2021) 2100091. doi: 10.1002/smtd.202100091
K. Vega-Granados, Y. Gochi-Ponce, N. Alonso-Vante, Curr. Opin. Electrochem. 33 (2022) 100955. doi: 10.1016/j.coelec.2022.100955
Y. Li, K. Yin, L. Wang, et al., Appl. Catal. B 239 (2018) 537–544. doi: 10.1016/j.apcatb.2018.05.080
L. Wang, Q. Zhang, J. Zhu, et al., Energy Stor. Mater. 16 (2019) 37–45.
L. Wang, X. Liu, J. Luo, et al., Angew. Chem. Int. Ed. 129 (2017) 7718–7722. doi: 10.1002/ange.201703066
K. Sun, Y. Liu, C. Liu, IOP Conf. Ser. : Earth Environ. Sci. 252 (2019) 022136. doi: 10.1088/1755-1315/252/2/022136
S. Wang, D. Zhang, B. Li, et al., Adv. Energy Mater. 8 (2018) 1801345. doi: 10.1002/aenm.201801345
J. Pan, P. Wang, Z. Chen, Mater. Today Chem. 21 (2021) 100528. doi: 10.1016/j.mtchem.2021.100528
L. Pang, A. Barras, Y. Zhang, ACS Appl. Mater. Interfaces 11 (2019) 31889–31898. doi: 10.1021/acsami.9b09112
A. Muthurasu, V. Maruthapandian, H.Y. Kim, Appl. Catal. B: Environ. 248 (2019) 202–210. doi: 10.1016/j.apcatb.2019.02.014
M.S. Kim, D.T. Tran, T.H. Nguyen, Energy Environ. Mater. 5 (2022) 1340–1349. doi: 10.1002/eem2.12366
N. Zhang, Z. Yang, W. Liu, Catalysts 13 (2023) 90. doi: 10.3390/catal13010090
I.S. Amiinu, Z. Pu, X. Liu, Adv. Funct. Mater. 27 (2017) 1702300–1702310. doi: 10.1002/adfm.201702300
Q. Ji, M. Kan, Y. Zhang, et al., Nano Lett. 15 (2014) 198–205.
Z. Yang, X. Xia, M. Fang, et al., Chem. Eng. J. 476 (2023) 146544. doi: 10.1016/j.cej.2023.146544
Z. Yang, X. Xia, M. Fang, et al., Mater. Today Phys. 36 (2023) 101158. doi: 10.1016/j.mtphys.2023.101158
X. Liu, Y. Hou, M. Tang, et al., Chin. Chem. Lett. 34 (2023) 107489. doi: 10.1016/j.cclet.2022.05.003
J. Chen, Y. Tang, S. Wang, et al., Chin. Chem. Lett. 33 (2022) 1468–1474. doi: 10.1016/j.cclet.2021.08.103
C. Sun, L. Wang, W. Zhao, et al., Adv. Funct. Mater. 32 (2022) 2206163. doi: 10.1002/adfm.202206163
M. Liu, H. Li, S. Liu, et al., Nano Res. 15 (2022) 5946–5952. doi: 10.1007/s12274-022-4267-9
X. Cheng, L. Wang, L. Xie, et al., Chem. Eng. J. 439 (2022) 135757. doi: 10.1016/j.cej.2022.135757
S. Wang, L. Wang, L. Xie, et al., Nano Res. 15 (2022) 4996–5003. doi: 10.1007/s12274-022-4158-0
C. Chang, L. Wang, L. Xie, et al., Nano Res. 15 (2022) 8613–8635. doi: 10.1007/s12274-022-4507-z
R. Sukanya, D.C. da Silva Alves, C.B. Breslin, J. Electrochem. Soc. 169 (2022) 064504. doi: 10.1149/1945-7111/ac7172
D.J. Trainer, J. Nieminen, F. Bobba, et al., npj 2D Mater. Appl. 6 (2022) 13. doi: 10.1038/s41699-022-00286-9
P. Vancsó, G. Magda, J. Pető, et al., Sci. Rep. 6 (2016) 29726. doi: 10.1038/srep29726
G. Wang, Y.P. Wang, S. Li, et al., Adv. Sci. 9 (2022) 2200700. doi: 10.1002/advs.202200700
N. Sun, C. Gu, H.C. Ji, et al., Desalination 575 (2024) 117270. doi: 10.1016/j.desal.2023.117270
X. Wu, Y. Gu, R. Ge, et al., Npj 2D Mater. Appl. 6 (2022) 31. doi: 10.1038/s41699-022-00306-8
F. Zakerian, M. Fathipour, R. Faez, et al., J. Theoret. Appl. Phys. 13 (2019) 55–62. doi: 10.1007/s40094-019-0320-9
J. Du, D. Xiang, K. Zhou, et al., Nano Energy (2022) 107875.
G. Shao, X. Xue, B. Wu, Adv. Funct. Mater. 30 (2020) 1906069. doi: 10.1002/adfm.201906069
G. Shao, X. Xue, X. Zhou, ACS Nano 13 (2019) 8265–8274. doi: 10.1021/acsnano.9b03648
J. Xu, G. Shao, Tang X, et al., Nat. Commun. 13 (2022) 2193. doi: 10.1038/s41467-022-29929-7
X. Chen, B. Lei, Y. Zhu, et al., Nanoscale 12 (2020) 17005–17012. doi: 10.1039/D0NR03530K
Z. Cheng, Y. Xiao, W. Wu, et al., ACS Nano 15 (2021) 11417–11427. doi: 10.1021/acsnano.1c01024
Z. Guo, L. Wang, M. Han, et al., ACS Nano 16 (2022) 11268–11277. doi: 10.1021/acsnano.2c04664
Q. Han, H. Cao, Y. Sun, et al., Phys. Chem. Chem. Phys. 24 (2022) 13305–13316. doi: 10.1039/D2CP00705C
Z. Lai, Q. He, T.H. Tran, et al., Nat. Mater. 20 (2021) 1113–1120. doi: 10.1038/s41563-021-00971-y
X. Gong, Z. Jiang, W. Zeng, Nano Lett. 22 (2022) 9411–9417. doi: 10.1021/acs.nanolett.2c03359
M. Mathankumar, K. Karthick, A.K. Nanda Kumar, et al., ACS Sustain. Chem. Eng. 9 (2021) 14744–14755. doi: 10.1021/acssuschemeng.1c04106
K. Nie, X. Qu, D. Gao, et al., ACS Appl. Mater. Interfaces 14 (2022) 19847–19856. doi: 10.1021/acsami.2c01358
M. Okada, J. Pu, Y.C. Lin, et al., ACS Nano 16 (2022) 13069–13081. doi: 10.1021/acsnano.2c05699
J. Pan, R. Wang, X. Xu, et al., Nanoscale 11 (2019) 10402–10409. doi: 10.1039/C9NR00997C
J. Pan, W. Zhang, X. Xu, et al., RSC Adv. 11 (2021) 23055–23063. doi: 10.1039/D1RA03821D
B. Mohanty, M. Ghorbani-Asl, S. Kretschmer, ACS Catal. 8 (2018) 1683–1689. doi: 10.1021/acscatal.7b03180
Q. Peng, X. Qi, X. Gong, et al., Materials (Basel) 14 (2021) 4073.
J. Seok, J.H. Lee, S. Cho, et al., 2D Mater. 4 (2017) 025061. doi: 10.1088/2053-1583/aa659d
Y. Shi, D. Zheng, X. Zhang, et al., Chem. Mater. 33 (2021) 6217–6226. doi: 10.1021/acs.chemmater.1c01965
G. Zhan, J.F. Zhang, Y. Wang, J. Colloid Interf. Sci. 566 (2020) 411–418. doi: 10.1016/j.jcis.2020.01.109
Z.M. Sun, J.L. He, M.W. Yuan, Nano Energy 65 (2019) 103996. doi: 10.1016/j.nanoen.2019.103996
J. Strachan, A.F. Masters, T. Maschmeyer, ACS Appl. Nano Mater. 4 (2021) 2030–2036. doi: 10.1021/acsanm.0c03355
Y. Yu, G.H. Nam, Q. He, et al., Nat. Chem. 10 (2018) 638–643. doi: 10.1038/s41557-018-0035-6
X. Zhao, S. Ning, W. Fu, et al., Adv. Mater. 30 (2018) 1802397. doi: 10.1002/adma.201802397
F. He, Y. Liu, Q. Cai, J. Zhao, New J. Chem. 44 (2020) 16135–16143. doi: 10.1039/D0NJ03645E
A. Mahmood, G. Lu, X. Wang, J. Power Sources 551 (2022) 232208. doi: 10.1016/j.jpowsour.2022.232208
Q. Fu, J. Han, X. Wang, et al., Adv. Mater. 33 (2021) 1907818. doi: 10.1002/adma.201907818
S. Ramaraj, D. Alves, C. Breslin, J. Electrochem. Soc. 169 (2022) 10402–10409.
L. Wang, L. Xie, W. Zhao, et al., Chem. Eng. J. 405 (2021) 127028. doi: 10.1016/j.cej.2020.127028
L. Wang, G. Zhou, H. Luo, et al., Appl. Catal. B 256 (2019) 117802. doi: 10.1016/j.apcatb.2019.117802
Y. Fu, Y. Shan, G. Zhou, et al., Joule 3 (2019) 2955–2967. doi: 10.1016/j.joule.2019.09.006
Q.Y. He, L. Wang, K. Yin, et al., Nanoscale Res. Lett. 13 (2018) 167. doi: 10.1186/s11671-018-2570-x
Y. Li, L. Wang, S. Zhang, et al., Catal. Sci. Technol. 7 (2017) 718–724. doi: 10.1039/C6CY02649D
C. Sun, M. Liu, L. Wang, et al., Chin. Chem. Lett. 33 (2022) 1779–1797. doi: 10.1016/j.cclet.2021.08.052
Q. Xiong, Y. Wang, P.F. Liu, Adv. Mater. (2018) e1801450.
K. Sathiyan, T. Mondal, P. Mukherjee, Nanoscale 14 (2022) 16148–16155. doi: 10.1039/D2NR03816A
X. Mu, Y. Zhu, X. Gu, J. Eng. Chem. 62 (2021) 546–551.
D.C. Nguyen, T.L. Luyen Doan, S. Prabhakaran, Nano Energy 82 (2021) 105750. doi: 10.1016/j.nanoen.2021.105750
M. Tang, W. Yin, S. Liu, et al., Crystals 12 (2022) 1218. doi: 10.3390/cryst12091218
Z. Sadighi, J. Liu, L. Zhao, Nanoscale 10 (2018) 22549–22559. doi: 10.1039/C8NR07106C
C. Feng, Z.P. Wu, K.W. Huang, et al., Adv. Mater. 34 (2022) 2200180. doi: 10.1002/adma.202200180
M. Mao, Z. Lin, Y. Tong, et al., ACS Nano 14 (2020) 1102–1110. doi: 10.1021/acsnano.9b08848
F. Xia, B. Li, Y. Liu, et al., Adv. Funct. Mater. 31 (2021) 2104716. doi: 10.1002/adfm.202104716
C. Liu, L. Wang, Y. Tang, et al., Appl. Catal. B 164 (2015) 1–9. doi: 10.1016/j.apcatb.2014.08.046
L. Wang, X. Duan, G. Wang, et al., Appl. Catal. B 186 (2016) 88–96. doi: 10.1016/j.apcatb.2015.12.056
J. Li, W. Yin, J. Pan, et al., Nano Res. 16 (2023) 8638–8654. doi: 10.1007/s12274-023-5610-5
K. Chen, L. Wang, Z. Luo, et al., Adv. Mater. Technol. 8 (2023) 2300189. doi: 10.1002/admt.202300189
J. Liu, J. Wang, B. Zhang, J. Mater. Chem. A 6 (2018) 2067–2072. doi: 10.1039/C7TA10048E
Y. Zhang, H. Guo, M. Song, Appl. Surf. Sci. 617 (2023) 156621. doi: 10.1016/j.apsusc.2023.156621
Y. Liu, Y. Chen, Y. Tian, Adv. Mater. 34 (2022) e2203615. doi: 10.1002/adma.202203615
Y. Li, Y. Hua, N. Sun, et al., Nano Res. 16 (2023) 8712–8728. doi: 10.1007/s12274-023-5716-9
W. Chen, J. Du, H. Zhang, et al., Chin. Chem. Lett. (2023) 109168.
A. Pandey, A. Mukherjee, S. Chakrabarty, ACS Appl. Mater. Interfaces 11 (2019) 42094–42103. doi: 10.1021/acsami.9b13358
Y. Yang, K. Zhang, H. Lin, ACS Catal. 7 (2017) 2357–2366. doi: 10.1021/acscatal.6b03192
C. Zhao, X. Zhang, S. Xu, Inter. J. Hydrogen Energy 47 (2022) 28859–28868. doi: 10.1016/j.ijhydene.2022.06.206
M. Zhao, G. Zhou, X. Liu, Inter. J. Electrochem. Sci. 16 (2021) 210323. doi: 10.20964/2021.03.46
W. Bao, Y. Li, J. Zhang, Int. J. Hydrogen Energy 48 (2023) 12176–12184. doi: 10.1016/j.ijhydene.2022.12.184
W.H. Huang, X.M. Li, X.F. Yang, Chem. Eng. J. 420 (2021) 127595. doi: 10.1016/j.cej.2020.127595
L. Wang, X. Liu, J. Luo, et al., Angew. Chem. Int. Ed. 56 (2017) 7610–7614. doi: 10.1002/anie.201703066
Y. Li, L. Wang, T. Cai, et al., Chem. Eng. J. 321 (2017) 366–374. doi: 10.1016/j.cej.2017.03.139
L. Wang, Q. Zhang, J. Zhu, et al., Energy Storage Mater. 16 (2019) 37–45. doi: 10.1016/j.ensm.2018.04.025
L.L. Wang, G. Zhou, H. Luo, et al., Appl. Catal. B 256 (2019) 117802. doi: 10.1016/j.apcatb.2019.117802
Y. Xu, L. Wang, X. Liu, et al., J. Mater. Chem. A 4 (2016) 16524–16530. doi: 10.1039/C6TA06534A
Q. Zhang, L. Wang, J. Wang, et al., J. Mater. Chem. A 6 (2018) 9411–9419. doi: 10.1039/C8TA00995C
Y. Tu, L. Xie, M. Zhang, et al., Nano Res. 17 (2024) 2088–2110. doi: 10.1007/s12274-023-5946-x
F. Wang, L. Xie, N. Sun, et al., Nano-Micro Lett. 16 (2024) 1–25. doi: 10.1007/s40820-023-01222-2
C. Wang, X. Shao, J. Pan, Appl. Catal. B: Environ. 268 (2020) 118435. doi: 10.1016/j.apcatb.2019.118435
C. Wei, C. Liu, L. Gao, J. Alloy. Compd. 796 (2019) 86–92. doi: 10.1016/j.jallcom.2019.05.071
Z.Y. Zhao, F.L. Li, Q. Shao, Adv. Mater. Interfaces 6 (2019) 1900372. doi: 10.1002/admi.201900372
M.A.R. Anjum, H.Y. Jeong, M.H. Lee, et al., Adv. Mater. 30 (2018) 1707105. doi: 10.1002/adma.201707105
J.Z. Chen, G.G. Liu, Y.Z. Zhu, et al., J. Am. Chem. Soc. 142 (2020) 7161–7167. doi: 10.1021/jacs.0c01649
Y.Q. Li, Z.H. Yin, M. Cui, et al., J. Mater. Chem. A 9 (2021) 2070–2092. doi: 10.1039/D0TA10815D
Z. Liang, Y. Xue, X. Wang, et al., Chem. Eng. J. 421 (2021) 130016. doi: 10.1016/j.cej.2021.130016
S. Geng, F. Tian, M. Li, et al., Nano Res. 15 (2022) 1809–1816. doi: 10.1007/s12274-021-3755-7
T. Sun, Z. Tang, W. Zang, Nat. Nanotechnol. 18 (2023) 763–771. doi: 10.1038/s41565-023-01407-1
X. Liu, J. Pan, H. Huang, et al., Chem. Eng. J. 476 (2023) 146868. doi: 10.1016/j.cej.2023.146868
J. Zhou, M. Guo, L. Wang, et al., Chem. Eng. J. 366 (2019) 163–171. doi: 10.1016/j.cej.2019.02.079
W. Yin, Y. Cai, L. Wang, et al., Nano Res. 16 (2023) 4381–4398. doi: 10.1007/s12274-022-5133-5
Y. Li, B. Yu, B. Liu, et al., Chem. Eng. J. 452 (2023) 139542. doi: 10.1016/j.cej.2022.139542
M. Li, W. Yin, J. Pan, et al., Chem. Eng. J. 471 (2023) 144691. doi: 10.1016/j.cej.2023.144691
L. Xie, L. Wang, X. Liu, et al., Angew. Chem. Int. Ed. 63 (2024) e202316306. doi: 10.1002/anie.202316306

Figure 2 (a) The synthesis of MSQDs. (b, c) TEM images of MSQDs. The illustration in figure (b) is the electron diffraction patterns of MSQDs. The illustration in figure (c) is a histogram of the size distribution of synthesized MSQDs. (d) TOF plot of IrO2/C, MSQDs-AC, MSQDs and MoS2. (e) TOF values of IrO2/C, MSQDs-AC, MSQDs and MoS2 at different overpotential. (f) Overpotential versus time curves of MSQDs-AC modified electrode at current density of 10 mA/cm2. (g) Free energy distribution of OER on vertex, edge and surface of MSQDs with Mo-edge and half/full S coverage. Reprinted with permission [59]. Copyright 2018, American Chemical Society.

Figure 3 (a, b) Adsorption of single and multiple water molecules on Mov+2S_up (Mo vacancy on MoS2). (c) Adsorption energy of per water molecule on clean and defective WS2/MoS2 vdW heterojunctions. Mov: Mo vacancy; MSv_up: the S vacancy at the top MoS2 layer; MS2v_up: two S vacancies (closer) at the top MoS2 layer; 2Wv: two W vacancies; Free energy of the OER pathways for (d) clean (no vacancy) and (e) Mo vacancy of WS2/MoS2 vdW heterojunctions. Reprinted with permission [69]. Copyright 2022, Elsevier B.V.

Figure 4 (a) TEM images of Co-MoS2/BCCF-21. (b) The optimized stable structure of Co covalently doped MoS2 with a Mo/Co ratio of 8:1 (green, yellow, and blue balls represent Mo, S, Co respectively). (c) The DOS of 3d Co and 3p S states. (d) Normalized Co K-edge XANES spectra. (e) Co K-edge k2-weighted EXAFS spectra of Co-MoS2/BCCF-21, Co foil, Co3O4, and CoS. (f) Mo K-edge k2-weighted EXAFS spectra of MoS2/BCCF and Co-MoS2/BCCF-21. (g) Polarization curves obtained at 5.0 mV/s in 1.0 mol/L KOH. (h) The Co K-edge k2-weighted EXAFS spectra and (i) Mo K-edge k2-weighted EXAFS spectra of Co-MoS2/BCCF-21 before and after HER and OER in 1.0 mol/L KOH. Reprinted with permission [78]. Copyright 2018, Wiley-VCH Verlag GmbH & Co. KGaA, Weinheim.

Figure 5 (a) Polarization curves (1.0 mol/L KOH solution, scan rate of 5 mV/s). (b) PDOS plot for d-orbitals of Mo. (c) PDOS plot for p orbitalsof S. Reprinted with permission [79]. Copyright 2022, The Royal Society of Chemistry. (d) HAADF image (e)HRTEM image of AlCo3-MoS2 NSs. (f) Polarization curves of AlCo3-MoS2 and its related materials and RuO2. Reprinted with permission [80]. Copyright 2021, Science Press and Dalian Institute of Chemical Physics, Chinese Academy of Sciences. (g) SEM images of the Co, Nb-MoS2/TiO2 HSs. (h) TEM images of the Co, Nb-MoS2/TiO2 HSs. (i) Polarization curves obtained at a scan rate of 5 mV/s in 1.0 mol/L KOH electrolyte. Reprinted with permission [81]. Copyright 2021, Elsevier Ltd.

Figure 6 (a) Synthetic procedure of 2D 1T-MoS2 nanosheets. (b) Statistical analysis of thickness distribution of 1T-MoS2. (c) HRTEM of 1T-MoS2, arranged in a triangular pattern (blue, yellow balls represent Mo, S respectively). (d) HRTEM image of the 1T-MoS2 edge (e) Comparison of the RS for 1T- and 2H-MoS2 (inset in d: E2g1 and A1g peak shifts). XPS spectra of (f) Mo 3d and (g) S 2p. (h) Polarization curves. Reprinted with permission [83]. Copyright 2018, The Royal Society of Chemistry.

Figure 7 (a) The synthesis process of heterostructured MoS2-Ni3S2 HNRs/NF Composites. AHM refers to ammonium heptamolybdate tetrahydrate and NF nickel foam. Reprinted with permission [90]. Copyright 2017, American Chemical Society. (b) The HER and OER process on Co3O4@MoS2 interface structures. Reprinted with permission [91]. Copyright 2017, The Royal Society of Chemistry. (c) The synthesis process of the CoS2/MoS2/Ni3S2/NF electrode. Reprinted with permission [92]. Copyright 2023, Elsevier B.V. (d) MoS2/NiPS3 heterostructure model. (e) The synthetic scheme of MoS2/NiPS3 heterostructure. Reprinted with permission [93]. Copyright 2022, Wiley-VCH GmbH.

Figure 8 (a) The hydrothermal synthesis of M1/MoS2 SASCs under acidic conditions. (b) Magnetization curves (M-H) of ferromagnetic Ni1/MoS2 with different Ni contents at 300 K. (c) Linear scan voltammetry curves of Ni1/MoS2 under different magnetic fields. The illustration shows photo images of Ni1/MoS2 as OER catalysts under 1.65 V magnetic field without (left) and (right) magnetic fields. (d) Overpotentials and Tafel slopes of Ni1/MoS2 (14:100) at current density of 40 mA/cm2. (e) Free energy distribution of OER on ferromagnetic and antiferromagnetic Ni1/MoS2 and the corresponding adsorption configurations of reaction intermediates. (f) Projected density of states of S1 (an adjacent S atom with a Ni-S bond length of 2.521 Å) and S2 (an adjacent S atom with a Ni-S bond length of 2.285 Å) atoms of Ni1/MoS2 models consisting of two adjacent NiMo sites with ferromagnetic (FM) and antiferromagnetic (AFM). Reprinted with permission [118]. Copyright 2023, The Author(s).

Figure 9 (a) Lattice structure images (side view) of monolayer MoS2 (top) and Co@MoS2 (bottom). (b) HAADF-STEM image of Co@MoS2. (c) HAADF intensity in the experimental STEM image and the simulated STEM image. (d) DOS results of MoS2. (e) DOS results of Co@MoS2. (f) Schematic diagram of spin-polarized Co@MoS2 under a magnetic field showing parallel spin arrangement of O atoms and its application in electrocatalytic OER process. (g) Free energy of OER on MoS2 and Co@MoS2 at U = 0 V. (h) Polarization curves of Co@MoS2 in different directions of magnetic field and without magnetic field. (i) Polarization curves of MoS2, IrO2, and Co@MoS2 with and without AMF. Reprinted with permission [53]. Copyright 2022, American Chemical Society.

 扫一扫看文章

扫一扫关注我们
 DownLoad:

 下载:
下载: