Received Date:
11 October 2023 Accepted Date:
03 January 2024 Revised Date:
22 November 2023 Available Online:
15 November 2024
Abstract:
Zeolitic imidazolate frameworks (ZIFs) are a series of materials composited by metal ions and organic ligands with high specific surface area, which might be great precursors to produce metal oxides by calcination for gas sensor application. However, Zn-ZIF (ZIF-8) is hard to transform as ZnO in air and keeping the unique framework simultaneously. In this work, Fe2+ was introduced into the metal node to replace a part of Zn2+ ions, and it could be oxidized as Fe3+ in the calcination to facilitate the oxidation process of the 2-methylimdazole ligands to give Fe-ZnO complex shell with high specific surface area (108 m2/g) and abundant oxygen vacancies (48%). The micro electro mechanical systems (MEMS) sensor based on the 6%-Fe-ZnO complex shell performed outstanding gas sensing properties to the low-concentration acetone vapor, including high response (ΔR/Rg = 11.2 to 5 ppm acetone), superior selectivity (Sacetone/Sethanol = 5.6) and fast response speed (τres = 2.6 s). This work not only provided the research of an exceptional acetone MEMS sensor, but also induced a strategy to produce metal oxide derived from ZIFs with complex structures for the universal synthesis methodology.
Gas sensors have made a significant contribution in monitoring air quality, eliminating fire hazards and detecting human diseases, and are vital for the advance of the Internet of things as well as artificial intelligence technology [1–4]. According to the consensus of the scientific research community, the gas sensing performances of coating materials mainly depend on three crucial aspects: Large specific surface area for gas adsorption-desorption [5], appropriate bandgap for sensor work [6] and suitable surface activity for redox reactions [7]. Zinc oxide (ZnO) is one of the most significant sensing materials applied in gas sensors, which has been researched in science community extensively and utilized in the industrial manufacture practically [8–11]. ZIFs, especially ZIF-8 and ZIF-67, are the frequently-used precursors in catalysis [12], electrochemistry [13] and gas separation [14] due to their catalytic node, large surface area and high stability in practical use. The advantages seem matched with the requirements of gas sensors, nevertheless, the insulating properties of ZIFs limit their applications in resistance-based gas sensors.
To utilize the advantages of ZIF-8 and ZIF-67, electrochemistry researchers have taken different strategies to yield the metal and nitrogen doped carbon by annealing the precursors at high temperature under inert atmosphere [15,16]. However, to obtain metal oxide with high specific surface area is still a challenge for gas sensor researchers. Zhang et al. and Lee Group employed ZIF-67 as the precursor to produce Co3O4 for gas sensors [17]. Yang's team employed silver nanoparticles to functionalize ZIF-8 to obtain ZnO-based ethanol gas sensors [18]. Cheng et al. used Sn2+ to dope ZIF-8 to produce SnO2-ZnO heterojunction for acetone sensors [19]. Although these methods provide possible strategies to produce metal oxides, the process to oxidize ZIF-8 and keeping the frameworks simultaneously is still difficult due to the extreme weak oxidability of zinc ion.
In this work, a small amount of Fe2+ was used to replace a part of Zn2+ nodes in the ZIF-8 frameworks. And the annealing process of Fe-ZIF-8 made Fe2+ evolve to Fe3+, which could catalyze the organic ligands for removing them from the system to obtain Fe-ZnO samples. Due to the oxidability of Fe3+, the Fe-ZIF-8 could be oxidized completely at relative low temperature while pristine ZIF-8 needs higher temperature to finish the transformation from insulator to semiconductor metal oxides, which can be proved by the characterization information. The MEMS sensor based on 6%-Fe-ZnO performed reliably to low-concentration acetone vapor with high sensitivity (ΔR/Rg = 11.2 to 5 ppm acetone), selectivity (Sacetone/Sethanol = 5.6) and fast response (τres = 2.6 s). This work not only developed the acetone sensor for practical use, but also provide a methodology to assist metal organic frameworks to produce metal oxides in other application fields.
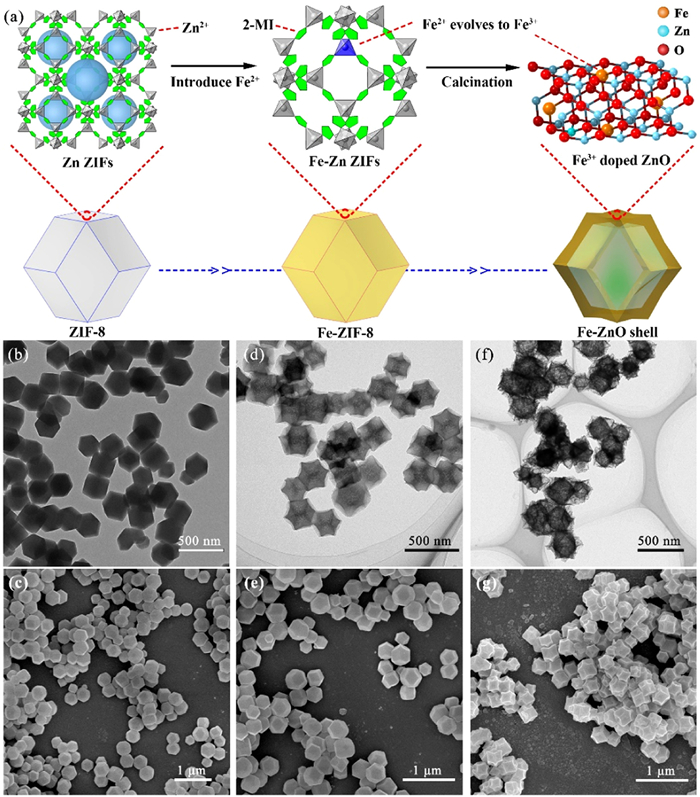
As shown in Fig. 1a, ZIF-8 was synthesized by a facile wet chemistry method in methanol solvent. The zinc ions (Zn2+) and 2-methylimidazole (C4H6N2) conducted a coordination reaction to give ZIF-8 (ZnC8H12N4) at room temperature (Eq. 1). Due to the same positive charge and similar ion diameter, Zn2+ could be replaced by Fe2+ readily in a small amount to produce Fe-ZIF-8 (Eq. 2). During the calcination process in air, Fe2+ would be easily oxidized to Fe3+. Due to that the essence of ZIFs annealing in air is to remove organic ligands to obtain metal oxides, the presence of Fe3+ plays a key role in accelerating the progression to yield Fe(III)-ZnO shell (Eqs. 3 and 4).
(1)
(2)
(3)
(4)
Figure 1
Figure 1.
(a) Diagrammatical illustration of complex shell Fe-ZnO synthesis routine. (b) TEM and (c) SEM images of pure ZIF-8. (d) TEM and (e) SEM images of pristine ZIF-8 heated at 400 ℃ in air for 2 h. (f) TEM and (g) SEM images of 6%-Fe-ZIF-8 heated at 400 ℃ in air for 2 h.
The morphology of ZIF-8 is the solid frameworks coordinated from Zn2+ and 2-methylimidazole with rhombic dodecahedron (Figs. 1b and c) and porous microstructures (Fig. S1a in Supporting information). Due to the high stability, ZIF-8 is not easy to be oxidized in air by annealing. There was only a small part oxidized by heating ZIF-8 in air at 400 ℃ and keeping the same appearance to the pristine ZIF-8 without calcination treatment (Figs. 1d and e). When Fe2+ was introduced into the ZIF-8 frameworks to replace some Zn2+ ions, the product of calcination treatment changed completely. The inner part changed from solid to shell structure and the out shape shrunk (Figs. 1f and g). As comparison, transforming ZIF-8 completely in air needs higher temperature, and the morphology of ZnO calcined from ZIF-8 at 800 ℃ is mainly agglomerated nanoparticle (Fig. S1b in Supporting information). Additionally, lower or higher Fe2+ doping amounts would not give the unique and intact architecture (Figs. S1c and d in Supporting information). The optical photo of MEMS sensor with 6%-Fe-ZnO (FZO-6) coating is shown in Fig. S2a (Supporting information), the coating area is flat square with the area about 0.04 mm2. HRTEM image is necessary to observe the lattice distance of FZO-6 around 0.25 nm that matches the crystal plane (101) of ZnO very well (Fig. S2b in Supporting information). And the EDX mapping provides the elements distribution information (Figs. S2c–e in Supporting information), indicating a uniform Fe element doping.
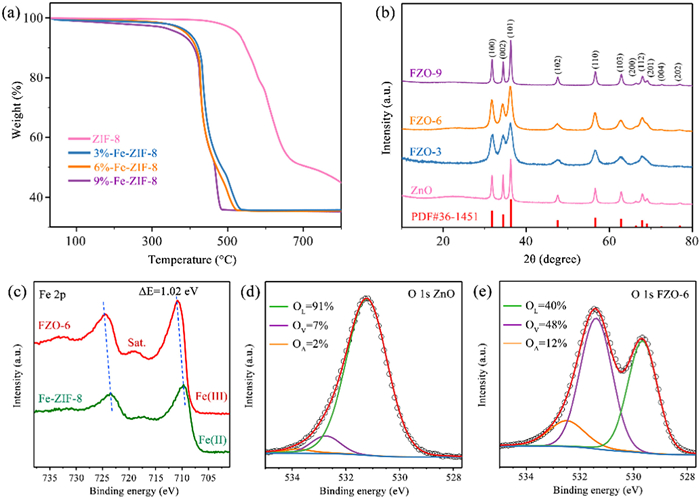
Thermogravimetric analysis confirmed the degree of difficulty of the oxidation process (Fig. 2a). The curves show that the bare ZIF-8 needs higher temperatures to be oxidized while the existence of Fe ions could help lower the decomposition temperatures strikingly.
Figure 2
Figure 2.
(a) Thermogravimetry analysis of ZIF-8 and three Fe-ZIF-8 samples. (b) Powder XRD patterns of ZnO and three Fe-ZnO samples (FZO). (c) XPS Fe 2p information of Fe-ZIF-8 and FZO-6. XPS O 1s fitting curves of (d) ZnO and (e) FZO-6.
Simulated XRD pattern of standard ZIF-8 model (Fig. S3a in Supporting information) has consistence with the signal of the synthesized ZIF-8 (Fig. S3b in Supporting information) perfectly, proving the essence of the ZIF-8 sample. However, the calcined ZIF-8 at 400 ℃ only matches part of XRD peaks (Fig. S3c in Supporting information), indicating that some inner microstructures were broken, but the whole frameworks were remained. This result is consistent with the TEM and SEM images of ZIF-8 heated at 400 ℃, confirming that ZIF-8 cannot be transformed to ZnO at relative low calcination temperature. XRD patterns of calcined metal oxides are shown in Fig. 2b, these featured peaks are indexed to a standard card (PDF#36-1451) perfectly, suggesting the formation of hexagonal ZnO. And no obvious signals belonging to Fe element or related oxides, because the doping amount of Fe element was small enough, the lattices of ZnO were few affected. Therefore, the ICP-OES equipment was employed to explore the existence of iron element (Table 1). The Fe contents of three doped-ZnO were 3.05±0.12, 6.10±0.08 and 8.95±0.10, which was the source of sample naming rule.
Table 1
Table 1.
The Fe element ICP-OES information of the doped ZnO.
The gas sensing properties are affected by the surface status of elements, and XPS can be utilized to determine the element valence state [20]. The carbon and nitrogen status of ZIF-8 did not change obviously after Fe2+ doping (Fig. S4 in Supporting information). There was a 0.5 eV energy difference between Zn ZIFs and Zn oxides, due to that the binding energy of Zn from Zn-O is higher than Zn-N slightly (Fig. S5 in Supporting information) [21]. During the oxidation process of Fe-ZIF-8 to produce FZO-6, the Fe valance changed apparently (Fig. 2c). The binding energy of Fe 2p signal from FZO-6 is 1.02 eV higher than that from Fe-ZIF-8, and combining with the obvious satellite peaks to confirm the Fe element of FZO-6 is Fe3+ while the Fe-ZIF-8 is Fe2+. XPS signals of surface oxygen are crucial for gas sensing reactions, due to the sites of adsorption and activity related to sensing reactions tightly [22]. There are mainly three kinds of oxygen status existing on the surface of metal oxide, lattice oxygen (OL), defective oxygen (OV) and adsorbed oxygen (OA), especially the ratio of OV and OA determines the surface activity [23]. The XPS O 1s fitting peaks of ZnO (Fig. 2d) mainly contain OL part while there are relatively bigger ratios of OV and OA on the surface of FZO-6 (Fig. 2e). When we compare the OV peaks, there is only 7% for bare ZnO while it is as high as 48% for FZO-6. As the OA percentage, the number of FZO-6 is 12%, that is 6 times higher than bare ZnO. Considering the importance of OV and OA, we may give the conclusion that the surface of FZO-6 has higher gas sensing potential, due to that the oxidation process of organic ligands could bring out part of oxygen atoms, leaving abundant vacancies. However, the calcination of ZIF-8 needs higher temperature, the oxygen vacancies may be recombined with the oxygen molecules from air [24].
Gas sensing reactions are strongly related to the gas adsorption step. Hence, the specific surface area of nanomaterials is very crucial for gas sensing performances [25]. As shown in Fig. S6 (Supporting information), there are obvious IV-type hysteresis loops observed from the N2 adsorption-desorption curve of the full samples, the integral areas of FZO-3 and FZO-6 are bigger than pristine ZnO and FZO-9, the BET specific surface areas were calculated as 72, 94, 108 and 78 m2/g, respectively, indicating that the FZO-6 owns better adsorption capacity.
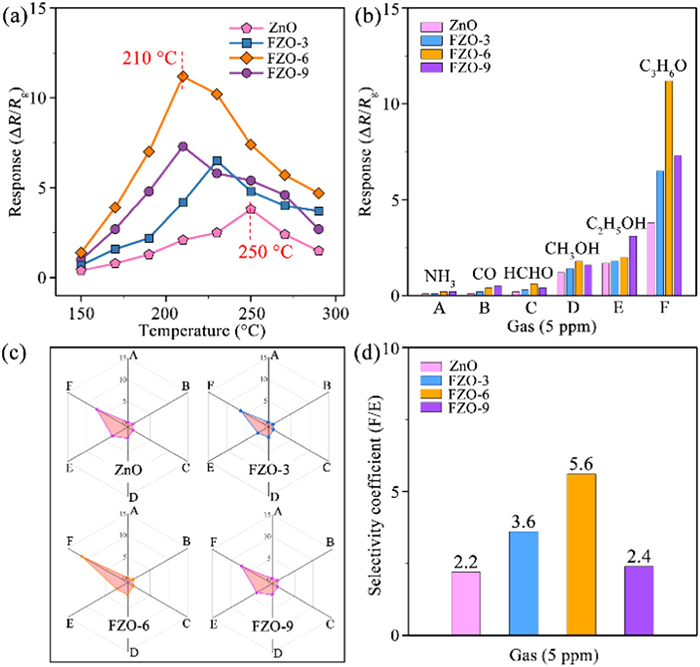
After kept aging at 200 ℃ for 7 days, four kinds of sensors based on ZnO, FZO-3, FZO-6 and FZO-9 were installed into the testing chamber. As we know, the gas sensing properties of metal oxide semiconductor-based sensors depend on the working temperatures because appropriate temperatures could excite semiconductor to yield suitable charge carriers, balance the adsorption-desorption process and provide activating energy for redox reactions [26]. Hence, gas sensors need an optimal working temperature to achieve the best performances. The gas sensing tests for 5 ppm acetone at different temperatures are shown in Fig. 3a. It is found that the suitable working temperature of ZnO-based sensor is 250 ℃ which is clearly higher than 230 ℃ of FZO-3 and 210 ℃ of FZO-6 and FZO-9. This is on account of that the charge carrier in Fe-doped ZnO is easier to excite when we compare with the pristine ZnO. In this process, Fe3+ is also a kind of catalytic site to assist ZnO shell for gas sensing reactions and dopant has its optimal amount [27,28]. Hence, the response value (ΔR/Rg = 11.2) of FZO-6 to 5 ppm acetone vapor is significantly higher than other counterparts.
Figure 3
Figure 3.
(a) Response values to 5 ppm acetone at different working temperatures, (b) selectivity tests to 5 ppm different gases, (c) radar plots transformed from selectivity bar charts, and (d) selectivity coefficient summary of ZnO, FZO-3, FZO-6 and FZO-9 based MEMS sensors. (The default working temperature was 250 ℃ for ZnO, 230 ℃ for FZO-3, 210 ℃ for FZO-6 and FZO-9. The default humidity was 30% RH).
In order to determine whether the sensors have gas selectivity, six kinds of gases or vapors with same concentration (5 ppm) were tested for comparison (Fig. 3b). It is found that acetone owns the best response performance among these four sensors. Notably that ethanol is common active sensing species but succumbed to acetone in this work. To observe the selectivity properties better, the response values to 5 ppm different gases or vapors were transformed as radar plots (Fig. 3c). The integral images show that the tendency to acetone of FZO-6 is the strongest among these four MEMS sensors. The ratios between acetone and ethanol response values are summarized as the selectivity coefficient that could be used to measure the selectivity quantitively (Fig. 3d), the selectivity coefficient of FZO-6 is 5.6 which is obviously surpassing other counterparts, implying a stronger inclination in the practical applications.
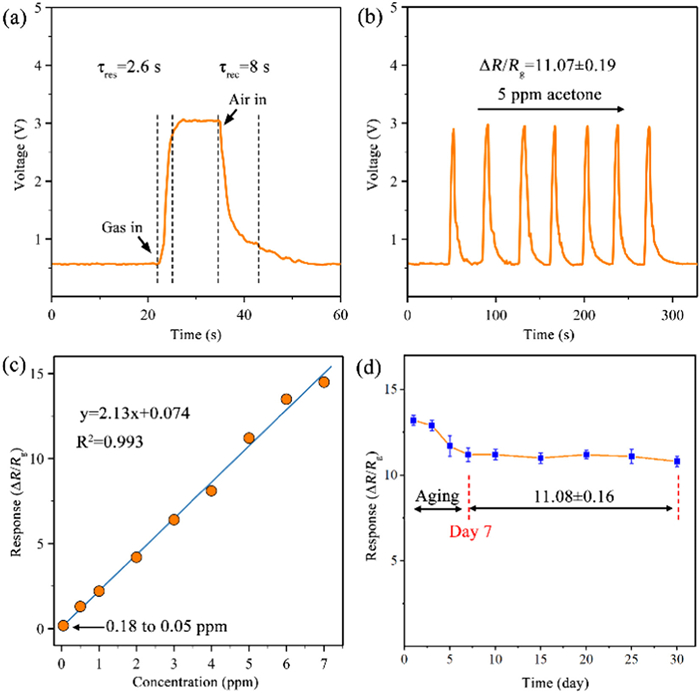
After screening the basic gas sensing properties, the FZO-6 based MEMS sensor was selected to accept full gas sensing tests. Fast response is crucial for the warning system to save lives in some special workplaces, such as factory floor, production line and mine [29,30]. The response voltage vs. time curve of FZO-6 sensor is shown in Fig. 4a. The response time (τres = 2.6 s) and the recovery time (τrec = 8 s) proved the fast response and recovery performance, which is swift enough for the practical application. The stability properties decide whether the industrial potential of gas sensors. Reproducibility is also vital criterion for assessing the performance of gas sensors, which marks the credibility of the data [31]. As shown in Fig. 4b, seven repeated testing cycles under 5 ppm acetone vapor indicate essentially identical baselines and sensing response values (ΔR/Rg = 11.07±0.19). The relationship between acetone vapor concentration and response value of gas sensor is displayed in Fig. 4c. The transformed data give a plot that relationship between the response value 'y' and the concentration of acetone vapor 'x' can be conveyed as y = 2.13x + 0.074 with great linearity (R2 = 0.993), and the detection limit was 0.05 ppm acetone with response value 0.18.
Figure 4
Figure 4.
(a) Response curve to 5 ppm acetone vapor, (b) Cyclic stability tests of FZO-6 to 5 ppm acetone vapor, (c) The relationship between acetone vapor concentration and response value of FZO-6 gas sensor, and (d) Long-term stability tests of FZO-6 to 5 ppm acetone vapor (T = 210 ℃, RH = 30%).
Additionally, the gas sensing tests in different humidity from 30 to 90 RH% are shown in Fig. S7 (Supporting information). In the range from 30% to 60% RH, no obvious response decreases to 5 ppm acetone. The semiconductor devices need the aging treatments to pass the unstable time [32], from the first day to manufacture the FZO-6 MEMS sensor to the seventh day to collect data abundantly, there was a term with obvious sensing value decreases (Fig. 4d). We may find that the stable term from the seventh day to thirtieth day, the fluctuation was quite small (ΔR/Rg = 11.08±0.16), which shows a great long-term stability of FZO-6 sensor.
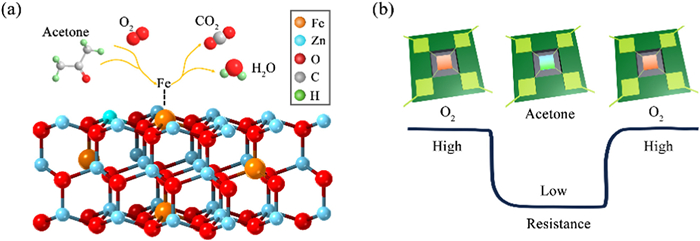
The crystal structure of Fe-ZnO and the sensing reaction process are shown in Fig. 5a. Its typical sensing reaction includes three steps [33]. Firstly, O2 molecules adsorbed on the surface could extract electrons from conduction band to form chemisorbed oxygen ions (Eq. 5). After exposure to acetone molecules, the ionized oxygen would react with adsorbed acetone (Eq. 6). Finally, the products of the reaction desorbed from the surface of sensing materials.
(5)
(6)
Figure 5
Figure 5.
(a) Reaction illustration of FZO-6 for acetone sensing. (b) The mechanism of the yielded gas sensing signal.
During the sensing reactions, the responses come from the resistance change of semiconductor materials (Fig. 5b). When the materials expose to air, O2 molecules will be adsorbed to cause a lower electron carrier density and higher resistance. The oxygen ions will release electrons back to the sensing material when introduction of the target acetone molecules, hence, the resistance becomes lower and then collected by the electronic devices as sensing response. In this work, the superior gas sensing performances of Fe-ZnO sensor depend on the advantages combination of high specific surface area offered by the complex shell structure, large ratio of surface oxygen vacancies and the catalytic function from Fe3+ [34].
In summary, acetone gas sensors were fabricated based on Fe-ZnO with complex shell structure derived from Fe-ZIF-8. Of which the doped Fe2+ could evolve to Fe3+ and played a key role in accelerating the oxidation process of ZIF-8 at the relatively low temperature to keep complicated morphology and high surface activity. This work demonstrates a new synthesis method to utilize ZIFs to produce metal oxide with complex structures, which may open an avenue for further applications and other research fields.
Declaration of competing interest
The authors declare that they have no known competing financial interests or personal relationships that could have appeared to influence the work reported in this paper.
Acknowledgments
This work is supported by the National Natural Science Foundation of China (No. 62271299) and Shanghai Engineering Research Center for Integrated Circuits and Advanced Display Materials.
Supplementary materials
Supplementary material associated with this article can be found, in the online version, at doi:10.1016/j.cclet.2024.109490.
[1]
Y.M. Jo, Y.K. Jo, J.H. Lee, et al., Adv. Mater. (2022) 2206842.
[2]
K.G. Krishna, S. Parne, N. Pothukanuri, et al., Sens. Actuator. A: Phys. 341 (2022) 113578. doi: 10.1016/j.sna.2022.113578
Figure 1
(a) Diagrammatical illustration of complex shell Fe-ZnO synthesis routine. (b) TEM and (c) SEM images of pure ZIF-8. (d) TEM and (e) SEM images of pristine ZIF-8 heated at 400 ℃ in air for 2 h. (f) TEM and (g) SEM images of 6%-Fe-ZIF-8 heated at 400 ℃ in air for 2 h.
Figure 2
(a) Thermogravimetry analysis of ZIF-8 and three Fe-ZIF-8 samples. (b) Powder XRD patterns of ZnO and three Fe-ZnO samples (FZO). (c) XPS Fe 2p information of Fe-ZIF-8 and FZO-6. XPS O 1s fitting curves of (d) ZnO and (e) FZO-6.
Figure 3
(a) Response values to 5 ppm acetone at different working temperatures, (b) selectivity tests to 5 ppm different gases, (c) radar plots transformed from selectivity bar charts, and (d) selectivity coefficient summary of ZnO, FZO-3, FZO-6 and FZO-9 based MEMS sensors. (The default working temperature was 250 ℃ for ZnO, 230 ℃ for FZO-3, 210 ℃ for FZO-6 and FZO-9. The default humidity was 30% RH).
Figure 4
(a) Response curve to 5 ppm acetone vapor, (b) Cyclic stability tests of FZO-6 to 5 ppm acetone vapor, (c) The relationship between acetone vapor concentration and response value of FZO-6 gas sensor, and (d) Long-term stability tests of FZO-6 to 5 ppm acetone vapor (T = 210 ℃, RH = 30%).

 DownLoad:


 下载:
下载:


