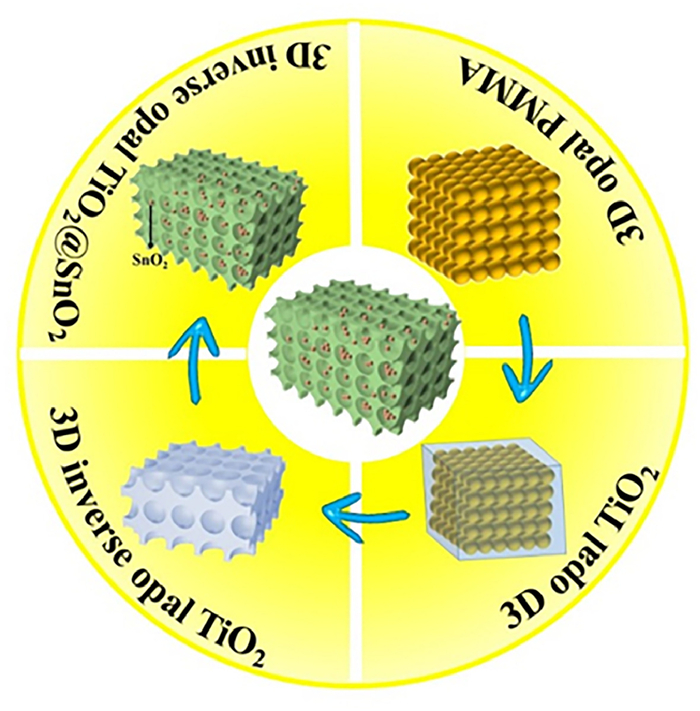
Figure 1.
Preparation process diagram of IO-TS composite material.
Facile synthesis of porous TiO2/SnO2 nanocomposite as lithium ion battery anode with enhanced cycling stability via nanoconfinement effect
Xingang Kong , Yabei Su , Cuijuan Xing , Weijie Cheng , Jianfeng Huang , Lifeng Zhang , Haibo Ouyang , Qi Feng

The three-dimensional porous structure of inverse opal TiO2/SnO2 not only achieves excellent Li+ storage mechanism by introducing pseudocapacitance, but also enhances its electrochemical kinetics via providing many fast channels for Li+ and e−.
Since SONY released the first commercial lithium-ion battery in 1990 [1], lithium-ion batteries (LIBs) have developed rapidly and are widely used in people's daily life including mobile phones, laptops, electric cars and aerospace [2–4]. Traditional LIBs usually use graphite materials as the anode electrode due to their low cost, environmental friendliness, and good electrical conductivity [5,6]. However, the theoretical capacity of graphite anode materials are only 370 mAh/g and there are safety problems such as the generation of lithium dendrites due to its low working potential (≈ 0 V vs. Li/Li+) [7–9]. With the continuous increase of people's demand for electricity and the vigorous development of pure electric vehicles, graphite anodes gradually fail to meet the demand of high energy density, high security, and high capacity [10,11]. Therefore, it is necessary to find an alternative anode.
SnO2-based anode materials have attracted the attention of many researchers in recent years due to their extremely high theoretical capacity (790 mAh/g) [12–14]. Liu et al. [15] prepared SnO2 hollow spheres by self-assembled from nanosheets, which showed a reversible capacity of 607.2 mAh/g. Xu et al. [16] prepared uniform SnO2 nanotubes with a mesoporous shell by a hard templates and it exhibited a reversible capacity of 513 mAh/g. However, the SnO2-based anode materials have obvious volume expansion during charging and discharging process, which leads to pulverization of electrode material and short battery life, thus limiting its further application. To solve this problem, nanoconfinement treatment is an effective solution to significantly improve its cycling stability, capacity retention rate and cycling life [17–19].
Nanoconfinenment is achieved by encapsulating or limiting the nanospace in part or in whole. In addition, in the process of nanoconfined synthesis, the nanoconfined space can not only control the shape and size of the product, but also provide a specific environment for the nucleation, growth and stability of the product. Since nanopores are one of the most common nanoconfined spaces, it is clear that the synthesis of porous structural materials such as graphene gels, organometallic frames, and porous organic polymers is a suitable method for creating nanoconfined spaces [20–22]. Ma et al. synthesized porous SnO2/rGO xerogel as anode materials, which relieved the volume expansion of SnO2 and increased the cycling stability [23].
TiO2 has higher strength, negligible volume change and can provide a certain reversible capacity in the charging-discharging process, which is considered an ideal alternative material as the nanoconfinement materials [24–26]. In recent years, porous TiO2 has been applied as framework materials for LIBs [27,28]. This special structure is interconnected, allowing electrons and ions to diffuse through adjacent pores, promoting electrolyte infiltration and improving electrical conductivity. For example, Liang et al. synthesized inverse opal TiO2-X/Sulfur composite as Li-S cathode, which achieved long cycling life and high capacity [29]. Therefore, if it is used as the nanoconfinement material for SnO2, not only the volume expansion problem can be effectively solved, but also the electrochemical kinetics of the electrode can be improved.
Herein, inverse opal TiO2/SnO2 (IO-TS) complex were synthesized as the LIBs anode. With the three-dimensional interconnected inverse opal TiO2 as the nanoconfinement material, SnO2 nanoparticles were successfully filled into its porous network. Due to this superior microstructure, the following enhanced electrochemical properties are achieved: (1) Its rate performance and cycling stability was effectively improved after TiO2 nanoconfining treatment; (2) The volume expansion phenomenon of SnO2 was obviously reduced during the charging-discharging process; (3) Due to its three-dimensional porous microstructure, pseudocapacitance was introduced, thus guaranteeing its reversible capacity to a certain extent; (4) In terms of electrochemical kinetics, its interconnected microstructure significantly reduces its charge transfer resistance and greatly increases the diffusion rate of LIBs. In this work, the TiO2/SnO2 composite showed enhanced electrochemical performance and provided a new research idea for the further popularization of SnO2-based anode materials.
TiO2 sol was obtained by sol-gel method mentioned in the literature [30]. Then the poly methyl methacrylate (PMMA was prepared according to the literature method, details are shown in Fig. S1 in Supporting information) was filtered to obtain the opal template, and the TiO2 sol was filtered to make the TiO2 fully filled. The above steps were repeated for many times, and then heat treated at 500 ℃ for 3 h to obtain inverse opal TiO2, which was denoted as IO-TiO2. Inverse opal TiO2 was filtered with 5 mmol/L SnCl4 ethanol solution, and then filtered with ammonia. The above steps were repeated for different times, and the obtained samples were recorded as IO-TS-1, IO-TS-2 and IO-TS-3, respectively. Finally, inverse opal TiO2/SnO2 was obtained by heat treatment at 500 ℃ for 3 h. By calculating the mass of samples before and after loading, the content of SnO2 in IO-TS-2 is 23.57%, that in IO-TS-1 and IO-TS-3 are 9.42% and 37.14%. The concentration values C for electrodes determined are shown in Fig. S2 (Supporting information), respectively. The IO-TS preparation process is shown in Fig. 1. The details of characterization, preparation of the electrode, and electrical measurement are provided in Supporting information.
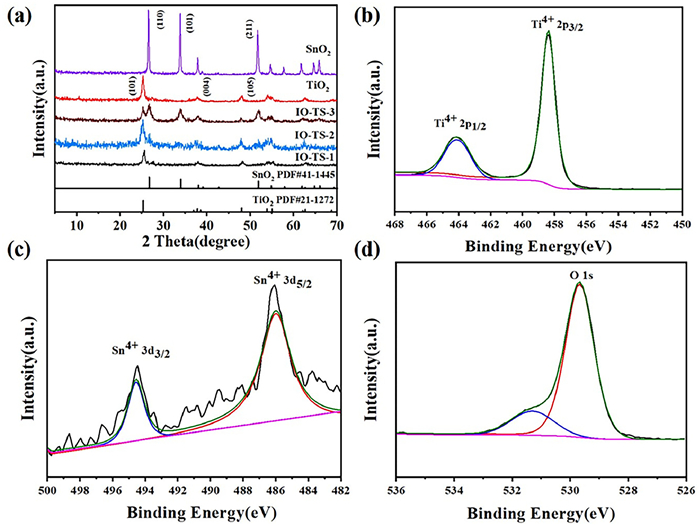
The crystal structures of IO-TiO2, pure phase SnO2 and IO-TS are shown in Fig. 2. It can be found that the XRD pattern of IO-TS shows the characteristic peaks of typical anatase TiO2 (JCPDS card No. 21–1272) and rutile-type SnO2 (JCPDS card No. 41–1445) [31,32]. All these three IO-TS samples show the phases of anatase TiO2 and rutile-type SnO2 without other impurity. The chemical composition and element chemical states of the composites were further confirmed by XPS (Figs. 2b–d). The high-resolution spectrum of Ti of IO-TS-2 presents two species: Ti 2p1/2 (464.3 eV) and Ti 2p3/2 (464.3 eV) which are in tune with anatase TiO2. And the binding energy of Sn 3d5/2 (486.7 eV) and Sn 3d3/2 (495.3 eV) are in accordance with SnO2. Moreover, O1s spectrum was deconvoluted into two peaks at 531.4 and 529.8 eV, belonging to chemisorbed oxygen crystal lattice oxygen, respectively (Fig. 2d) [33,34]. The overall XPS spectrum and high-resolution XPS spectra of the other two IO-TS samples for Ti, Sn and O elements are shown in Fig. S3 (Supporting information). All these results indicate that three IO-TS samples exhibit the phase of TiO2/SnO2 complex and are in good agreement with the XRD results.
The SEM images of IO-TiO2, SnO2 and IO-TS-2 are displayed in Fig. 3. The initial morphologies of monodisperse colloidal microspheres PMMA are given in Fig. S4 (Supporting information). As shown in Fig. 3a, due to PMMA (Fig. S4) was used as the substrate, the obtained IO-TiO2 has an ordered interconnected macropore structure, showing a three-dimensional porous framework connected by highly ordered nanoporous channels, which could provide many load sites for SnO2. SnO2 was used as the filler, and it has the morphology of nanoparticles with a particle size of about 150 nm (Fig. 3b). After the deposition of SnO2, the SEM image of IO-TS-2 composite is presented in Fig. 3c, which maintains the same inverse opal structure as IO-TiO2 while many SnO2 particles are confined in the pores of TiO2. Meanwhile, IO-TiO2, IO-TS-1, IO-TS-2 and IO-TS-3 have large specific surface areas (Fig. S5 in Supporting information). This nanoscale hollow structure provides sufficient space for deposition of discharge products and volume expansion of SnO2 during the cycling. At the same time, its three-dimensional interconnection network and the open channel could make the electrolyte easy to permeate and provide a faster transport path for LIBs. These properties of this structure may bring enhanced electrochemical performance for LIBs. And the SEM images of IO-TS-1 and IO-TS-3 are shown in Fig. S6 (Supporting information).
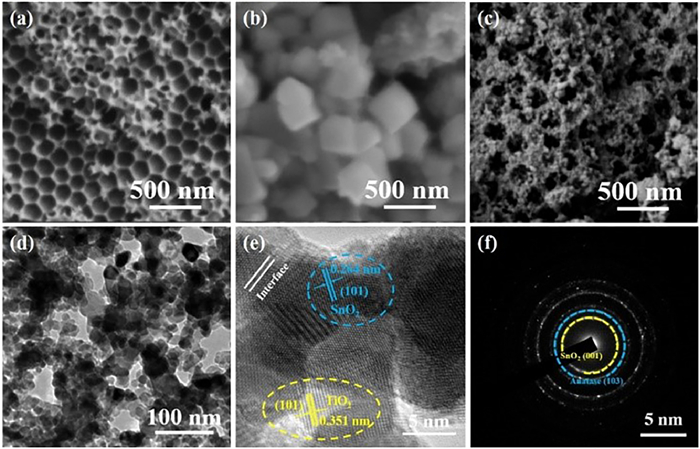
The TEM image of IO-TS is presented in Fig. 3d, and it displays the similar morphology with its SEM image. As shown in Fig. 3e, the lattice fringes with d = 0.351 nm can be attributed to (101) crystal planes of anatase TiO2, aside from the lattice fringes of SnO2 phase with d(101) = 0.264 nm. The nanocomposite exhibits a polycrystalline SAED pattern, spotted diffraction rings confirmed the coexistence of polycrystalline TiO2 and SnO2, the d values of 0.243 nm and 0.318 nm correspond to the (103) plane of TiO2 and (001) plane of SnO2, respectively. More detailed TEM images of IO-TiO2 are given in Fig. S7 (Supporting information). To determine the distribution of related element in IO-TS, the EDS test was carried out (Fig. S8 in Supporting information). The results showed that only Ti, O, Sn elements can be detected without other elements and these three elements were evenly distributed in the material, indicating that the composition of the entire composite material is uniform.
The electrochemical performances of IO-TiO2, IO-TS and SnO2 are shown in Fig. 4. SnO2 displays the higher capacity with poor rate performance while IO-TiO2 exhibits lower capacity with excellent rate capability (Fig. 4a). When IO-TiO2 was combined with SnO2, the rate capability was enhanced. However, with the increase of the addition of SnO2 contents, the capacity decreases, which is due to the higher SnO2 contents block the porous structure IO-TiO2, leading to the inefficient Li+ transfer (Fig. 4a). Details of electrochemical performances for all samples can be seen in Table 1.
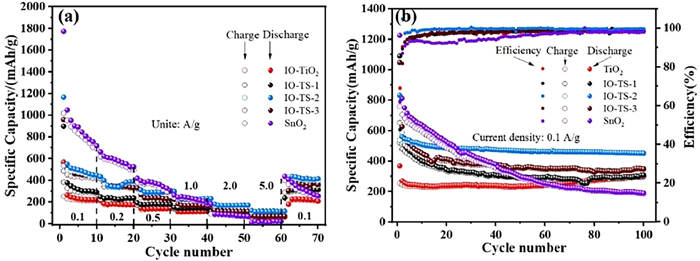
Cycling tests were performed on IO-TiO2, IO-TS-2, and SnO2 at a current density of 0.1 A/g, as shown in Fig. 4b. Inverse opal TiO2 show discharge capacities of 568.3 mAh/g at the fist cycling, after 60 cycles, the specific capacity of IO-TiO2 electrode is obviously rising because Li+ storage is generated by pseudocapacitance during charge and discharge, thus increasing the specific capacity and energy density. After 100 cycles, the discharge capacity of IO-TiO2 still remains 301.9 mAh/g which is higher than the most of other TiO2-based anodes. As SnO2 is an extremely high-capacity anode material (782 mAh/g), it shows a higher initial capacity of 800 mAh/g at fist cycling but its capacity decreases sharply to 200 mAh/g after 60 cycles, attributed to the serious volume expansion. After combined with IO-TiO2, the cycling stability was improved due to the nanoconfinement effect of IO-TiO2 and the synergistic effect [35] between IO-TiO2 and SnO2. The porous skeleton of IO-TiO2 alleviates the volume expansion of SnO2 during charge and discharge, and enhances the cycling stability. Meanwhile, The synergistic effect of polycrystalline TiO2 and SnO2 nanocomposites can decrease internal resistance which enhances the cycling stability of electrode. The IO-TS-2 showed the best cycling performance and high capacity among all the samples (Fig. 4b). After 100 cycles, IO-TS-2 can maintain a reversible capacity of 452 mAh/g, showing the highest capacity and cycling stability among all samples. As shown in Fig. S9 (Supporting information), since the SnO2 content in IO-TS-1 is lower, the particle size is smaller and most of SnO2 fall on the framework of IO-TiO2, so it is easier to fall off IO-TiO2 skeleton during the cycling, resulting in capacity zttenuation during charge and discharge. The reason why the electrochemical stability of IO-TS-2 is higher than that of IO-TS-3 may be due to the excessive filling of SnO2 hinder the Li+ diffusion of in the porous framework and it will also take up too much vacant space, resulting in the inefficient diffusion during cycling.
To verify the excellent electrochemical stability of IO-TiO2, IO-TS-2, and SnO2 as anode materials for lithium-ion batteries, 100 charge/discharge tests were conducted. SEM photos of three sample electrodes after 100 times of charging and discharging are shown in Fig. 5. After 100 lithium and de-lithium cycles, IO-TiO2 (Figs. 5a and b) and IO-TS-3 (Figs. 5e and f) electrodes still maintain the porous skeleton structure, which proves that IO-TiO2 and IO-TS-3 have good cyclic stability and safety as the negative electrode of lithium ion batteries. SEM images before and after the cycling of SnO2 (Figs. 5i and j) electrode showed that the morphology of SnO2 electrode changed and the particles agglomerated during the process of lithium/de-lithium. By observing the cross sections of the electrodes before (Figs. 5g and k) and after (Figs. 5h and l) cycling, it can be found that the volume expansion rate of IO-TS-2 is 134%, which is lower than SnO2 (328%). The electrode thickness almost did not change before and after IO-TiO2 cycling (Figs. 5c and d). To probe the electrochemical behavior of IO-TS-2, the CV measurement was carried out in the potential range of 0.01–3.0 V at a scan rate of 0.1 mV/s (Fig. 6a). In the first cycling, the reduction peak of IO-TS is due to the formation of solid electrolyte interface (SEI) and the reduction of SnO2 to metal Sn. The reduction peak at 1.1 V and the oxidation peak at 1.25 V is referenced to the partial reversible reaction described in Eq. 1 [36]. It can be seen from the second cycling, one pair of redox peaks at 1.7 V/2.17 V belongs to Ti4+⇄ Ti3+ of TiO2 and the other two pair of peaks at 0.2 V/0.6 V [37,38] and 1.1 V/1.25 V correspond to the lithium/de-lithium of SnO2 (Eq. 2 [36] and Eq. 3 [39]), respectively. The reduction and oxidation peaks of the last two cycling overlap very well, which means that after the first lithium reaction, the lithium/de-lithium reaction is highly reversible.
|
|
(1) |
|
|
(2) |
|
|
(3) |
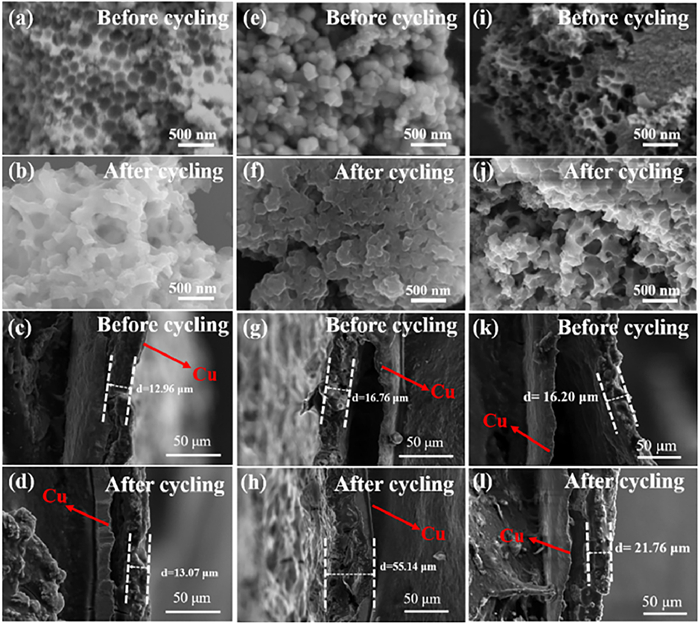
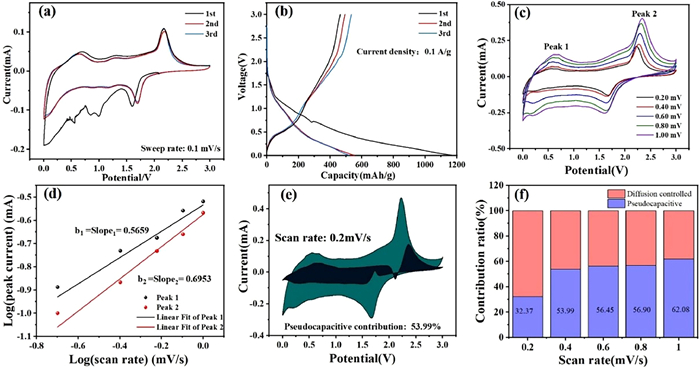
Fig. 6b shows the charge-discharge voltage profiles of IO-TS-2 for the first 3 cycling at a current density of 100 mA/g with a voltage range of 0.01-3 V. The difference in discharge capacity between the first and last two turns can be attributed to the irreversible loss of Li+ caused by the formation of SEI film corresponding well to CV result. It is obvious that IO-TS-2 exhibits a more retarded plateau below 1 V, due to that the addition of SnO2 contributes to most of the capacity. At the same time, the discharge/charge curves of the second and third cycling are highly coincident, which also proved that IO-TS-2 has good cyclic stability.
Previous studies have shown that Li+ storage is generated in the false capacitor during charging and discharging when porous materials are used as electrodes [40,41]. To verify whether there exists pseudocapacitance during charging and discharging, the volt-ampere cycling curve of IO-TS-2 at different scanning rates was measured (Fig. 6c) and the relationship between current and scanning speed was calculated. For a redox reaction, the peak current obey the power law [42]:
|
|
(4) |
where i is the current (mA), v is the scanning rate (mV/s), a is an arbitrary coefficient, and b can be used as a factor to determine whether pseudocapacitor exists. The pseudocapacitance is obtained by calculating the function between the current and the scanning rate (Fig. 6d). The logarithm of both sides of the equation gives a linear relationship between log(i) and log(v), and the slope of this linear equation gives the value of b (Fig. 6d). According to the theory, if b = 0.5, it means that battery type Li+ embedding (intercalation reaction) has occurred; if b = 1, it means that pseudocapacitive Li+ storage has occurred. After fitting calculation, the b values of IO-TS-2 at the two lithiation peaks are 0.56 and 0.69, respectively. In other words, storage mechanisms represent a mixture of limited diffusion and capacity processes. This process is thought to increase the fluidity of materials.
Furthermore, we calculated the ratio of pseudocapacitance of IO-TS-2 according to Eq. 5 [43]:
|
|
(5) |
k1v and k2v respectively correspond to the current contribution of pseudocapacity and nested processes. Figs. 6e and f show the pseudocapacity ratio at 0.2 mV/s and the pseudocapacity ratio by running speed. Pseudocapacitance brings a huge capacity contribution at all scan rates, and the ratio of pseudocapacitance at the sweep speed of 0.2, 0.4, 0.6, 0.8 and 1.0 mV/s can reach 32.37%, 53.99%, 56.45%, 56.90% and 62.08% respectively (Fig. 6d). With it, as the scan rate increases, pseudocapacitance can occupy a leading position in the process, thereby storing Li+. Pseudocapacity formed on the surface of the material cannot access the high current of the fast discharge process in such a short time.
EIS measurements were carried out to study the conductivity of the IO-TiO2, IO-TS-2 and SnO2 electrodes (Fig. 7). Samples of IO-TiO2, IO-TS-2 and SnO2 electrodes from 0.01 Hz to 1000 kHz electrochemical impedance spectrum (EIS) measurements of around 100 cycles in the frequency range were performed (all data were adjusted in ZView). Fig. 7a is the adjusted Nyquist curve and the equivalent impedance circuit after 100 cycling of 0.1 A/g. Herein, Rs is the internal resistance of the battery and is determined by the resistance of the electrolyte inside the battery, diaphragm and contact resistance of the battery shell; Rct represents the charge transfer resistance, and it depends on how fast the charge travels [44]; In addition, the diagonal line represents the Wabur resistance (W) and the rate of diffusion of lithium ions in a battery system. The diffusion coefficient of lithium ions can be obtained by Eq. 6 [45].
|
|
(6) |
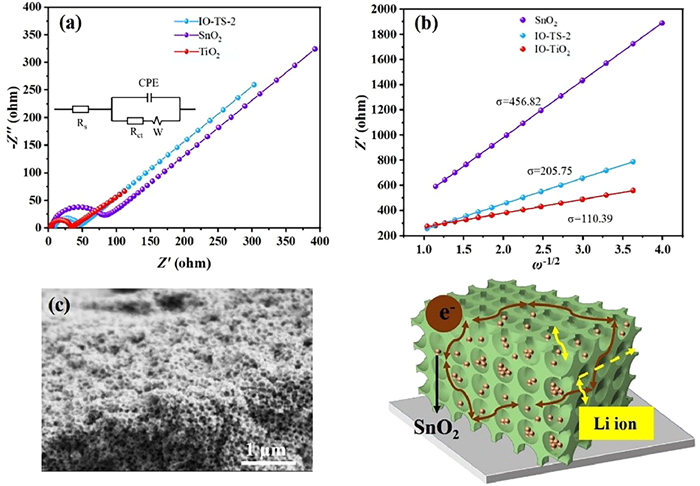
In formula R denotes a constant gas (8.314 J K−1 mol−1) and T denotes the ambient temperature (298.15 K), A denotes the surface of the electrode (0.785 cm2), and n denotes the number of electrons in the electronic transfer reactions. In respect of The Faraday constant (96,486 C/mol) is F, σ [46] is the slope of Z' and respect to ω1/2 (Fig. 7b), and C is the concentration of lithium-ion phase (mol/cm3). In this study, the C value for IO-TiO2, IO-TS-2 and SnO2 are 7.44 × 10⁻², 6.01 × 10⁻² and 1.63 × 10⁻² mol/cm3, respectively. Table S1 (Supporting information) details the impedance of each component before and after the cycling and the three sample lithium-ion diffusion systems. The results show that the IO-TS-2 has lower charge-transfer resistance and a higher Li+ diffusion coefficient. These performance improvements can be attributed to its special porous framework (Fig. 7c). Porous framework prevents the accumulation of particles to some extent, flattening the electron path and suppressing the resistance of charge movement. Small holes on the surface also provide Li+ with many fast channels, which can increase Li+ diffusion to some extent. Based on the above results, the excellent electrochemical properties were illustrated and demonstrated detailly in IO-TS.
In summary, the inverse opal TiO2/SnO2 composite were successfully prepared by mixing TiO2 with SnCl4 and then further treating it in air. In this rational design, the tin compound is effectively confined to a closed titanium dioxide frame due to physical capture and surface chemisorption. Inverse opal TiO2 has good electrical conductivity and the advantages of small size nanopores, large specific surface area and high active material utilization. The hollow structure provides enough space to accommodate the volume expansion during cycling, achieving long cycling life and high capacity as anode in LIBs. Therefore, the inverse opal TiO2/SnO2 has the potential to be used as a new click structure for LIBs, which opens a new way to prepare tin-based electrode materials from metal oxides.
The authors declare that they have no known competing financial interests or personal relationships that could have appeared to influence the work reported in this paper.
The authors appreciate the support of Project Supported by Keypoint Research and Invention in Shaanxi Province of China (No. 2020GY-270), this work was supported by the National Natural Science Foundation of China (No. U22A20144).
G. Kucinskis, G. Bajars, J. Kleperis, J. Power Sources 240 (2013) 66–79. doi: 10.1016/j.jpowsour.2013.03.160
N. Nitta, F.X. Wu, J.T. Lee, G. Yushin, Mater. Today 18 (2015) 252–264. doi: 10.1016/j.mattod.2014.10.040
M. Yilmaz, P.T. Krein, IEEE Trans. Power Electron. 28 (2013) 2151–2169. doi: 10.1109/TPEL.2012.2212917
Z.H. Rao, S.F. Wang, Renew. Sustain. Energy Rev. 15 (2011) 4554–4571. doi: 10.1016/j.rser.2011.07.096
L. Zou, F.Y. Kang, X.H. Li, et al., J. Phys. Chem. Solids 69 (2008) 1265–1271. doi: 10.1016/j.jpcs.2007.10.096
J.X. Zhang, Z.W. Xie, W. Li, S.Q. Dong, M.Z. Qu, Carbon 74 (2014) 153–162. doi: 10.1016/j.carbon.2014.03.017
C. Shen, G.H. Hu, L.Z. Cheong, et al., Small Methods 2 (2018) 1700298–1700306. doi: 10.1002/smtd.201700298
C.C. Chen, Y.A. Huang, C.H. An, et al., ChemSusChem 8 (2015) 114–122. doi: 10.1002/cssc.201402886
X. Kong, J. Zhang, J. Huang, et al., Chin. Chem. Lett. 30 (2019) 771–774. doi: 10.1016/j.cclet.2018.10.006
H.L. Yu, J.N. Zhao, L.B. Ben, et al., ACS Energy Lett. 2 (2017) 1296–1302. doi: 10.1021/acsenergylett.7b00273
M. Zier, F. Scheiba, S. Oswald, et al., J. Power Sources 266 (2014) 198–207. doi: 10.1016/j.jpowsour.2014.04.134
M.S. Park, G.X. Wang, Y.M. Kang, et al., Angew. Chem. Int. Ed. 46 (2007) 750–753. doi: 10.1002/anie.200603309
S.Z. Liu, K.L. Zhu, J.H. Tian, et al., J. Alloy Compd. 639 (2015) 60–67. doi: 10.1016/j.jallcom.2015.03.116
Z.L. Yang, S.P. Zhao, W. Jiang, et al., Electrochim. Acta 158 (2015) 321–326. doi: 10.1016/j.electacta.2015.01.146
Q.N. Liu, Y.H. Dou, B.Y. Ruan, et al., Chem. Eur. J. 22 (2016) 5853–5857. doi: 10.1002/chem.201505122
X. Xu, J. Liang, H. Zhou, et al., J. Mater. Chem. A 1 (2013) 2995–2998. doi: 10.1039/c3ta01372c
H.B. Li, J.P. Xiao, Q. Fu, X.H. Bao, Proc. Natl. Acad. Sci. U. S. A. 114 (2017) 5930–5934. doi: 10.1073/pnas.1701280114
X.L. Wang, G.S. Shi, S.S. Liang, et al., Phys. Rev. Lett. 121 (2018) 226102–2261027. doi: 10.1103/PhysRevLett.121.226102
S. Zhang, T. Hedtke, X. Zhou, M. Elimelech, J.H. Kim, ACS EST Eng. 1 (2021) 706–724. doi: 10.1021/acsestengg.1c00007
J. Ma, Y.R. Sun, M.Z. Zhang, et al., Environ. Sci. Technol. 51 (2017) 12283–12292. doi: 10.1021/acs.est.7b02227
X.L. Zhang, J.L. Shen, S.Y. Pan, J.S. Qian, B.C. Pan, Adv. Funct. Mater. 30 (2020) 1909014–1909020. doi: 10.1002/adfm.201909014
T.K. Vo, D.C. Hau, V.C. Nguyen, D.T. Quang, J. Kim, Appl. Surf. Sci. 546 (2021) 149087–149095. doi: 10.1016/j.apsusc.2021.149087
C. Ma, J.L. Jiang, T.T. Xu, et al., ChemElectroChem 5 (2018) 2387–2394. doi: 10.1002/celc.201800610
L. Sun, Z.L. Zhao, Y.C. Zhou, L. Liu, Nanoscale 4 (2012) 613–620. doi: 10.1039/C1NR11411E
M.L. Lee, C.Y. Su, Y.H. Lin, et al., J. Power Sources 244 (2013) 410–416. doi: 10.1016/j.jpowsour.2012.12.005
J.F. Ye, W. Liu, J.G. Cai, et al., J. Am. Chem. Soc. 133 (2011) 933–940. doi: 10.1021/ja108205q
H.W. Chen, Y.D. Lu, H.J. Zhu, et al., Electrochim. Acta 310 (2019) 203–212. doi: 10.1016/j.electacta.2019.04.134
H.G. Zhang, X.D. Yu, P.V. Braun, Nat. Nanotechnol. 6 (2011) 277–281. doi: 10.1038/nnano.2011.38
Z. Liang, G. Zheng, W. Li, et al., ACS Nano 8 (2014) 5249–5256. doi: 10.1021/nn501308m
J.N. Gao, B. Jiang, C.C. Ni, et al., Appl. Catal. B: Environ. 254 (2019) 391–402. doi: 10.1016/j.apcatb.2019.05.016
V. Perumal, C. Inmozhi, R. Uthrakumar, et al., Environ. Res. 209 (2022) 112821–112830. doi: 10.1016/j.envres.2022.112821
Y. Liu, Y. Jiao, Z. Zhang, et al., ACS Appl. Mater. Interfaces 6 (2014) 2174–2184. doi: 10.1021/am405301v
W.J. Cheng, Q. Feng, Z.L. Guo, et al., Chin. Chem. Lett. 33 (2022) 4776–4780. doi: 10.1016/j.cclet.2022.01.002
X. Shi, S.T. Liu, B. Tang, et al., Chem. Eng. J. 330 (2017) 453–461. doi: 10.1016/j.cej.2017.07.164
X. Wang, W. Cheng, J. Hu, et al., Nanoscale 14 (2022) 13696–13710. doi: 10.1039/D2NR03516B
R.Q. Liu, D.Y. Li, C. Wang, et al., Nano Energy 6 (2014) 73–81. doi: 10.1016/j.nanoen.2014.03.010
W. Jiang, D. Xiong, S. Wu, et al., Ceram. Int. 48 (2022) 27174–27181. doi: 10.1016/j.ceramint.2022.06.029
B. Wei, S. Yan, D. Jia, et al., Inorg. Chem. Commun. 145 (2022) 2587–2594.
Z.Q. Wang, X. Li, H. Xu, et al., J. Mater. Chem. A 2 (2014) 12571–12575. doi: 10.1039/C4TA02029D
F. Beguin, V. Presser, A. Balducci, E. Frackowiak, Adv. Mater. 26 (2014) 2219–2251. doi: 10.1002/adma.201304137
W.J. Cheng, Q. Feng, X. Wang, et al., Electrochim. Acta 440 (2023) 141758–141766. doi: 10.1016/j.electacta.2022.141758
H. Lindström, S. Södergren, A. Solbrand, et al., J. Phys. Chem. B 101 (1997) 7717–7722. doi: 10.1021/jp970490q
M. Lubke, P. Marchand, D.J.L. Brett, et al., J. Power Sources 305 (2016) 115–121. doi: 10.1016/j.jpowsour.2015.11.060
B.L. Corso, I. Perez, T. Sheps, et al., Nano Lett. 14 (2014) 1329–1336. doi: 10.1021/nl404349g
C. Chen, C.C. Ai, Y.W. He, S. Yang, Y.X. Wu, J. Alloy Compd. 705 (2017) 438–444. doi: 10.1016/j.jallcom.2017.02.143
X.Y. Du, W. He, X.D. Zhang, et al., J. Mater. Chem. 22 (2012) 5960–5969. doi: 10.1039/c1jm14758g

Figure 2 XRD patterns of (a) IO-TiO2, SnO2, IO-TS-1, IO-TS-2 and IO-TS-3. The corresponding high-resolution XPS spectra of (b) Ti 2p, (c) Sn 3d and (d) O 1s of IO-TS-2.

Figure 3 SEM images of (a) IO-TiO2, (b) SnO2, (c) IO-TS-2, (d) TEM image, (e) HRTEM image and (f) SAED pattern of IO-TS-2.

Figure 4 The rate performances (a) of IO-TiO2 IO-TS-1, IO-TS-2 and IO-TS-3 and SnO2, cycling performances (b) of IO-TiO2, IO-TS-1, IO-TS-2 IO-TS-3 and SnO2 at 0.1 A/g.

Figure 5 The microtopography photographs of IO-TiO2, SnO2 and IO-TS-2 electrodes (a, e and i) before and (b, f and j) after cycling. The cross sections of the IO-TiO2, SnO2 and IO-TS-2 electrodes (c, g and k) before and (d, h and l) after cycling.

Figure 6 (a) Volt-ampere cycling curves and (b) the capacity voltage curves of IO-TS-2. (c) Cyclic voltammetry test of IO-TS-2 at different sweep speed and (d) corresponding peak current versus square root of scan rates. (e) Pseudocapacitance contribution of IO-TS-2 at 0.2 mV/s. (f) Histogram of pseudocapacitance contribution at different scan rates.

Figure 7 (a) EIS measurements after cycling of IO-TiO2, IO-TS-2 and SnO2. (b) The slope of the plots of Z' against ω−1/2 of IO-TiO2, IO-TS-2 and SnO2. (c) Schematic diagram of fast charge transfer and Li+ diffusion.

 扫一扫看文章

扫一扫关注我们
 DownLoad:


 下载:
下载: